
Remember me
To identify and characterize SG-biased gene expression in human brain at a cellular level, we collected publicly available large single-nucleus RNA sequencing data from 419,885 nuclei (after filtering) from 161 human brain samples (72 females, 89 males) collected during entire human lifespan and disease from studies including both males and females (Figs. S3, S4). We generated consistent annotation of the cell types across studies (Supplementary file 1 for details) and defined 10 major cell types, namely dorsal and ventral progenitors, interneurons, excitatory neurons, astrocytes, T cells, microglia, endothelial cells, oligodendrocytes, oligodendrocyte precursors (OPCs), vascular cells. The data was grouped into 10 human life stages or age groups, namely second trimester, third trimester, 0–1 years, 1–2 years, 2–4 years, 10–20 years and adults (4 datasets). The diseases included were Alzheimer’s disease (AD, 2 datasets) and multiple sclerosis (MS, 1 dataset). We validated the sex of the samples from the metadata using X chromosome gene expression (Fig. S5). We stratified the samples by biological sex (female/male); however, we will henceforth use the sex and gender (SG) terminology because the exact source of the differential expression is uncertain: sex, gender, or both. The number of cells varied not only between sexes within the same dataset but also across different datasets (Figs. S4, S6). To guarantee robust results, we used a threshold of minimum 100 cells in each cell type/sex in each dataset. Thus, some cell types were not further analyzed in some or all datasets e.g. T cells (Fig. S6). 10 major cell types; not all were present in all datasets, including the physiological absence of certain developmental cell types in later ages (e.g. dorsal and ventral progenitors) were therefore analysed further.
We obtained differentially expressed genes (DEGs) between males and females, henceforth called SG-biased genes using default parameters from Seurat and generated a total of 260 cell type-specific SG-biased gene lists in human brain through life stages and disease. We further combined them in 166 gene lists by merging sub-cell types into one consistent cell type annotation. The number of DEGs varied greatly across the datasets (Fig. 1) with the number of cells in each dataset influencing greatly the number of DEGs (Fig. S7). No major differences in SG-biased genes were noted between males and females within a dataset with some exceptions e.g. excitatory neurons in the healthy adults and brain pathologies.
Fig. 1
SG-biased genes are present in multiple brain cell types, and across multiple ages and pathologies. We confirmed the presence of SG-biased genes across cell types and datasets in both sexes but the number of SG-biased DEGs varied greatly. The dot size indicates the number of SG-biased DEGs found in each cell type and dataset. The brain images, indicating the ages included in this study, were modified from (Konkel 2018)
To assess the robustness of SG-biased genes, we conducted multiple rounds of down-sampling on excitatory neurons (a cell type with large number of single cell data available) from three datasets (Velmeshev 3rd trimester, GSE157827 Healthy and Alzheimer’s disease), sampling 3, 5, 10, 50, 100, 250, and 500 cells per dataset and SG, repeating this ten times for each group. We calculated the SG-biased DEGs for these subsets using the same procedure described above and compared the common significant SG-biased DEGs among the same down-sampling sizes to determine the distribution of common genes. Smaller sampling sizes (3, 5, and 10) were excluded as they yielded no significant SG-biased DEGs. There was significant overlap between SG-biased genes across multiple down-sampling runs (only shown for Velmeshev 3rd trimester, Fig. S16). Larger sample sizes increased the number of common genes, justifying the inclusion of all available cells for each cell type in every developmental or disease group.
Mitochondrial Genes Show a Female-Biased Gene ExpressionWe firstly explored the genes highly and consistently SG-biased across datasets, both for females and males (Fig. 2). As expected, the gene with the highest sex and gender (SG) difference in expression was XIST. Other female-biased SG genes included the X chromosome gene JPX, mitochondrial genes, and the autosomal gene CADM2 (chromosome 3). Similarly, genes located on the Y chromosome were predominantly expressed in males. Additionally, three male-biased SG genes (TMSB10, HINT1, STMN1) are located on autosomal chromosomes. Interestingly, TMSB4X, an X-linked gene and a target of thymosin (a non-sex hormone), is similar to TMSB10.
Fig. 2
The most different SG-biased genes between sexes are mainly X- and Y-linked genes, with some exceptions. The heatmap displays the presence of the 20 most different genes between sexes (10 per sex) in SG-biased genes lists from each cell type and dataset. Most of the genes belong to either the X or Y chromosome. Notably, mitochondrial genes are among those uniquely expressed by females. Presence indicates whether the gene is found in each specific dataset-sex-cell type combination
MT genes generally exhibit higher expression levels in females across different cell types and age groups, with some exceptions (Fig. S8). Specifically, mitochondrial ribosomal genes like MT-RNR1 and MT-RNR2 show varied expression in female cells. Astrocytes, excitatory neurons, and interneurons consistently display increased MT gene expression in females. Conversely, MT-ATP8, which encodes ATP Synthase F0 Subunit 8, is the only mitochondrial gene with male-biased expression in excitatory neurons within the MS dataset and is not found in the female-biased gene list.
Genes functioning in mitochondria are encoded by both nuclear and mitochondrial DNA. nuclear genes associated with the Translocase Of Inner Mitochondrial Membrane/Translocase Of Outer Mitochondrial Membrane also exhibit differential expression patterns (Fig. S8). Previous studies have indicated a female bias in mitochondrial activity, with enzymes involved in the tricarboxylic acid (TCA) cycle exhibiting sex-biased gene expression. Mitochondrial complex II, which participates in both the respiratory chain and the TCA cycle using succinate as a substrate, is a key example (Lee et al. 2022). Most of the enzymes and proteins required for the TCA cycle are encoded by the nuclear DNA and then imported to mitochondria. We therefore investigated whether TCA enzymes (https://maayanlab.cloud/Harmonizome/gene_set/TCA+cycle/PANTHER+Pathways) showed SG-biased expression and found no such bias (Fig. S8).
In the down-sampling analysis mentioned earlier, many genes associated with mitochondrial function were consistently identified across various down-sampling sizes and repetitions. Notably, among genes that were found consistently SG-biased across all down-sampling runs: XIST, MT-ND4 (female-biased DEGs) and USP9Y, DDX3Y, NDUFS5 (male-biased DEGs), had a mitochondrial gene.
To gain further confidence on the female-bias of mitochondrial genes, we searched other publicly available single cell datasets in brain. Using the Single Cell Portal from the Broad Institute, we found differences in the expression of mitochondrial genes between female and male samples of human dopamine neurons from Parkinson’s disease patients (Kamath et al. 2022), fully supporting our findings (Fig. S9).
We further systematically explored whether SG-biased genes were preferentially located in specific sub-cellular locations. We obtained sub-cellular localization data of protein-coding genes from the Cell Atlas (Thul et al. 2017). Interestingly, the protein products of male-biased genes were enriched in endoplasmic reticulum in males, especially in non-neuronal populations (Fig. S10). Most corresponding proteins of the SG-biased genes were present in the cytosol, and we noted very little difference in sub-cellular location distribution between females and males, and across the datasets, except for the mitochondria, more frequent in females than in males (Fig. S10).
SG-Biased Genes are Largely Cell Type SpecificWe checked whether the SG-biased genes were shared across cell types in each dataset by calculating the overlap of gene lists across cell types. We noted that most SG-biased genes were highly specific to each cell type (Figs. S11, S12, S13, S14, S15). However, across datasets, SG-biased genes showed a higher overlap with cell types closely associated in developmental lineage, as expected. Specifically, developmentally related cell types exhibited a greater overlap of SG-biased genes compared to more distantly related cell types. For example, excitatory neurons and interneurons displayed a higher overlap of SG-biased genes compared to excitatory neurons and other non-neuronal cell types (Figs. S11, S12, S13, S14, S15).
We further explored this by using the original cell type annotations from individual datasets, which included additional sub cell types. For example, in the DISCO datasets, the neuronal population is further classified into many subtypes for both excitatory neurons and interneurons. Consistent with previous observations, the SG-biased genes were generally cell type-specific, even within the same major cell type. For instance, the various subtypes of excitatory neurons exhibited distinct differentially expressed genes (DEGs), with very few genes shared across the sub-populations (Figs. S11, S12, S13, S14, S15).
Cell type-specific SG-biased genes were mainly autosomal genes, and genes located on the X- and Y chromosomes tended to be shared across cell types (Figs. S11, S12, S13, S14, S15). One of the most shared SG-biased genes across all cell types and datasets was XIST, with female-specific expression (Figs. 2, S15). The same was observed for Y-expressed SG-biased genes such as DDX3Y and USP9Y.
We observed a cluster of shared male-biased genes across cell types in the second trimester dataset (Fig. 3A). The functional enrichment analysis of these shared genes showed that they were mainly involved in ribosomal and neurological diseases, including developmental pathologies (Fig. S17).
Fig. 3
The SG-biased genes are cell type- and developmental stage-specific, and enriched for cell type specific markers. A Heatmaps for SG-biased genes across cell types in the second trimester datasets. B This bar plot shows the percentages of cell type markers found in the SG-biased genes in each cell type, by sex. For most of the cell types, the highest percentages corresponded to the expected cell type. For example, the excitatory neurons and interneurons have the highest percentages of the neuronal markers. C Heatmaps for SG-biased genes across datasets for excitatory neurons and astrocytes. Presence indicates whether the gene is found in each specific dataset-sex-cell type combination
As SG-biased genes showed little overlap across cell types, we checked for the cell type-specific enrichment for known cell type markers, comparing the SG-biased genes with known genes from previously published data (McKenzie et al. 2018). Overall, for each reference cell type gene signature (astrocytes, endothelial cells, microglia, neurons and oligodendrocytes) greater overlap was observed in the corresponding cell types in our datasets. Exceptions were MS male patients, which showed higher percentage neuron markers for both astrocytes and oligodendrocytes, and female healthy patients which showed higher percentage of endothelial cells in astrocytes (Fig. 3B).
Since only samples from the cortex were included in this study, we investigated whether the SG-biased genes were specific to the cortex. A recent bulk RNA-seq study investigated sex differences in multiple tissues, including several brain regions (Oliva et al. 2020). We calculated the enrichment of the DEGs from this study in SG-biased genes, separately for each brain region. We found that the DEGs from the study were overall enriched in the female- but not in the male-biased genes (Fig. S18). The enrichment was found mostly in the data from early developmental stages, but not in the healthy adults (i.e. age-comparable samples to the original study) (Fig. S18). Moreover, SG-biased genes were found to be enriched in all brain region-specific DEGs from the study i.e. SG-biased genes were not cortex-specific (Fig. S19).
SG-Biased Genes are Developmental Stage SpecificWe also noted that most SG-biased genes were developmental stage specific (Figs. 3C, S20), and a very few DEGs for each cell types were shared among at least 75% of the datasets (Supplementary file 2). Most shared genes across datasets in a given cell type were located on the X and Y chromosomes (Supplementary file 2), while the majority of the unique genes were located on the autosomes, similar to shared genes across cell types in a specific age group described in previous section. However, some autosomal genes were shared SG-biased genes across datasets, such as RGS1 in females (microglia), CADM2 and MT genes (interneurons) in females, and several genes in vascular cells (e.g. STMN1 in males) and oligodendrocytes, both in females and males.
In each cell type for each SG, gene overlap analysis showed that the groups closer in age had a higher overlap of genes compared to the other groups (Figs. S21, S22, S23, S24). Additionally, the shared genes were mainly autosomal, although the genes shared by most datasets belonged to X or Y chromosomes (Fig. S25). For some datasets, such a temporal relationship was not noted. For example, SG-biased genes in MS and AD datasets had a higher overlap with SG-biased genes at younger ages than adult in astrocytes and microglia (Figs. S23, S24). Overall, significant overlap of SG-biased genes across related developmental stages across multiple cell types provided another proof of confidence in the SG-biased gene lists.
thus, the SG-biased genes not only were specifically expressed in each cell type across datasets, but also showed low overlap across age and disease groups within a cell type. A few highly shared genes across datasets were most located on the X and Y chromosomes.
Functional Implications of SG-Biased GenesTo understand the likely functional implications of SG-biased genes, we calculated gene ontology (GO) enrichment for the biological processes (BPs) terms for all SG-biased gene lists. We firstly checked overlap of enriched BPs across cell types in each group. Though there was not much gene overlap of SG-biased genes across cell types and datasets (Figs. S21, S22, S23, S24, S25), many BPs were shared among different cell types, indicating similar pathways enriched at specific dataset (Figs. 4A, B, S26, S27, S28, S29, Supplementary file 3). Across datasets, female-biased enrichment was primarily focused on brain-related BPs, such as neuron development, axonogenesis, and synapse-related terms. In contrast, BPs enrichment for males was mainly related to metabolism and cellular respiration. This difference was particularly pronounced in the earlier age datasets (second trimester to 2–4 years). However, in later age datasets, we observed brain-related functions enriched in males as well, especially in the MS and AD disease datasets (Figs. 4A, B, S26, S27, S28, S29). We checked the overlap of GO BPs enrichments across the age groups for each cell type as well (Figs. 4C, D, S30, S31, S32, Supplementary file 4). We again noted a high overlap of BP terms across datasets (Figs. 4C, D, S30, S31, S32). Excitatory neurons from females consistently showed enrichment in synapse- and axon-related biological processes (BPs), which were not enriched in the excitatory neurons of males. Some BPs were enriched only at specific developmental stages. For example, the respiratory electron transport chain and other metabolic processes were enriched in excitatory neurons in males during the fetal stage but not later. Additionally, these processes were not enriched in the excitatory neurons of females in any dataset (Figs. 4C, D, S30, S31, S32). We observed a consistent pattern across cell types: male-biased genes were primarily enriched for metabolic processes, while female-biased genes were mostly related to brain processes. For example, astrocytes in females showed enrichment in axon development and axonogenesis, whereas in males, the enriched BPs were predominantly metabolism-focused.
We further investigated enriched pathways using the Kyoto Encyclopedia of Genes and Genomes (KEGG) database. We noted a high overlap of enriched pathways across cell types in the fetal datasets, and cell types from older age groups did not display the same level of overlap (Figs. S33, S34, S35, S36, Supplementary file 5). Interestingly, most of the terms across all datasets were diseases and pathologies rather than physiological pathways, both neurological diseases and infections from a variety of pathogens, among which the most recurrent were prion, Parkinson’s and Coronavirus diseases (Figs. S37, S38, S39, Supplementary file 6).
Fig. 4
The SG-biased genes, despite being cell type- and developmental stage-specific, show overlap of enriched biological processes across both the cell types and the datasets. Both female- (A) and male-biased genes (B) showed overlap of enriched terms across different cell types, here as shown in the second trimester dataset. Similar findings were observed when instead of cell types, we compared multiple datasets in each cell type. Again, we observed an overlap in enriched biological processes both in female- (C) and male-biased genes (D) in excitatory neurons across datasets. The dot size indicate show many genes were found to belong to each GO BP term, and the color is the adjusted p-value (Benjamini–Hochberg correction)
We also investigated the enrichment of transcription factor (TF) binding sites using the TRANSFAC and JASPAR position weight matrices (PWMs) database in enrichR (Chen et al. 2013; Kuleshov et al. 2016). When TF motif enrichments for the cell types in each dataset were compared, TCFAP2A binding sites were enriched in female DEGs in 50% of the datasets. No highly shared TF binding sites were found in males (Figs. S40, S41, S42, Supplementary files 7 and 8). Similarly, the overlap of TF enrichments in each cell types across datasets showed that only two TFs were enriched at least in 50% of the cell types: TCFAP2A and POU1F1, both in females and no TFs were found in 50% of the cell types in males (Figs. S43, S44, Supplementary files 9 and 10). TCFAP2A target enrichment was found in excitatory neurons, interneurons, astrocytes, OPCs and dorsal progenitors, and mostly during the early development, from the second trimester of gestation to 2–4 years of age, and also in female MS patients (Figs. S43, S44). TCFAP2A enrichment was observed in males, specifically in excitatory neurons and interneurons at 10–20 years of age. In contrast, POU1F1 targets were almost exclusively enriched in females during early development (from the second trimester until 1–2 years of age). POU1F1 enrichment was found in females across various cell types, including excitatory neurons, interneurons, astrocytes, and dorsal and ventral progenitors. Additionally, POU1F1 was observed in male astrocytes and oligodendrocytes, respectively, in healthy adults (GSE174367) and in Velmeshev’s dataset for individuals aged 10–20 years.
Pathological Implications of SG-Biased GenesAs SG-biased genes showed pathology-related term enrichment in pathway analysis, we explored further using the following disease databases: disease ontology (DO), DisGeNet and DisGeNET CURATED, and GWAS catalog 2019 (Supplementary files 11, 12, 13 and 14). After calculating the enrichment in each disease database, we selected the most common enriched terms in females and males in all datasets (Fig. S45A, Supplementary file 15). The most common enriched terms for females were drug use disorders and abuse, smoking, autistic behaviour and amyotrophic lateral sclerosis, among other brain-related pathologies. In males, the most common enriched disease terms were neoplasms, epilepsy, Alzheimer’s disease onset and other brain-related pathologies as well as for cancer-related terms. Additionally, we investigated the most common enriched terms for each cell type (Supplementary file 16). In females, astrocytes had enrichment for amyotrophic lateral sclerosis and androgen-insensitivity syndrome, while in males epilepsy-related terms were mostly enriched (Figs. S45A, S46). Excitatory neurons and interneurons were enriched in females for autistic behaviour and drug addiction-related disorders, while males displayed enriched terms for cancer-related terms, spermatogenic failure and epilepsy.
Autism is typically considered a male-biased disorder (Lai et al. 2017). Interestingly, we noted female-biased genes enriched for autism. We therefore used the SFARI autism genes database (https://gene.sfari.org/database/human-gene/) (Banerjee-Basu and Packer 2010) and calculated the number of SG-biased genes involved in autism (Figs. S47, S48). During early development (the second trimester and 1–2 years of age), nearly all cell types showed a higher autism-related gene overlap in females compared to males (Figs. S47, S48). In older age groups, either both female and male SGs had a similar number of autism-related genes, (e.g. in microglia), or males had more autism-related genes (e.g. in endothelial cells, and astrocytes). Additionally, most of these genes were located on the autosomes, indicating that the sex chromosomes were not the source of this bias (Fig. S48).
We also investigated the enrichment of disease-associated genes from the literature (Chlamydas et al. 2022) in our SG-biased genes. Notably, we found higher overlap of disease-associated genes with the female-biased genes than with the male-biased (Fig. S49). Two genes, KDM6A and PCDH11X had higher expression in females, and have been associated with a higher protection from the brain-related diseases (Chlamydas et al. 2022). Furthermore, KDM6A was expressed more ubiquitously in glial cells (astrocytes, oligodendrocytes), microglia and vascular cells (Fig. S49), and was expressed mainly in the younger datasets (third trimester until 20 years of age). PCDH11X showed a cell type-specificity, mainly neurons (Fig. S49) and was predominantly expressed in the early childhood.
Lastly, we investigated whether the SG-biased genes were enriched for drug targets, using the DSigDB database from enrichR. We noted that most of the enriched drug targets were present in both sexes (Fig. S45C, Supplementary files 17 and 18). The three most frequent enriched drugs in females were trichostatin, retinoic acid and valproic acid targets. Moreover, they were enriched in nearly all cell types in females. Males showed enrichment for these drugs as well, although to a lesser extent (Fig. S50, Supplementary file 19).
Origins of the Sex and Gender BiasWe finally explored likely source of SG-biased gene expression. We have noted before that the majority of SG-biased genes were located on the autosomes (Figs. S11, S12, S13, S14, S15, S25). Sex-biased genes in some cell types (vascular cells, OPCs, microglia, interneurons and excitatory neurons) were enriched for the Y chromosome for the male-biased genes, while no enrichment was found for the X chromosome (Fig. S51). In previous microarray results, 91% of SG-biased genes in the dorsolateral prefrontal cortex were autosomal, higher than in other regions (Mayne et al. 2016), suggesting that indeed the sex bias in the cortex may be less dependent on the sex chromosomes than in other brain regions. We further explored whether the genes escaping X chromosome inactivation (XCI) (Mousavi et al. 2020) had a female-bias (Fig. S52). Firstly, only a few XCI genes were expressed SG differentially in brain. Furthermore, TMSB4X was more expressed in males than in females (Fig. 2). Interestingly, its Y-linked counterpart, TMSB4Y, was ubiquitously expressed at much lower levels in all datasets (Fig. S53).
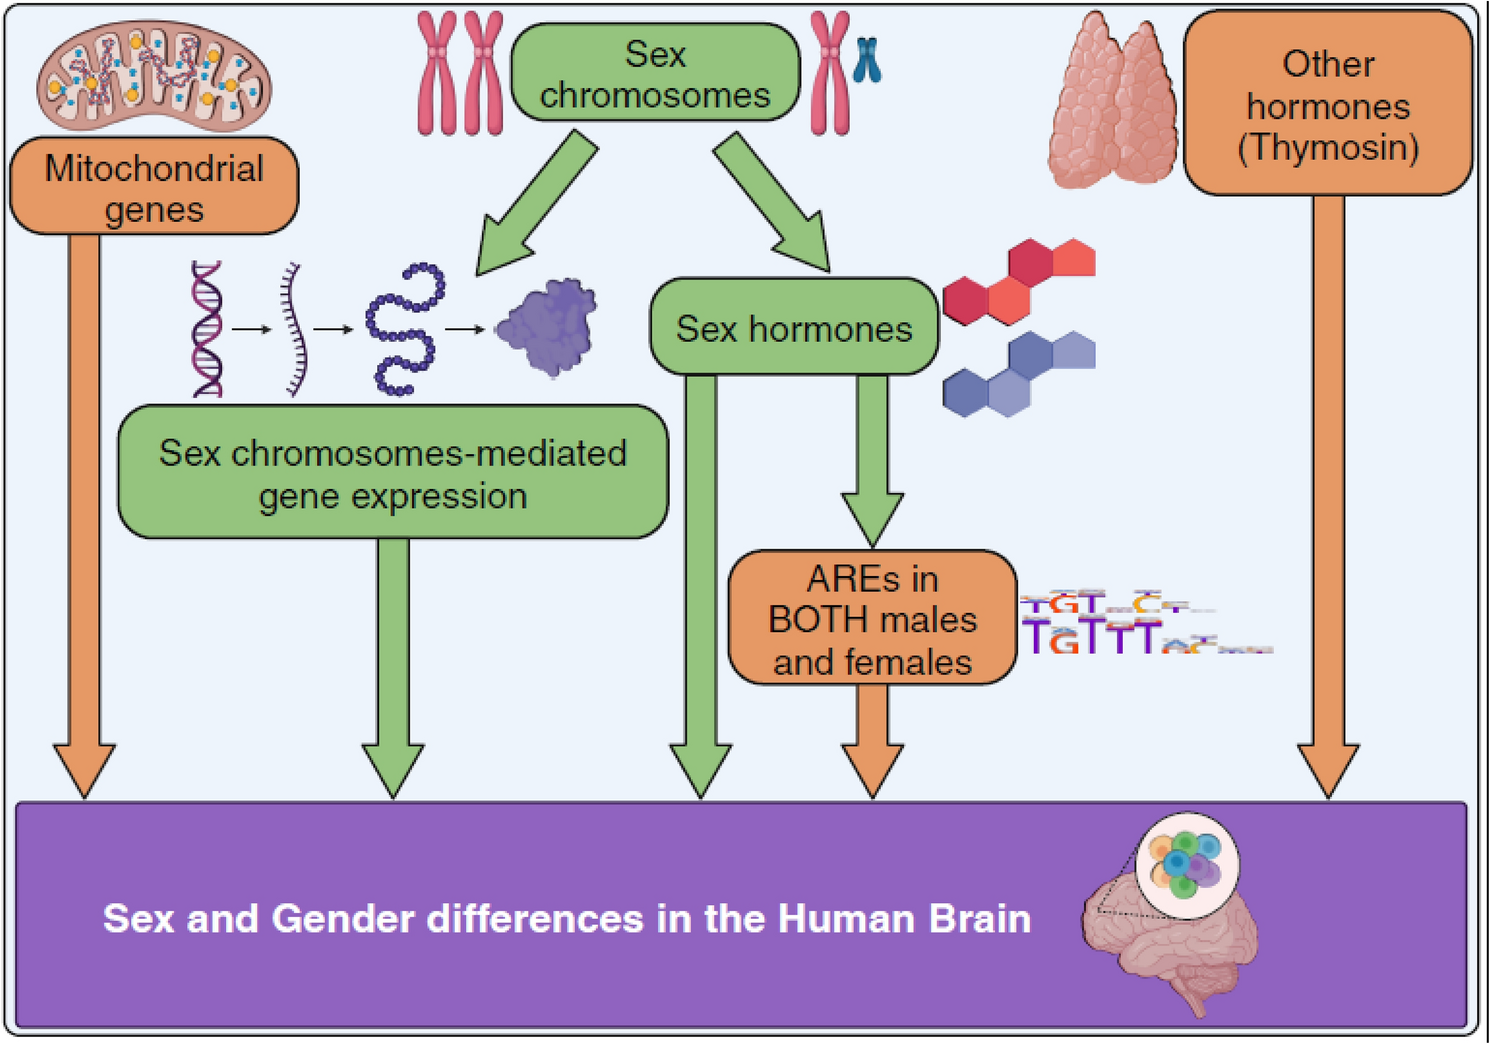
Sex-divergent brain development is believed to be caused primarily by the testosterone exposure in-utero, where early testosterone exposure impacts social behaviours e.g. sexual orientation and gender identity, and brain structure and functions (Hines 2020; Bakker 2021). To determine if sex hormones might indirectly influence the expression of SG-biased DEGs, we examined the presence of androgen and estrogen response elements (AREs and EREs), which are downstream of the activation of androgen and estrogen nuclear receptors (Claessens et al. 2008; Rettberg et al. 2014), using previously published data (Bourdeau et al. 2004; Wilson et al. 2016). Circa 50% and 20% of tissue-specific genes had ARE and ERE sites respectively, including the brain (Fig. S54). While we
Comments (0)