
Remember me
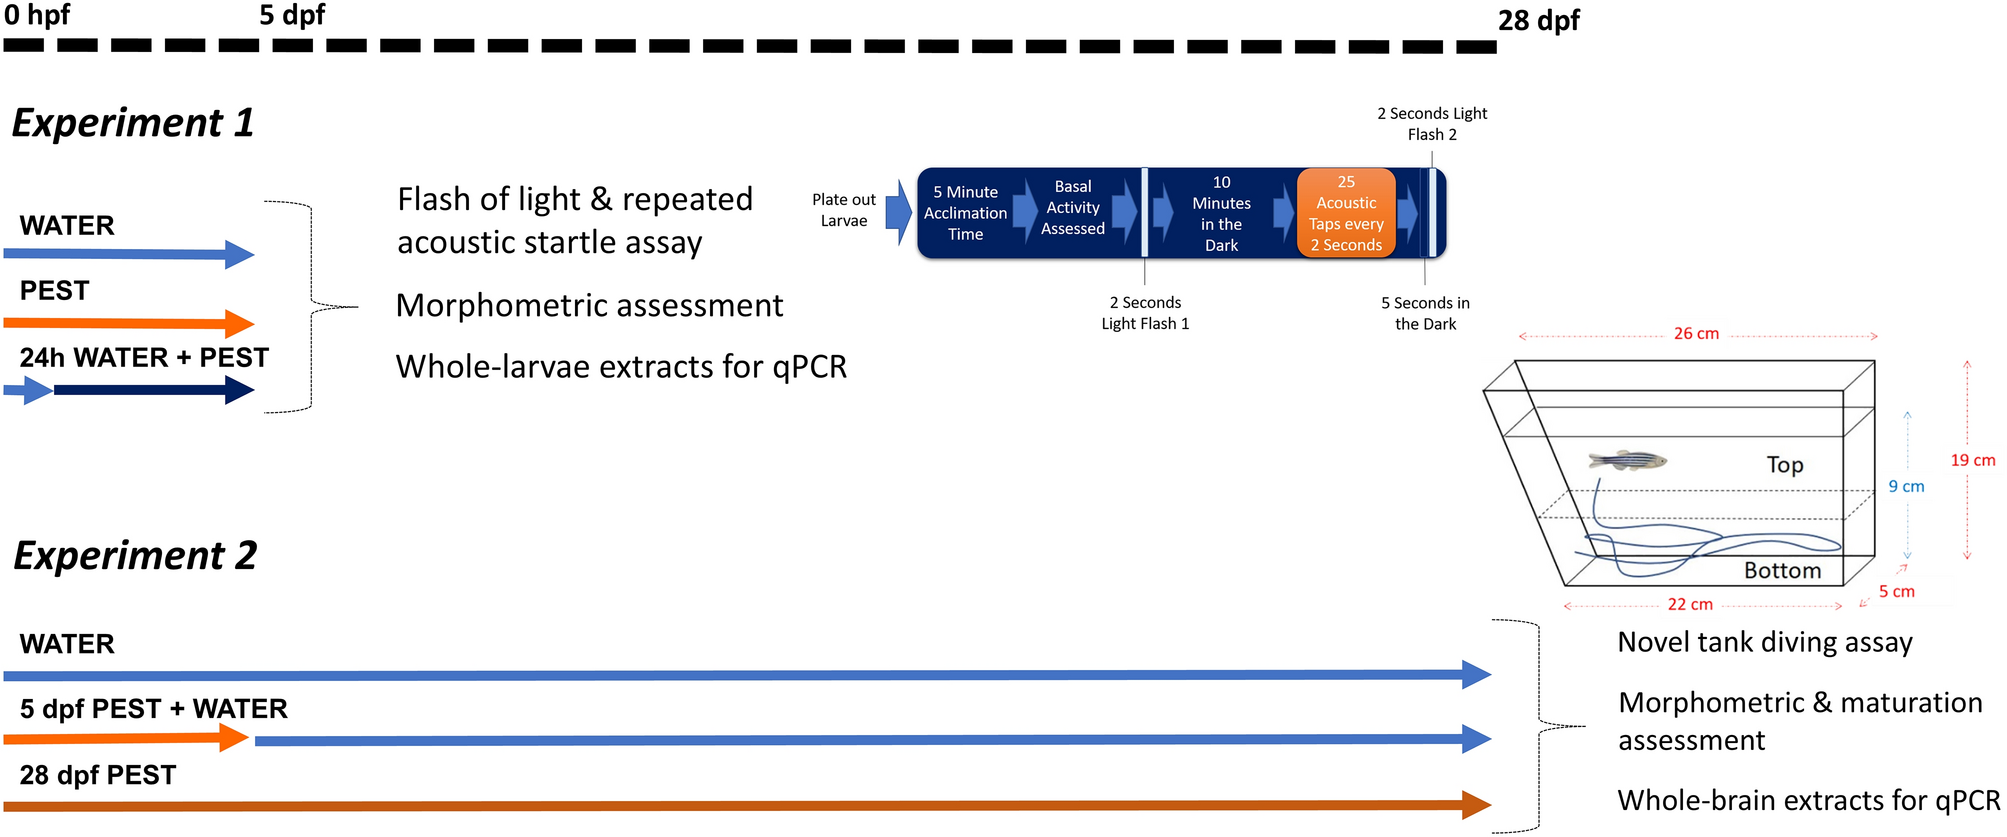


Zebrafish were used to assess whether an acute exposure to a low concentration of pesticides during early development had lasting effects. For that aim, experimental procedures were divided in two experiments (Fig. 1), both emerging form a single breeding event.
The concentration of PEST at which subjects were exposed, 0.5 μg/L, the maximum permitted concentration for total pesticides in drinking water, did not lead to an increased mortality of eggs/embryos during the first 5 dpf, as no significant differences between treatments were observed (Sup. Figure 2).
Fig. 2
Behavioural response to the ‘Flash of Light and Acoustic Startle Assay’ for 5 dpf zebrafish from Experiment 1. A Burst in activity (in mm) in response to the first flash of light for WATER (grey), PEST (orange) and 24hWATER + PEST (blue) groups; violin plots include points as single values. B Rate of habituation (R2 for each group as coloured line) from the mean distance moved (mm) to the 20 s following the first flash of light. C Percentage of fish responding to the 25 consecutive taps (cues for acoustic startle). D Mean distance moved by the fish of each group during the taps (acoustic cues). B and D show mean with ± Standard Error Mean (SEM) as shadows. *p < 0.05 for WATER vs PEST at corresponding tap number; Δp < 0.05 for WATER vs 24hWATER + PEST at corresponding tap number (annotated below each symbol)
Zebrafish larvae exposed to PEST show increased stress-reactivity at 5 dpfTo assess differences in basal locomotor activity, we measured total movement (distance travelled) for each fish during the first recorded minute (Basal 1 period). The comparison did not reveal any significant effect of treatment on basal locomotor activity (χ2 = 1.0085, p = 0.604). Compared to WATER-treated group, neither the 24hWATER + PEST nor the PEST groups showed significant difference (β = − 0.0019, p = 0.981; β = − 0.0738, p = 0.362; respectively). We similarly assessed total movement (distance travelled) for each fish during the four minutes following the initial 60 s after the flash (Basal 2 period: seconds ≥ 122 & seconds ≤ 362). As with Basal 1, there were no significant differences (χ2 = 0.3497, p = 0.8396; WATER vs 24hWATER + PEST: β = − 0.0260, p = 0.658; WATER vs PEST: β = − 0.0333, p = 0.584). Therefore, no pre-existing differences in movement were observed across the groups.
Next, we analysed the zebrafish reaction to the first flash of light, as this behaviour is mediated via their immediate stress response (Lee et al. 2019). First, we assessed the locomotor ‘burst activity’ in response to the change in illumination by comparing the movement of the fish before and after the flash (Fig. 2A). Normality tests on the data without outliers indicated a normal distribution (Kolmogorov–Smirnov D = 0.0615, p = 0.257). In addition, Levene’s test confirmed homogeneity of variances across treatment groups (F(2,268) = 0.879, p = 0.416). Based on these results, a linear model (LM) was deemed appropriate to analyse the ‘burst activity’. This comparison did not reveal significant differences between groups (R2 = 0.0002, F(2,268) = 0.031, p = 0.970).
Second, to evaluate the rate of recovery after the first flash of light we analysed movement over a 20 s period after the flash (starting at second 62, referred to as the 1st second, through second 81, the 20th second; Fig. 2B) using a GLMM with a Gamma distribution and log link. This analysis showed a significant effect of ‘time’ when comparing both conditions, 24hWATER + PEST and PEST, to WATER (β = − 0.0346, p < 2 × 10⁻¹⁶), indicating a general decrease in movement as time progressed. When assessing the effect of ‘treatment’ we observed that the 24hWATER + PEST group differed significantly from WATER (β = 0.6819, p = 0.00114) whilst PEST groups did not (β = − 0.0168, p = 0.93842). Similarly, when using 24hWATER + PEST as the reference group, a significant ‘treatment’ effect was observed in comparison to PEST (β = − 0.6987, p = 0.00201).
In addition, the interaction between ‘treatment’ and ‘time’ indicated slower recovery rate for the 24hWATER + PEST group compared to both WATER (β = − 0.0081, p = 0.00323) and PEST (β = − 0.0088, p = 0.00292) groups, by which 24hWATER + PEST maintained a higher level of movement throughout the recovery period. PEST group did not differ significantly from the WATER group in either locomotor activity (p = 0.938) or recovery rate (TreatmentPEST x Time (seconds): p = 0.253). Nonetheless, post-hoc comparisons of their rate of recovery did not reveal statistically significant differences in locomotor activity between groups (seconds 62–76, p > 0.05).
We then assessed the habituation of the fish to the acoustic startle stimulation in terms of both percentage of fish responding to each tap (Fig. 2C) and mean distance moved at each tap (Fig. 2D). All groups demonstrated habituation when considering the percentage of fish reacting to each tap across ‘treatment’ groups (WATER, PEST, and 24hWATER + PEST), with a significant decrease (β = − 0.0437, p < 0.0001) in the percentage of responders over time, from the 1st (WATER: 55.24%, PEST: 48.72%, 24hWATER + PEST: 53.93%) to the 25th tap (WATER: 20.00%, PEST: 16.67%, 24hWATER + PEST: 10.11%). There were no significant differences between groups (p > 0.05).
The GLMM analysis revealed that the interaction between ‘treatment’ and ‘tap number’ was not statistically significant (p > 0.1 for all interaction terms). However, ‘tap number’ had a significant main effect on ‘probability of response’ (β = − 0.057, p < 0.001), confirming that fish habituated to repeated stimuli. Estimated slopes for each treatment were as follows: 24hWATER + PEST (− 0.0571 ± 0.0077), WATER (− 0.0411 ± 0.0064), and PEST (− 0.0473 ± 0.0085), with no significant pairwise differences between treatments (Tukey-adjusted p > 0.2 for all comparisons).
The GLMM to analyse the total movement of zebrafish across the 25 taps (Fig. 2D), excluding the inter-tap movement, revealed a significant habituation effects over ‘time’ (tap.number, p < 0.001). Fish in the WATER group showed higher initial movement levels compared to the other groups, with a significant difference between the WATER and 24hWATER + PEST groups (β = 0.1083, p = 0.0438) and a significant difference between WATER and PEST (β = 0.1413, p = 0.0112). The interaction between treatment and tap number was not significant (WATER × tap.number: β = 0.0001, p = 0.921; PEST × tap.number: β = 0.0018, p = 0.243). Post-hoc pairwise comparisons of the total movement of fish after each tap showed that WATER group moved significantly more than the PEST group during the early taps (1 to 11, Fig. 2D), but these differences faded in the later taps.
As with the previous flash of light, no significant differences were observed between treatment groups in their immediate reaction to the second flash of light. The estimated effect for WATER relative to 24hWATER + PEST was not significant (Estimate = 0.0209, p = 0.540), and the effect for PEST relative to 24hWATER + PEST was also not significant (Estimate = − 0.0388, p = 0.291).
PEST exposure alters morphology and the expression of HPI genes at 5 dpfFollowing behavioural evaluation at 5 dpf (Experiment 1), randomly selected fish from each treatment were preserved for morphological assessment (Fig. 3, n = 12–16 per group) whilst others were snap-frozen and processed for RT-qPCR analysis (Fig. 4, n = 3, each replicate consisting of a pool of 8 fish).
Fig. 3
Morphological assessment for 5 dpf fish from Experiment 1. Morphological assessment of fixed larvae following behavioural assessment included the following measures: (A) total body length (BL), (B) eye length (EL), (C) eye width (EW), (D) head width (HW), (E) inter-ocular distance (IOD), (F) eye-snout distance (ESD). All measures corrected by BL, except BL itself. Violin plots include points as single values. *p < 0.05, ***p < 0.001 vs corresponding contrast
Fig. 4
RT-qPCR profiling for 5-dpf fish from Experiment 1. A RT-qPCR analysis for genes related to the HPI axis including crf (codifying corticotropin releasing factor), mr (mineralocorticoid receptor), grα (glucocorticoid receptor α) and the ratio mr/grα. B RT-qPCR for genes associated with an oxidative stress response, including sod1 and sod2 (superoxide dismutase 1 and 2), and cat (catalase). C RT-qPCR for genes involved in the catabolism of PEST and other genes previously associated with pesticide exposure, including ache (acetylcholinesterase), th1 (tyrosine hydroxylase 1) and cyp1a (cyto-chrome P4501A family 1 subfamily A). Graphs show mean ± SEM, dots show individual values. n = 3 pools of 8 embryos each; *p < 0.05 vs corresponding contrast
Morphological analysis (Fig. 3, Sup. Figure 1) showed that both eye width (EW) and head width (HW) were significantly affected by treatment (Fig. 3A, EW: F (2, 38) = 9.500, p = 0.0005; Fig. 3D, HW: F (2, 39) = 10.74, p = 0.0002). Post-hoc analysis demonstrated that this effect was due to a significant increase of both EW (p = 0.0003) and HW (p = 0.0001) in the 24hWATER + PEST fish when compared to water-treated animals, whilst subjects treated with PEST from 2 hpf did not differ in these measures to water-treated controls (EW: WATER vs PEST: p = 0.1025, PEST vs 24hWATER + PEST: p = 0.417; HW: WATER vs PEST: p = 0.0983, PEST vs 24hWATER + PEST: p = 0.0247). No other significant differences were detected (p > 0.05).
The expression analysis of genes implicated in the HPI axis (Fig. 4A) revealed a significant effect of ‘treatment’ (F (2, 24) = 4.018, p = 0.0312) but not of ‘gene of interest’ (F (3, 24) = 1.599, p = 0.2157) or the interaction between both factors [F (6, 24) = 1.289, p = 0.2995]. Post-hoc comparison showed that this effect was due to a significant difference between WATER and PEST treated fish for the crf gene (p 0.0399; other comparisons: p > 0.05), indicating a diminished activation of the HPI axis in PEST fish. Treatment also had a significant effect on the expression of genes involved on oxidative stress (Fig. 4B; F (2, 18) = 3.648, p = 0.0468), although post-hoc comparisons did not reveal any significant pairwise differences (p > 0.05). Finally, the expression of genes involved in pesticide metabolism and associated with pesticide-induced neurodegeneration (Fig. 4C), were not significantly affected (p > 0.05).
Early-life acute exposure to PEST reduces anxiety-like behaviours in juvenile zebrafish (28 dpf) similarly as a sustained exposureFirst, we assessed the total distance travelled by the fish (Fig. 5A, B), which served to measure potential differences on the overall activity induced by treatment. Our statistical model suggested that neither factor ‘time’ (β = − 0.0000051, p = 0.993) nor ‘treatment’ (β5dpfPEST+WATER = 0.0434, p = 0.745; β28dpfPEST = − 0.0410, p = 0.756) had a significant effect on the total distance travelled by the fish. Similarly, the interaction (how distance changes over time for different treatments) was also non-significant (βtime:5dpfPEST+WATER = 0.0000017, p = 0.998; βtime:28dpfPEST = 0.000319, p = 0.665).
Fig. 5
Behavioural response to the ‘Novel Tank Diving Test’ (NTT) for 28 dpf fish from Experiment 2. A Total distance (in mm) travelled by the fish during their time at the NTT for WATER (grey), 5dpfPEST + WATER (yellow) and 28dpfPEST (dark orange) groups. B Average distance travelled (mm) per minute in the assay. C Mean distance (in mm) to the bottom of the tank. D Average distance (in mm) to the bottom per minute in the assay. Violin plots (A and C) include points as single values. Graphs (B) and (D) show line as mean value with ± SEM as shadows. *p < 0.05 for WATER vs 5dpfPEST + WATER at corresponding timepoint
Second, we investigated the mean distance to the bottom of the tank through time in the NTT (Fig. 5C, D). This measure indicates how far the fish stayed from the bottom of the tank over time, providing insights into its anxiety levels. There were significant differences of both ‘Distance to Zone’ (zone being the ‘bottom of the tank’) across treatment groups and time (β = 0.0017, p < 0.001), thus suggesting there was a reduction in anxiety-like response throughout the time in the new environment.
Specifically, the WATER-treated group spent significantly more time at the bottom of the tank compared to both the 5dpfPEST + WATER group (β = 0.231, p = 0.013) and the 28dpfPEST group (β = 0.151, p = 0.088), indicating a potential anxiolytic effect of PEST exposure. However, there were no significant differences between the 5dpfPEST + WATER and 28dpfPEST groups (interaction term seconds: 5dpfPEST + WATER, β = − 0.0006, p = 0.162; seconds: 28dpfPEST, β = − 0.0003, p = 0.567).
When analysing post-hoc results by time intervals (minute bins), the mean distance to the bottom varied across treatments and time points, reflecting dynamic anxiety-like behaviours over the course of the test. Significant differences between the WATER-treated group and the 5dpfPEST + WATER group were observed in the earlier stages of the test by which the WATER group spent more time close to the bottom of the tank (1st minute: p = 0.027; 2nd minute: p = 0.0413), thus indicating lower anxiety-like responses in the PEST-exposed group during these initial time intervals. At later time points (180 and 240 s), these differences were no longer significant. Comparisons between 28dpfPEST and WATER groups and between 5dpfPEST + WATER and 28dpfPEST groups did not yield significant differences at any time point (p > 0.05).
PEST exposure exacerbates HPI axis alterations by 28 dpfAll juvenile zebrafish at 28 dpf were culled after NTT (Experiment 2). Some of those fish were randomly selected for morphological assessment (Sup. Table 2 and Sup. Figure 3, n = 8 per treatment group) whilst the brains of others (also randomly selected) were extracted and snap-frozen for RT-qPCR (Fig. 6, n = 3 per replicate, each replicate consisting of a pool of 3-5 brains).
Fig. 6
RT-qPCR profiling for 28 dpf fish from Experiment 2. A RT-qPCR analysis for genes related to the HPI axis: crf, mr, grα and the ratio mr/grα. B RT-qPCR for genes associated with an oxidative stress response: sod1 and sod2, and cat. C qPCR for genes involved in pesticide catabolism: ache, th1 and cyp1a. Graphs show mean ± SEM, dots show individual values. n = 3 pools of 3-5 brains each: *p < 0.05 vs corresponding contrast. *p < 0.05, **p < 0.01 vs corresponding contrast
Statistical analysis did not reveal any significant differences (all p > 0.05) in terms of overall maturity score (Sup. Table 2) nor in morphometric measures (Sup. Figure 3). Therefore, this suggests that neither PEST treatment induced any major morphological or maturation change in the fish at 28 dpf.
On the other hand, statistical analysis of genes implicated in the HPI axis by RT-qPCR (Fig. 6A) indicated a significant effect of ‘gene of interest’ [F (3, 24) = 20.60, p < 0.0001] and a close-to-significant effect of ‘treatment’ [F (2, 24) = 3.344, p = 0.0523]. In addition, the interaction ‘gene of interest x treatment’ was significant [F (6, 24) = 5.720, p = 0.0008]. Post-hoc comparisons demonstrated a significant decrease in the expression of crf in the 28dpfPEST when compared to both WATER (p = 0.0015) and 5dpfPEST + WATER groups (p = 0.0130), and a significant increased expression of mr, and in the mr/grα ratio, when compared to WATER group (p = 0.0168 and p = 0.0057, respectively) but not to the 5dpfPEST + WATER group (p = 0.1084 and p = 0.0913, respectively). No other comparison for the HPI-related genes was significant (p > 0.05). Thus, our data points to a dysregulation in the HPI axis induced by the exposure to PEST.
Genes coding for oxidative stress markers (Fig. 6B) did not show any effect of ‘treatment’ [F (2, 18) = 1.287, p = 0.3003], ‘gene of interest’ [F (2, 18) = 1.303, p = 0.2961], or the interaction of both factors [F (4, 18) = 0.4140, p = 0.7963].
Finally, genes associated with pesticide metabolism (Fig. 6C) only showed a significant effect of ‘gene of interest’ (‘gene of interest’: F (2, 18) = 6.303, p = 0.0084; ‘treatment’: F (2, 18) = 0.7392, p = 0.4914; interaction: F (4, 18) = 1.768, p = 0.1792). However, no post-hoc comparison was significantly different (all p > 0.05).
Comments (0)