
Remember me

To obtain a comprehensive overview of the metabolic changes resulting from the different exposures, we first conducted untargeted metabolomics. This allowed us to identify significantly regulated metabolites within each experimental group, which were then compared across all conditions. A total of 980 unique metabolite hits were identified in U937 cells, with 85 metabolites assigned a match factor (MF) greater than 0.9 (Supplementary Information Table S1). Volcano plot analysis identified three metabolites significantly upregulated following UV irradiation compared to control condition: glucose-1-phosphate, L-glutamic acid, and mandelic acid (Table S2). Exposure with 4 µM B[a]P regulated six metabolites, with two downregulated (indoleacetaldehyde and 5-hydroxy-L-tryptophan) and four upregulated (palmitic acid, fumarate, 3-sulfonalanine, and glutamate) compared to the control (Table S3). Combined 4 µM B[a]P and UV exposure elicited a more pronounced metabolic response, with 41 metabolites downregulated and 5 upregulated compared to control condition. Among them, 5-methylthioadenosine, glutaric acid, fumarate, and glutamine were strongly downregulated, while ƴ-linolenic acid, galactose, and mandelic acid were significantly upregulated. Interestingly, glutamate was downregulated in this group, contrasting its upregulation in the other exposure conditions (Tables S4).
We employed principal component analysis (PCA), to discriminate the regulated metabolites of the single (4 µM B[a]P) and combined exposure groups from those of the control conditions. The PCA plot clearly differentiated B[a]P and UV-exposed samples from the single exposed and control groups, suggesting a pronounced effect of the combined exposure on the metabolite profiles. Additionally, the plot indicated that individual exposures to UV or B[a]P did not significantly alter the metabolic profile in our experimental setting (Supplementary Information Figure S1). To identify common and unique regulated metabolites across the groups, orthogonal partial least squares discriminant analysis (OPLS-DA) was conducted, followed by the calculation of variable importance in projection (VIP) scores to assess metabolite contributions to the group separation (Figure S2).
As a complementary analysis to the volcano plot and VIP score, a Venn diagram was employed to provide a comprehensive overview of the metabolic changes across all experimental groups (Figure S3). Most notably, 40 metabolites were significantly differentially regulated (p < 0.1) exclusively in the combined exposure group, with no overlap observed with the other experimental groups. The combined exposure downregulated 37 metabolites, while 3 metabolites (docosahexaenoic acid, γ-linolenic acid, and galactose) were upregulated. This implies a distinct regulatory response in the combined exposure group, which is consistent with the PCA analysis. The B[a]P group uniquely featured 4 metabolites (5-hydroxy-L-trytophan, indoleacetaldehyde, palmitic amide, 3-sulfinoalanine). Mandelic acid and glucose-1-phosphate were shared between the UV and the combined exposure groups, while fumarate was unique to the B[a]P and the combined exposure groups. Notably, glutamate was common to all groups but exhibited a significant downregulation after combined exposure in contrast to an upregulation after single UV and B[a]P exposure (Figure S3).
Glutamine-centered metabolism under B[a]P and UVTo further investigate the biological implications of the differentially regulated metabolites, we mapped them to known metabolic pathways. By constructing a Sankey diagram, we visualized the flow of regulated metabolites through these pathways, providing insights into the underlying biological processes that may be regulated (Figure S4). This diagram revealed distinct metabolic profiles for each exposure group. Notably, the combined exposure to B[a]P and UV resulted in a marked enrichment of metabolites involved in alanine, aspartate, and glutamate metabolism, suggesting a central role for glutamine in the metabolic response.
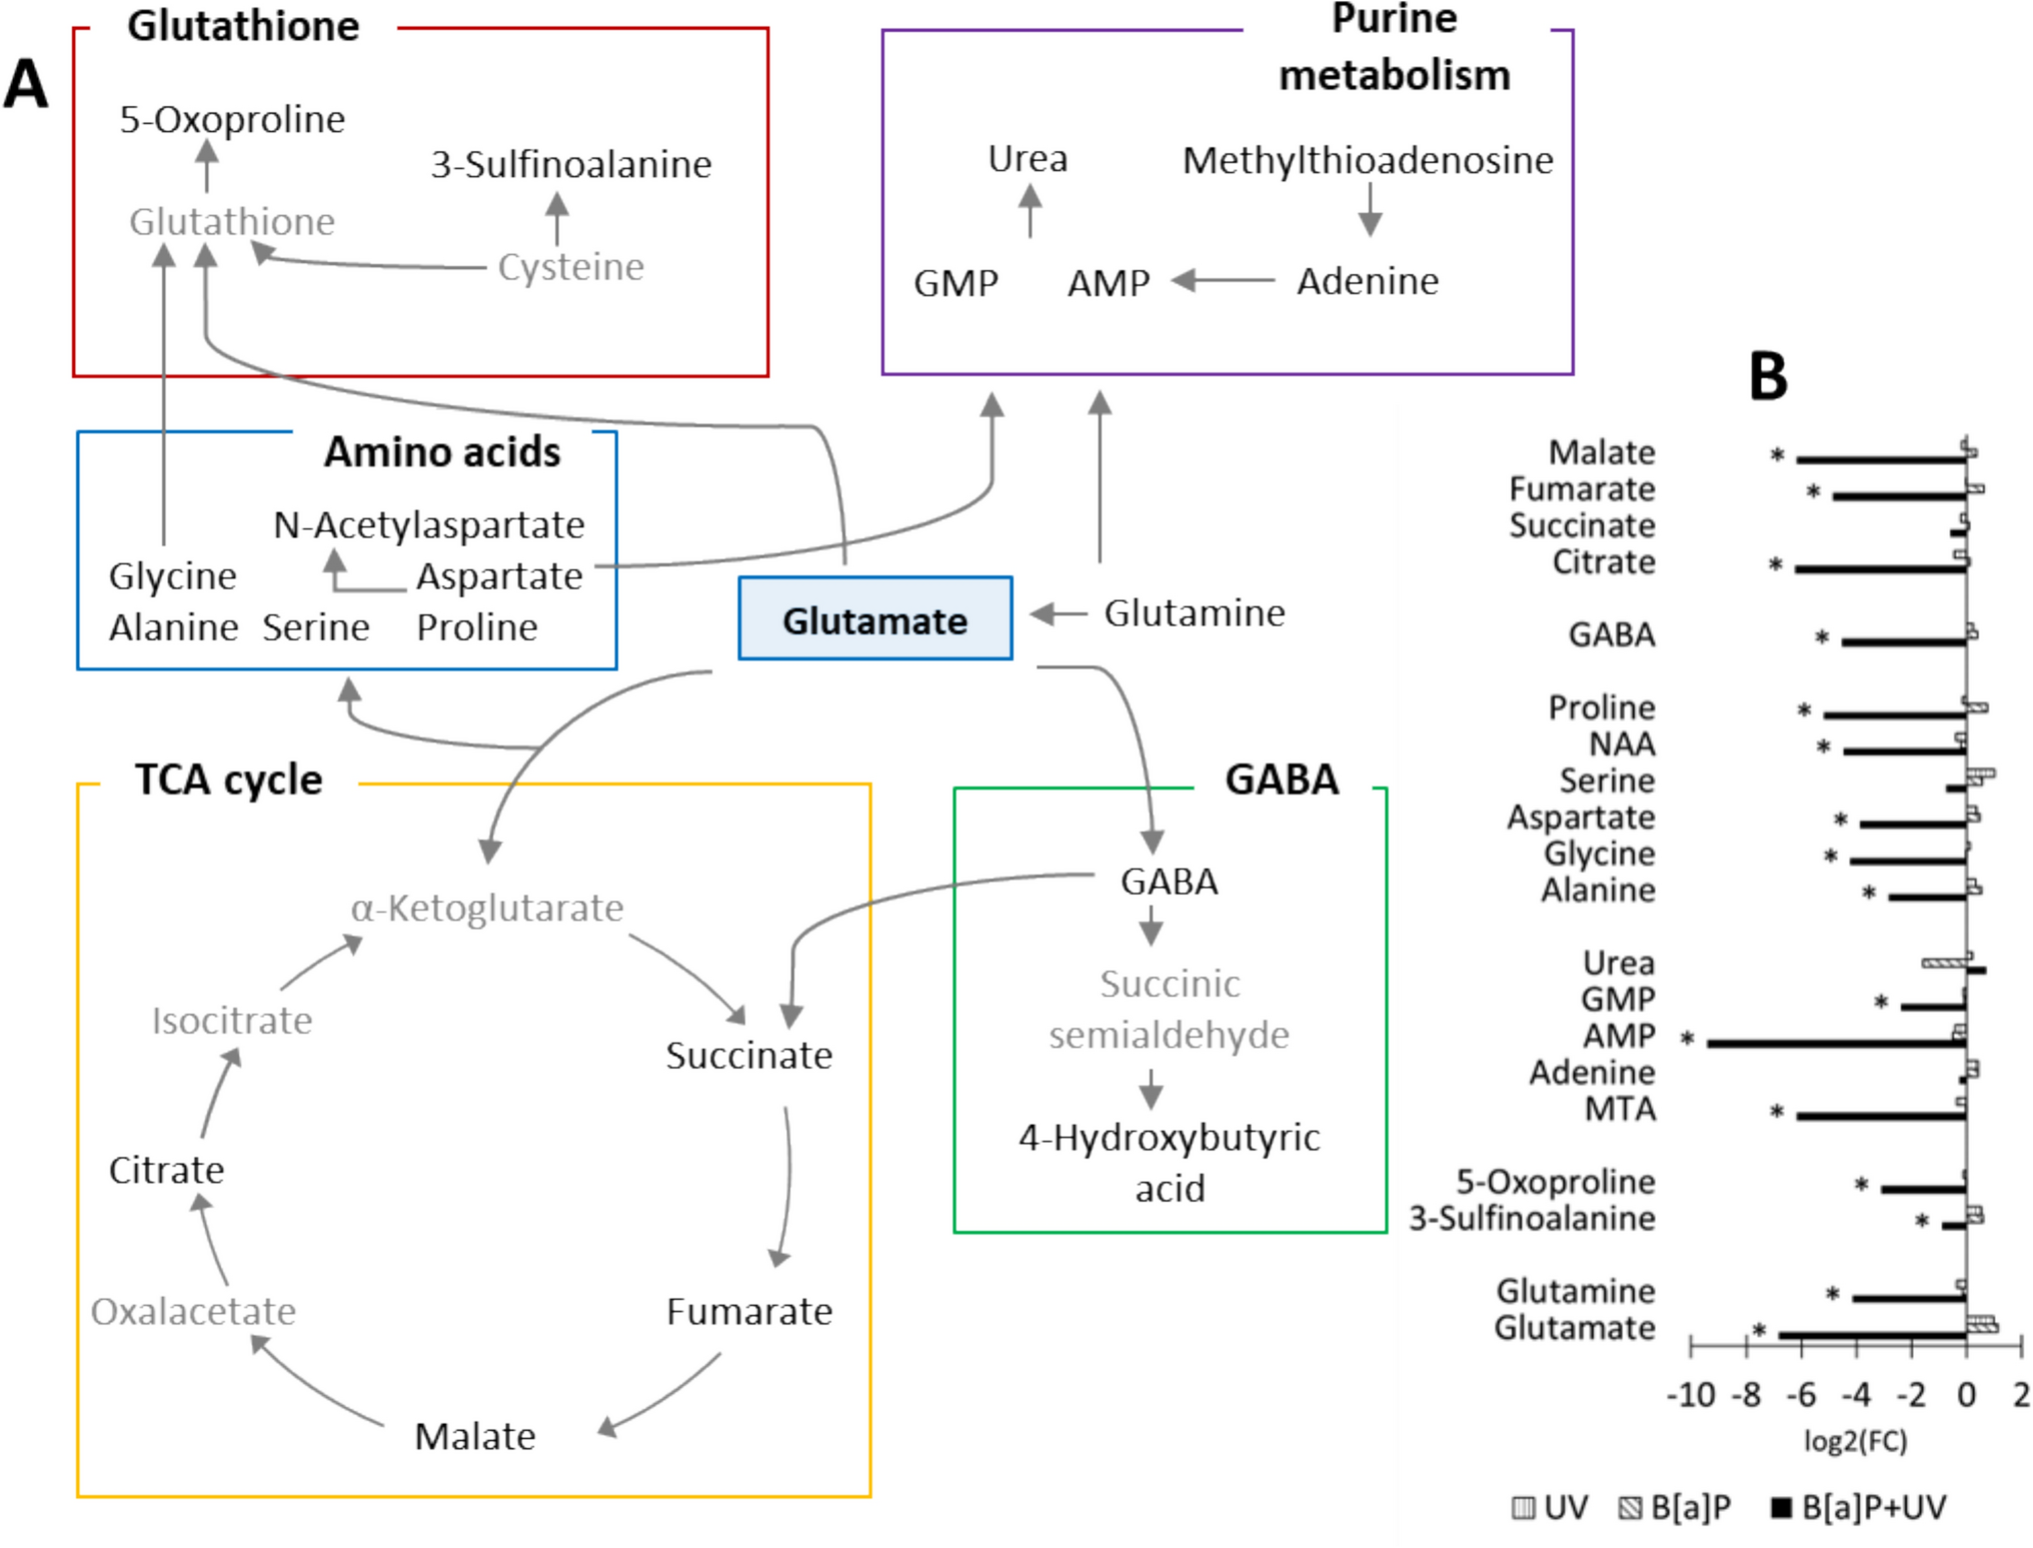
Glutamine is a central regulator of cellular amino acid pools and redox balance. Figure 1A illustrates the regulated pathways (glutathione metabolism, purine metabolism, amino acid biosynthesis, TCA cycle, and γ-aminobutyric acid (GABA)) in the exposed groups, highlighting significant metabolic shifts compared to control. Glutamine serves as a precursor for α-ketoglutarate, a key TCA cycle intermediate, and is converted to various amino acids via transamination. Glutathione, a major antioxidant, is synthesized from glycine, glutamate, and cysteine. Aspartate and glutamate contribute to nucleotide biosynthesis. Additionally, glutamate is the precursor of GABA, a neurotransmitter implicated in diverse physiological processes, including immune regulation, glucose homeostasis, and inflammation (Huang et al. 2019).
Fig. 1
A a schematic overview of the pathways influenced by glutamate in our study. Detected metabolites are highlighted in black, while undetected metabolites are shown in gray. B the log2 fold change of significantly altered metabolites (p < 0.05) between the treatment and control. Statistical significance was determined using one-way ANOVA followed by post hoc Fisher's LSD test. GABA γ-aminobutyric acid, GMP guanosine monophosphate, AMP adenosine monophosphate, NAA N-acetyl-L-aspartic acid, MTA methylthioadenosine, 5-oxoproline pyroglutamic acid
The importance of glutamine-dependent pathways in response to the combined exposure is highlighted by the numerous significantly regulated metabolites within these pathways. Notably, the combined exposure significantly downregulated a majority of metabolites (Fig. 1B).
Altered tryptophan metabolism in response to combined exposureThe tryptophan metabolism generates diverse bioactive compounds that influence a range of physiological processes, including inflammation, metabolism, immune responses, and neurological function (Xue 2023). Our Sankey and Venn diagram analyses revealed significant regulatory alterations within the tryptophan pathway (Figure S3 and S4). Specifically, we observed downregulation of indolelactic acid, a ligand for the aryl hydrocarbon receptor (AhR), in the indole pathway following combined exposure (Xue et al. 2023). In the serotonin pathway, both 5-hydroxy-L-tryptophan and serotonin were significantly regulated. Notably, only 5-hydroxy-L-tryptophan was upregulated following the combined exposure. While no direct tryptophan metabolites were detected in the kynurenine pathway, nicotinamide (niacinamide) and quinolinate, precursors of NAD+, were downregulated. As NAD+ is a cofactor in redox reactions, DNA repair, and cell signaling, its reduction may have broad implications. Additionally, the downregulation of metabolites in the kynurenine pathway, associated with lysine degradation and glutamate metabolism, highlights the interconnectedness of these pathways (Fig. 2A and B).
Fig. 2
A a schematic overview of the pathways influenced by tryptophan in our study. Detected metabolites are highlighted in black, while undetected metabolites are shown in gray. B the log2 fold change of significantly altered metabolites (p < 0.05) between the treatment and control. Statistical significance was determined using one-way ANOVA followed by post hoc Fisher's LSD test. AhR aryl hydrocarbon receptor, NAD + nicotinamide adenine dinucleotide
Untargeted and targeted lipidomics reveal complex lipid responses to combined exposureWe combined untargeted GC–MS with a targeted LC–MS/MS approach to comprehensively analyze lipid (components) changes.
While the untargeted analysis revealed only a few significantly regulated metabolites, the contrasting effects of the different exposures on docosahexaenoic acid (DHA) and the arachidonic acid precursors were notable (Fig. 3 A and B). DHA displayed a distinct pattern, being upregulated after combined exposure but downregulated after single exposures. Linoleic acid was downregulated, and γ-linolenic acid was upregulated following the combined exposure. These eicosanoid fatty acids, belonging to the polyunsaturated fatty acid (PUFA) family, function as lipid mediators, exhibiting both pro- and anti-inflammatory properties (Tyurina et al. 2019). The observed changes in the regulation of fatty acids involved in β-oxidation indicate a decreased rate of β-oxidation following combined exposure (Fig. 3B).
Fig. 3
A a schematic overview of the altered lipid pathways in our study. Detected lipids are highlighted in black, while undetected metabolites are shown in gray. The lipids marked with * were quantified using the targeted approach. B the log2 fold change of significantly altered lipids of the untargeted approach (p < 0.05) between the treatment and control. Statistical significance was determined using one-way ANOVA followed by post hoc Fisher's LSD test. C the log2 fold change of the significantly regulated lipids of the targeted approach. Statistical significance was determined using one-way ANOVA followed by post hoc Fisher's LSD test. TAG triacylglycerol, TCA tricarboxylic acid cycle, PUFA polyunsaturated fatty acid
The targeted analysis was performed to quantify sterols, glycerolipids, sphingolipids, and specific subclasses of glycerophospholipids (Fig. 3). Table S11 presents the lipids quantified using this approach, while Table S12 displays the significantly regulated ones. Based on volcano plot analysis, Tables S13–S15 provide a list of lipids that exhibited significant differential regulation in each exposure group relative to the control. Consistent with the previous analyses, targeted lipidomic profiling demonstrated a distinct clustering of lipid profiles in the combined exposure group as revealed by PCA (Figure S8). Venn diagram analysis indicated minimal overlap between all groups, and volcano plot analysis identified only a limited number of significantly regulated lipids in the individual exposure groups. The combined exposure group exhibited the most pronounced changes in lipid abundance, with LPC (14:1) showing the greatest decrease and LacCer (d18:1/22:1) the most significant increase (Figure S9). The hypothesis of increased LacCer degradation is supported by the significantly elevated galactose levels (see chapter on metabolites not assigned to a pathway).
The magnitude of lipid regulation was generally lower compared to that observed for metabolites in the untargeted analysis. ANOVA followed by post hoc Fisher's LSD test revealed significant lipid regulations as depicted in Fig. 3C. While no consistent trend was observed across individual lipid (sub)classes, sphingomyelins (SM) and phosphatidylinositol phosphates (PIP) exhibited a consistent downregulation following combined exposure. The reduced concentrations of inositol and inositol-2-phosphate, precursors of phosphatidylinositol phosphates, suggest a decreased production of these lipids (as shown in the chapter on unassigned metabolites).
Metabolites not assigned to specific pathwaysFigure S5 highlights metabolites of the untargeted metabolic profiling that exhibited significant regulation but did not align with any of the previously described pathways. The identified metabolites encompass a variety of amino acids (valine, norleucine, threonine, asparagine, isoleucine, alanylalanine), urea cycle intermediates (ornithine, homocitrulline), and compounds involved in glycolysis (galactose, lactate), the inositol pathway (inositol, inositol 2-phosphate), and DNA/RNA metabolism (thymine).
Combined exposure induces cytotoxicity, oxidative stress, and DNA damage: measurement of toxicological endpointsIn order to link the metabolomics data with potential toxicological effects, we performed a series of assays (Fig. 4, Table S17). Combined exposure to 4 µM B[a]P and UV significantly exacerbated oxidative stress, as indicated by altered GSH/GSSG ratio, elevated MDA levels, and decreased NQO1 activity. Intriguingly, ROS levels do not align with the other paramters of oxidative stress. Following combined exposure, ROS levels are paradoxically reduced compared to controls. While increased cytotoxicity might offer a partial explanation, the substantial elevation of all other parameters strongly suggests a pronounced state of oxidative stress.
Fig. 4
Effects of exposures on A oxidative status in terms of GSH/GSSG ratio, ROS, MDA, NQO1, B viability/cytotoxicity in terms of LDH, MTT, MMP, and (C) DNA damage, normalized to the control condition. Data are presented as mean ± SEM (n = 4 technical, n = 4 biological replicates; 3 technical replicates were performed for the COMET analyses). Statistical significance was determined by ANOVA with post hoc Scheffé test (p < 0.005). GSH/GSSG, reduced/oxidized glutathione; ROS reactive oxygen species, MDA malondialdehyde; NQO1 NAD(P)H:quinone oxidoreductase 1, LDH lactate dehydrogenase, MTT 3-(4,5-dimethylthiazol-2-yl)−2,5-diphenyltetrazolium bromide, MMP mitochondrial membrane potential
Cellular viability and cytotoxicity, assessed by LDH release, MTT reduction, and MMP, were significantly compromised in the B[a]P + UV group. Furthermore, DNA damage, as measured by comet assay, was significantly augmented in the B[a]P + UV group compared to control.
These findings suggest that the combined exposure to B[a]P and UV irradiation induces a synergistic effect, leading to pronounced oxidative stress, cytotoxicity, and DNA damage in the cells.
Dose–response relationship of combined B[a]P and UV exposure on cellular metabolismLastly, we aimed to elucidate the dose–response relationship of combined B[a]P and UV exposure at the metabolic level, particularly focusing on whether significant effects could be observed at lower B[a]P concentrations. To this end, we exposed cells to a range of B[a]P concentrations (0.04 nM, 4 nM, and 4 µM) in combination with UV irradiation. Notably, 25 metabolites were differentially regulated in a dose-dependent manner, with the most pronounced effects observed at the highest B[a]P concentration (4 µM) (Table S8). Principal component analysis and volcano plot analysis further highlighted the distinct metabolic profiles induced by the highest combined exposure (Tables S9–10, Figure S6, exposure to medium B[a]P combined with UV did not result in significant regulation). The Venn diagram demonstrates a clear dose-dependent effect of combined B[a]P and UV exposure on metabolite regulation. While low and medium B[a]P concentrations had minimal impact, the high B[a]P concentration significantly altered metabolite profiles, with AMP and citrate being most strongly downregulated and γ-linolenic acid and galactose being most strongly upregulated (Figure S7).
Comments (0)