
Remember me
A total of 539 patients were enrolled in this study; 527 patients with HER2-negative GC who received nivolumab plus chemotherapy as first line treatment were included in this analysis, excluding those who did not meet the eligibility criteria (Online Resource 4). The median follow-up period was 10.4 (interquartile range, 6.7–15.2) months. Details regarding the patient characteristics are described in Table 1. The median age of the included patients was 70.3 (range, 24–87) years. Of the included patients, 133 (25.2%) were aged ≥ 75 years; 345 (65.5%) were male; and 255 (48.4%), 224 (42.5%), and 36 (6.8%) had an ECOG PS of 0, 1, and ≥ 2, respectively. Regarding histology, 188 patients (35.7%) had an undifferentiated tumor type while 317 (60.2%) had a differentiated tumor type. Lymph node metastasis was the most common (291 patients; 55.2%), followed by peritoneal dissemination (243 patients; 46.1%) and liver metastasis (130 patients; 24.7%). PD-L1 CPS was tested in 451 patients (85.6%); 89 (19.7% of the 451 patients), 143 (31.7%), and 216 patients (47.9%) had tumors with a CPS of < 1, 1–5, and ≥ 5, respectively. MSI was tested in 220 patients (41.7%); 5.9% (13 of the 220 patients) had MSI-high tumors. Overall, 204 patients (38.7%) presented with ascites. Among the patients with ascites, 157 patients (77.0%) had mild-to-moderate ascites, 23 patients (11.3%) had massive ascites, and 24 patients (11.8%) had unclear results. Patient characteristics according to the PD-L1 CPS and combination chemotherapy regimens are shown in Online Resource 5.
Table 1 Patient characteristicsAt the data cutoff point, 114 patients (21.6%) continued to receive nivolumab plus chemotherapy. The most common reason for treatment discontinuation was ineffectiveness (n = 282, 53.5%) followed by AEs (n = 63, 12.0%) and patient requests (n = 9, 1.7%) (Table 2). The median duration of nivolumab treatment was 3.5 (range, 0.0–26.1) months, reflecting the drug-specific duration from initiation to discontinuation of nivolumab. The combination regimens for nivolumab plus chemotherapy were primarily SOX (n = 393, 74.6%), CapeOX (n = 36, 6.8%), and FOLFOX (n = 109, 20.7%), with 11 patients treated with multiple regimens. The median DOT—representing the overall first line treatment duration from initiation to the physician-determined end date—was 6.3 (95% CI, 5.8–7.0) months in patients with nivolumab plus SOX, 8.2 (95% CI, 4.4–18.0) months in those treated with nivolumab plus CapeOX, and 5.0 (95% CI, 3.8–6.5) months in those treated with nivolumab plus FOLFOX (Online Resource 6). Overall, 53 patients (10.1%) underwent surgery after nivolumab plus chemotherapy initiation.
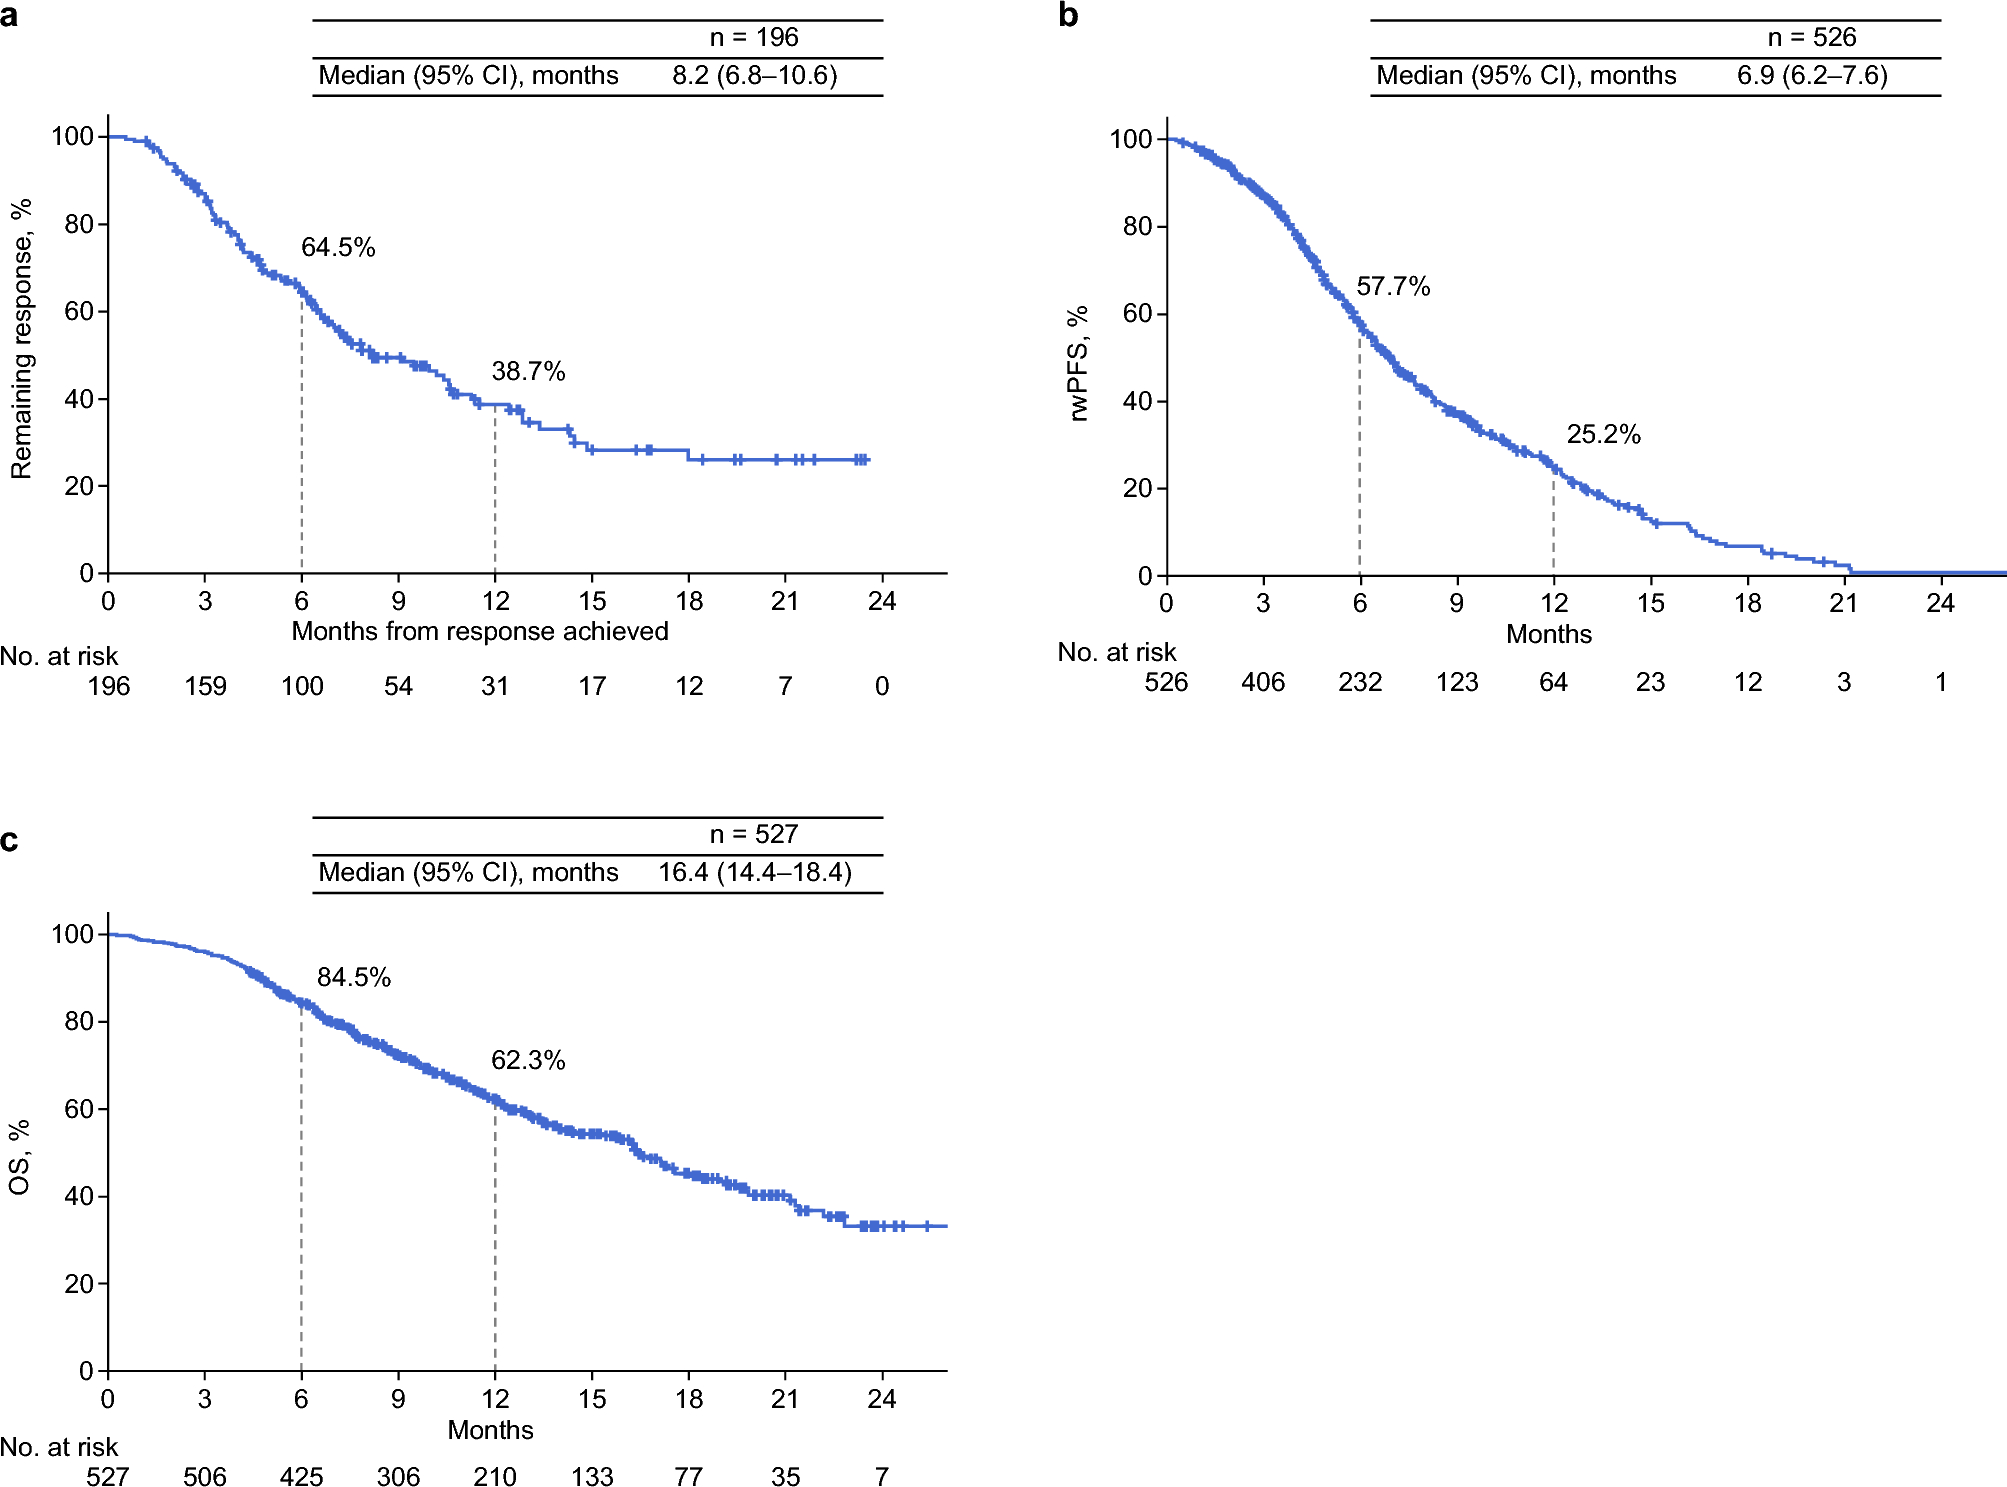
EffectivenessIn total, 527 patients were evaluated for effectiveness. Among 299 patients with measurable diseases and response evaluation, the ORR and disease control rate were 65.6% (95% CI, 59.9–70.9%) and 93.0% (95% CI, 89.5–95.6%), respectively, with eight (2.7%) patients achieving a complete response, 188 (62.9%) achieving a partial response, and 82 patients (27.4%) achieving stable disease (Table 3). Among patients with an objective response, 64.5% did not show progression within 6 months, with a median duration remaining response of 8.2 (95% CI, 6.8–10.6) months (Fig. 1a).
Fig. 1
Effectiveness outcomes a DOR, b rwPFS*, and c OS *One patient without available data on the date of confirmed rwPFS after nivolumab initiation was excluded from the analysis. Abbreviations: CI, confidence interval; DOR, duration of response; OS, overall survival; rwPFS, real-world progression-free survival
The median rwPFS was 6.9 (95% CI, 6.2–7.6) months, with a 6-month rwPFS rate of 57.7% (Fig. 1b). The median OS was 16.4 (95% CI, 14.4–18.4) months, with 6-month and 12-month OS rates of 84.5% and 62.3%, respectively (Fig. 1c).
Figures 2 and 3 show the results of subgroup analyses of ORR and rwPFS. By age, the ORR and median rwPFS were 64.0% (95% CI, 57.4–70.3%) and 6.7 months (95% CI, 6.0–7.5) for patients aged < 75 years and 70.4% (95% CI, 58.4–80.7%) and 7.4 months (95% CI, 6.2–8.6) for those aged ≥ 75 years, respectively (Figs. 2 and 3a). According to ECOG PS, the ORR was 70.3% (95% CI, 62.2–77.6%) for ECOG PS 0, 62.4% (95% CI, 53.6–70.7%) for ECOG PS 1, and 42.9% (95% CI, 17.7–71.1%) for ECOG PS ≥ 2 (Fig. 2), while the median rwPFS was 7.4 months (95% CI, 6.6–9.0), 6.9 months (95% CI, 6.0–7.9), and 3.5 months (95% CI, 2.7–4.2) for PS 0, 1, and ≥ 2, respectively (Fig. 3b). Based on PD-L1 CPS, the ORR and median rwPFS were 55.6% (95% CI, 40.0–70.4%) and 7.5 months (95% CI, 6.5–9.0), 61.7% (95% CI, 50.3–72.3%) and 6.2 months (95% CI, 5.5–8.0), and 72.5% (95% CI, 64.0–80.0%) and 7.0 months (95% CI, 6.2–8.2) for CPS < 1, 1–5, and ≥ 5, respectively (Figs. 2 and 3c). In patients without and with peritoneal dissemination, the ORRs were 72.9% (95% CI, 65.9–79.1%) and 53.2% (95% CI, 43.4–62.7%), respectively; the corresponding median rwPFS durations were 7.1 months (95% CI, 6.0–7.7) and 6.7 months (95% CI, 6.1–7.9), respectively (Fig. 3f). Regarding ascites, the ORR was 70.3% (95% CI, 62.7–77.2%) in patients without ascites, 59.2% (95% CI, 47.3–70.4%) in those with mild to moderate ascites, and 44.4% (95% CI, 13.7–78.8%) in those with massive ascites (Fig. 2). Among patients with peritoneal dissemination, the median rwPFS was 9.8 months (95% CI, 6.8–13.2) for those without ascites, 6.1 months (95% CI, 5.0–7.5) for mild to moderate ascites, and 4.2 months (95% CI, 2.5–6.4) for massive ascites (Fig. 3g). ORR and rwPFS data for MSI status, lymph node metastasis, and liver metastasis were also analyzed and are presented in Figs. 2 and 3.
Fig. 2
ORR by subgroup ORR was analyzed in patients with measurable disease and response evaluation, which were assessed by investigators per Response Evaluation Criteria in Solid Tumors v1.1. *MSI-low is not shown because only one patient was applicable. Abbreviations: BOR, best overall response; CI, confidence interval; CPS, combined positive score; CR, complete response; DCR, disease control rate; MSI, microsatellite instability; MSS, microsatellite stability; ORR, objective response rate; PD, progressive disease; PD-L1, programmed cell death ligand 1; PR, partial response; SD, stable disease
Fig. 3
rwPFS* by subgroups a Age (< 75 and ≥ 75 years), b ECOG PS (0, 1, and ≥ 2), c PD-L1 CPS† (< 1, 1–5, and ≥ 5), d PD-L1 CPS† (< 5 and ≥ 5), e MSI status‡ (MSS and MSI-H), f peritoneal dissemination (without and with), g ascites in patients with peritoneal dissemination§ (without, mild to moderate, and massive), h liver metastasis (without and with), and i lymph node metastasis (without and with). *One patient without available data on the date of confirmed rwPFS after nivolumab initiation was excluded from the analysis. †Seventy-nine patients without available PD-L1 CPS data were excluded from the analysis. ‡A total of 319 patients without available MSI data were excluded from the analysis. MSI-L is not shown because only 3 patients were applicable. §Twenty-eight patients with ascites whose ascites severity was unknown were excluded from the analysis. Abbreviations: CI, confidence interval; ECOG PS, Eastern Cooperative Oncology Group performance status; CPS, combined positive score; MSI, microsatellite instability; MSS, microsatellite stability; PD-L1, programmed cell death ligand 1; rwPFS, real-world progression-free survival; MSI, microsatellite instability
Second line treatmentAmong the 413 patients who discontinued nivolumab plus chemotherapy, 196 (47.5%) received second line treatment (Online Resource 7). The most common second line treatment regimen was paclitaxel plus ramucirumab (n = 79, 40.3%) or ramucirumab plus nab-paclitaxel (n = 79, 40.3%). The median TNT was 6.7 (range, 0.7–21.0) months (Online Resource 7).
Association of patient characteristics with rwPFSOnline Resource 8 summarizes the results of univariable and multivariable analyses of rwPFS. After multivariable analysis, ECOG PS (0–1 vs. 2–4; HR, 2.04; 95% CI, 1.23–3.38; p = 0.006), ascites (without vs. mild to moderate; HR, 1.26; 95% CI, 0.94–1.70; without vs. massive; HR, 2.79; 95% CI, 1.60–4.86; p = 0.001), and albumin per 1 g/dL increase (HR, 0.76; 95% CI, 0.61–0.96; p = 0.020) remained as significant factors affecting rwPFS.
SafetyAny grade and grade 3–4 TRAEs were observed in 481 and 213 patients (91.3% and 40.4%), respectively, with 55 patients (10.4%) discontinuing treatment due to TRAEs (Table 4). Any grade and grade 3–4 irAEs were observed in 136and 41 patients (25.8% and 7.8%), respectively, with the most common being endocrine disorders (59 patients [11.2%]) among irAEs of any grade. Treatment-related deaths occurred in five patients (0.9%). Pneumonitis caused death in four patients (0.8%), while febrile neutropenia caused the death in one patient (0.2%). Among the five patients with treatment-related death, three were aged < 75 years and two were aged ≥ 75 years; one had ECOG PS 0, three had ECOG PS 1, and one had unknown PS. A summary of safety by subgroup of patients by age and ECOG PS scores is presented in Online Resource 9.
The median time from nivolumab plus chemotherapy initiation to the onset of any grade irAE was 3.7 months (range, 0–24.6 months; Online Resource 10). The median time from nivolumab plus chemotherapy initiation to onset of grade ≥ 3 irAEs was 3.0 (range, 0.4–24.6) months (Online Resource 11). Of the 199 any grade irAEs, 135 (67.8%) resolved, with a median time from onset to recovery of 5.0 (range, 0.7–27.2) months (Online Resource 12). Of the 57 grade ≥ 3 irAEs, 42 (73.7%) resolved, a median time from onset to recovery of 5.1 (range, 1.8–27.2 months) months (Online Resource 13).
Comments (0)