
Remember me

This study was approved by the institutional review board, and the informed consent requirement was waived due to the retrospective study design.
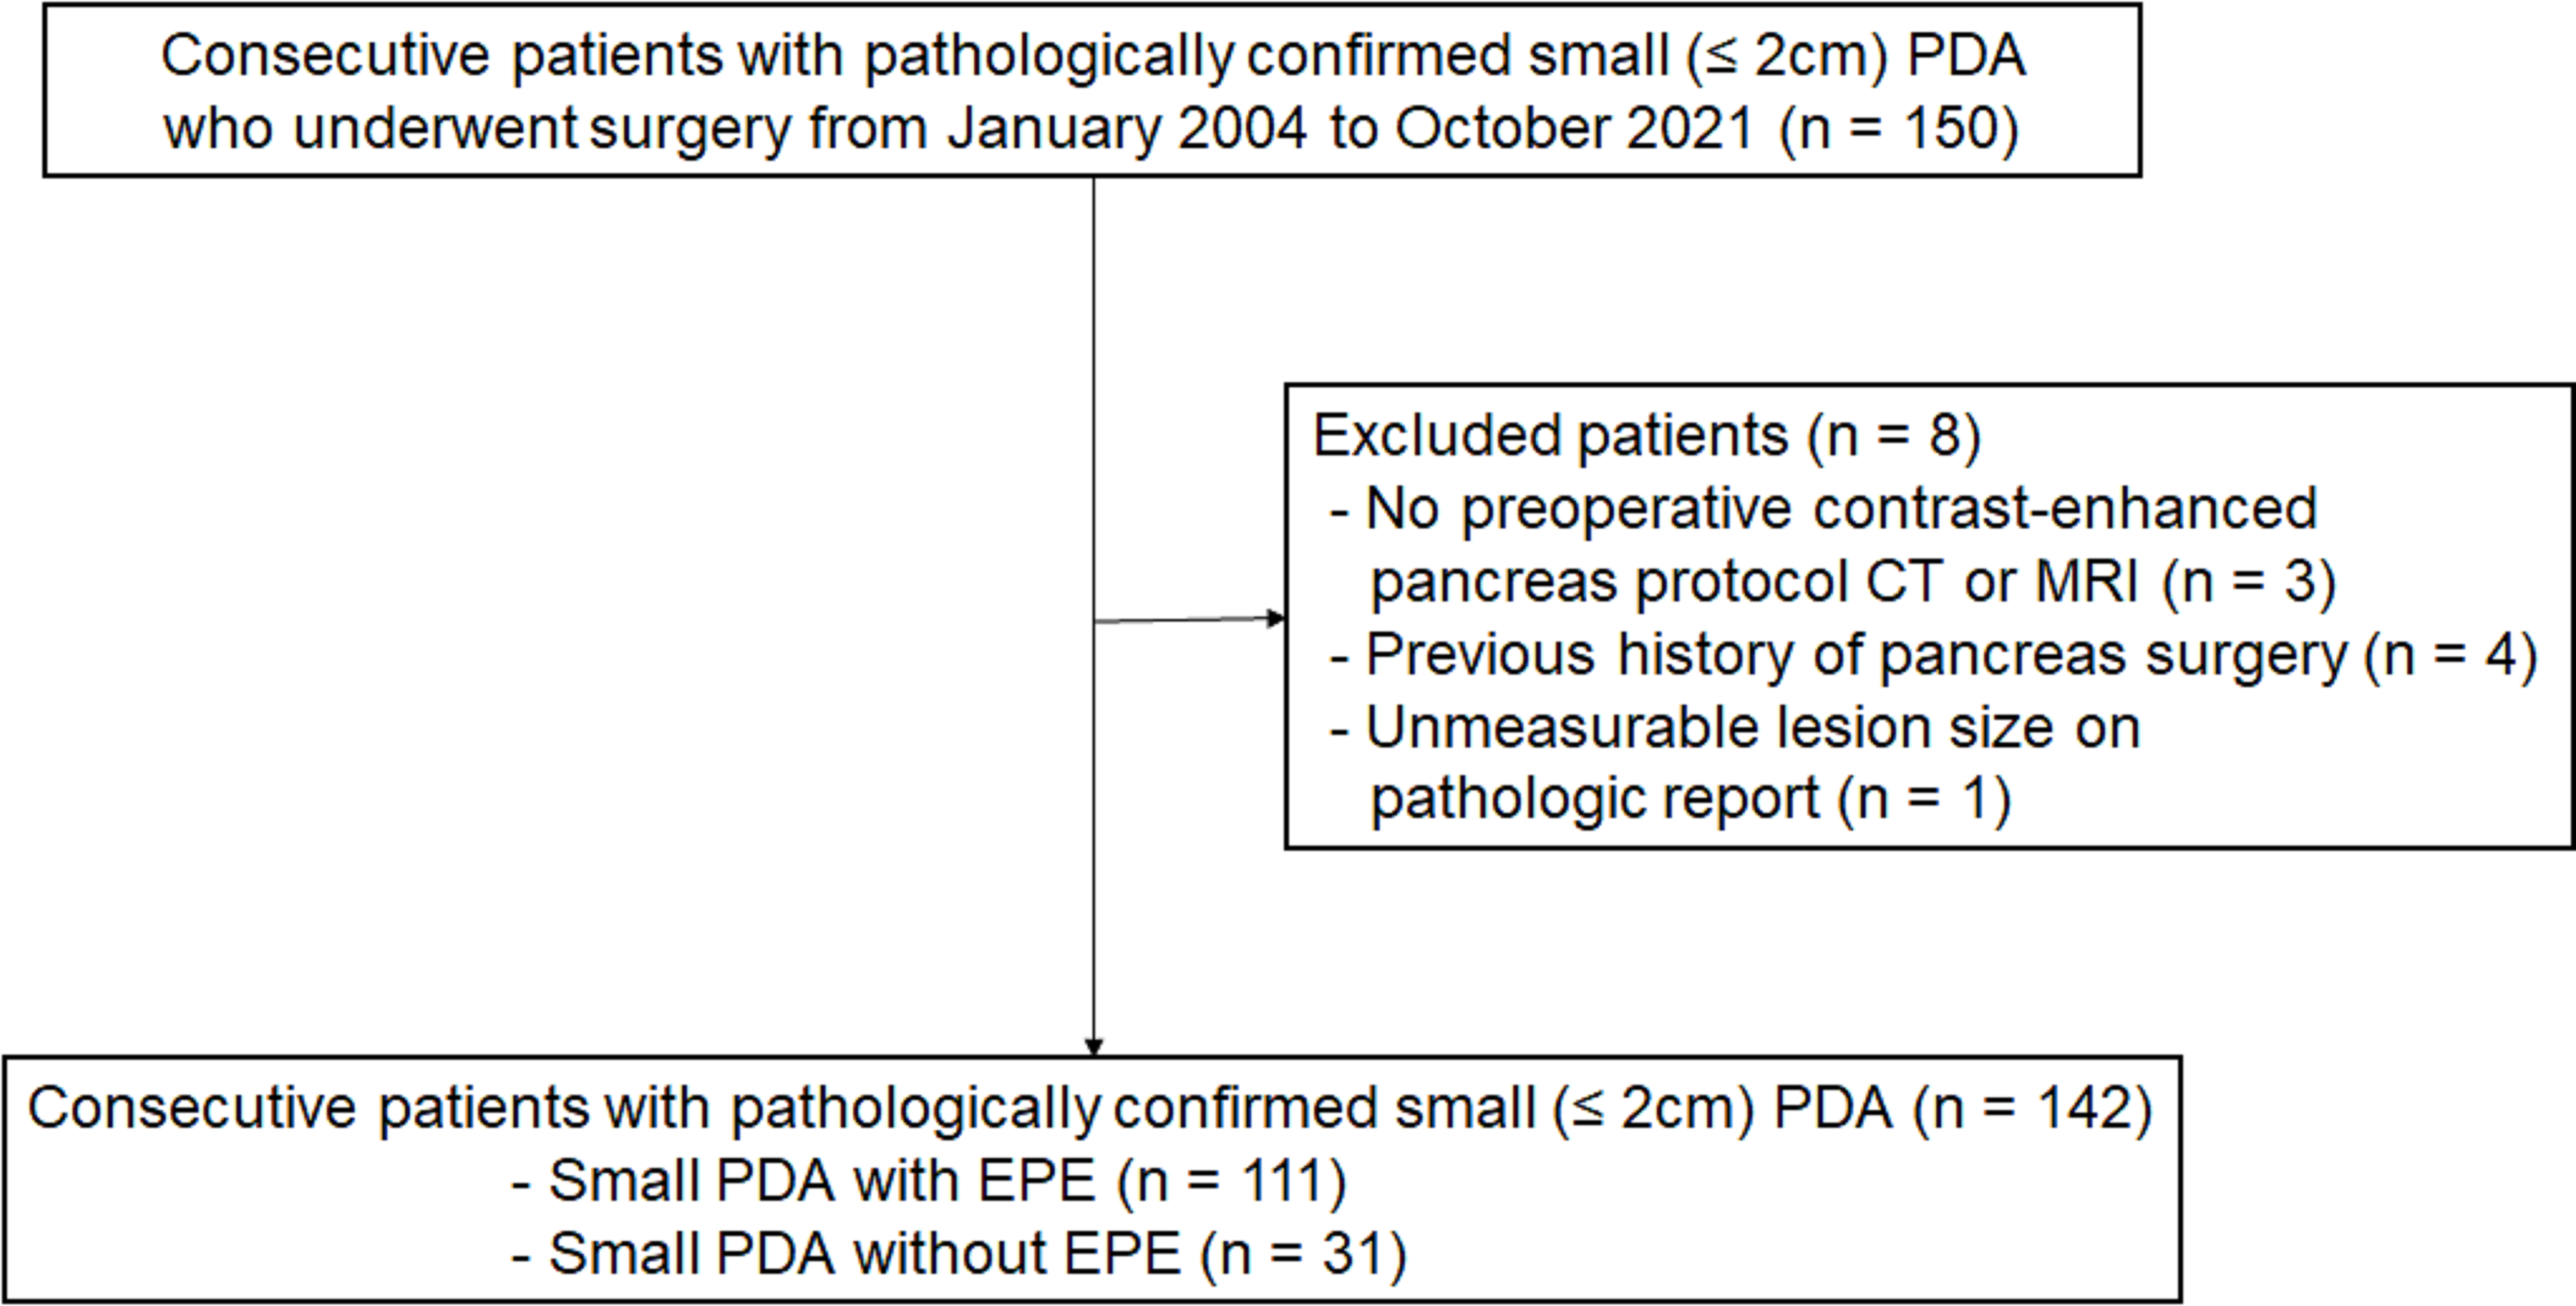
PatientsThe clinical data of 105 patients who underwent pancreaticoduodenectomy from June 2021 to May 2023 were retrospectively analyzed. Among them, there were 64 males and 41 females, aged between 35 and 77 years (mean age 62.670 ± 8.612 years). Inclusion criteria: patients who were preoperatively diagnosed with PAC, underwent pancreaticoduodenectomy, and postoperatively confirmed to be PAC. Exclusion criteria: patients with malignant transformation of pancreatic head cystic tumors, neuroendocrine carcinoma, and non-periampullary duodenal carcinoma. The cohort included 33 cases of PDAC, 25 cases of ampullary carcinoma, 38 cases of distal bile duct carcinoma, and 9 cases of periampullary duodenal carcinoma. According to postoperative pathological examination results, the patients were divided into an observation group (PDAC group, 33 cases) and a control group (non-PDAC PAC group, 72 cases). There were no statistically significant differences in gender, age between the two groups (p > 0.05). See Table 1 for details.
Table 1 Comparison of General Data, Laboratory, MRI Imaging, and pathological findings between the two groups of patientsMRI scanningUsing a 3T whole-body magnetic resonance imaging(MRI)system, equipped with a 30-channel (AA) / 60-channel (PA) AIR phased-array coil. Patients must fast for 4 h before the examination and undergo respiratory training. Perform single-shot fast spin-echo sequence (SSFSE T2WI): repetition time (TR) / echo time (TE) is 2000 to 6000 ms / 80 to 100 ms, slice thickness 4 mm, inter-slice gap 0.4 mm, matrix 320 × 288; LAVA-FLEX sequence: TR / TE = 4.6 ms / 2.7 ms, slice thickness 2 mm (50% interpolation), matrix 288 × 192, flip angle 15°. Respiratory-triggered T2 fat-saturated propeller sequence: effective TR / TE = 6000 to 15,000 ms / 85 ms, slice thickness 4 mm, inter-slice gap 0.4 mm, matrix 320 × 320, flip angle 110°. Magnetic Resonance Cholangiopancreatography (MRCP): effective TR / TE = 4000 to 6000 ms / 700 to 1000 ms, slice thickness 1.2 mm (50% interpolation), matrix 384 × 256; Contrast-enhanced LAVA sequence includes scans during the non-contrast phase, arterial phase (15 ∼ 35 s), portal venous phase (55 ∼ 60 s), equilibrium phase (90 s), and delayed phase (180 s). The contrast agent used is Dimeglumine Gadopentetate, with a dosage of 0.2 mL/kg body weight, administered via intravenous bolus injection.
Image analysisTwo radiologist with over six years of experience in evaluating liver and biliary tract MRI images independently reviewed the MRI data of 105 PAC patients without prior knowledge of the pathological types.
For each MRCP, they observed and recorded the findings: (1) Morphology of biliary and pancreatic duct dilation: Double duct sign (simultaneous dilation of the pancreatic duct and the bile duct, with a CBD diameter greater than 8 mm and a main pancreatic duct diameter greater than 3 mm considered as dilation), Triple segment sign (interruption of the pancreatic duct and bile duct at the lesion site, dilation and separation of the upper bile duct and pancreatic duct, and narrowing or absence of the lower bile duct or pancreatic duct), Quadruple segment sign (interruption of the pancreatic duct and bile duct at the lesion site, dilation and separation of the upper bile duct and pancreatic duct, and narrowing of both the lower bile duct and pancreatic duct); (2) Morphology of the bile duct terminal: Beak sign (gradual tapering or even obliteration of the CBD terminal), Rat tail sign (gradual tapering of the dilated CBD terminal, ending as a thin strip), Cutoff sign (distance from the start of narrowing to complete occlusion of the CBD is less than 1 cm); (3) Measurement of the pancreatobiliary junction angle (measuring the angle formed above the obstruction using a protractor) and the distance between the bile duct and pancreatic duct (distance between the terminal end of the CBD and the terminal end of the pancreatic duct) (see Fig. 1A).
Fig. 1
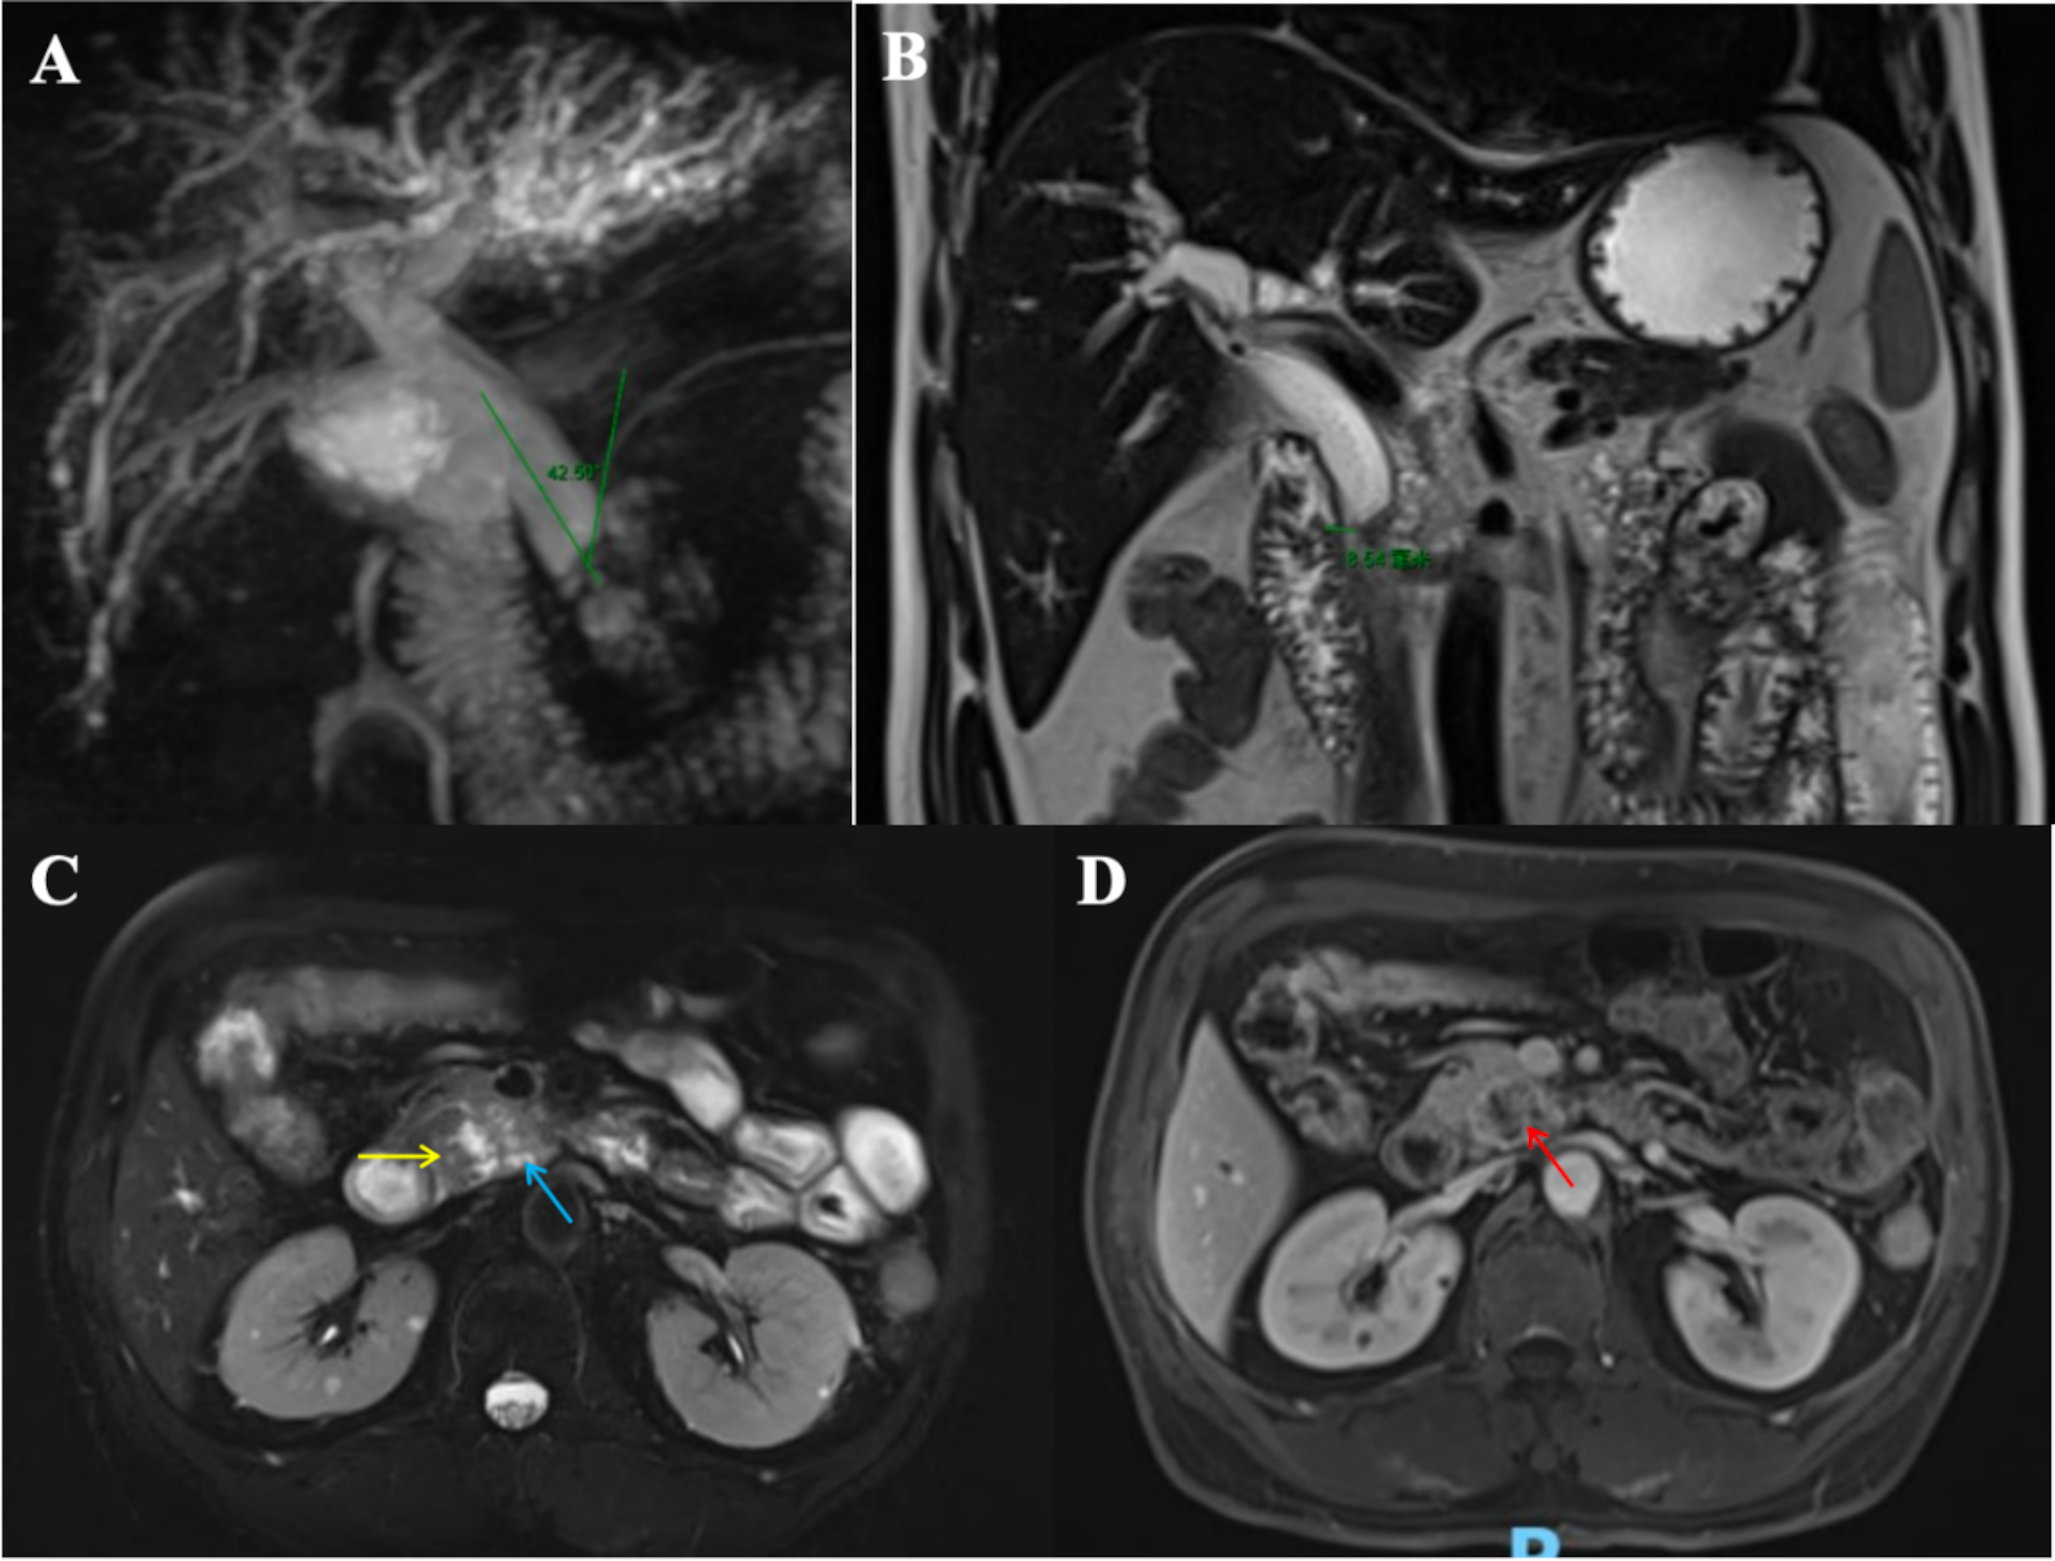
Male, 56 years old, with moderately differentiated ductal adenocarcinoma of the uncinate process of the pancreas. Figure A: MRCP shows dilatation of the CBD without dilatation of the main pancreatic duct. The distal CBD is cut off, with a measured pancreatobiliary junction angle of 42.50°. Figure B: T2 fat-saturated propeller sequence coronal view measuring the distance from the obstructed end of the CBD to the duodenum. Figure C: T2 fat-saturated propeller sequence sagittal view shows the dark ring sign (yellow arrow) in the lower part of the CBD and pancreatic head side branch duct dilation(blue arrow). Figure D: Contrast-enhanced LAVA sequence in post contrast portal venous phas shows a hypovascular mass in pancreatic head (red arrow)
Similarly, observations and records were made for each T2 fat-saturated propeller sequence in both coronal and sagittal scans: the distance from the obstructed bile duct terminal to the duodenum (distance from the duodenal lumen to the obstructed bile duct terminal) and the distance from the obstructed pancreatic duct terminal to the duodenum (distance from the duodenal lumen to the obstructed pancreatic duct terminal) (see Fig. 1B).diameters of the CBD and main pancreatic duct (measuring the widest part), the dark ring sign (ring-like low signal in the lower segment of the CBD, with or without surrounding high signal mass), and dilation of the side branches of the pancreatic duct in the pancreas head (dilated side branches of the pancreatic duct in the pancreas head, including those inside and around the tumor) (see Fig. 1C).
Additionally, the Contrast-enhanced LAVA sequence was observed and recorded: hypovascular mass in pancreatic head(lesion signal lower than normal pancreas, with delayed and inhomogeneous enhancement on contrast) (see Fig. 1D).
Discrepancies were discussed and decided upon. The required measurements were averaged between the two observers.
Statistical analysisStatistical analysis was performed using SPSS26.0 software to analyze the data. The Shapiro-Wilk test was used to verify whether continuous variables followed a normal distribution. Continuous variables that followed a normal distribution were analyzed using independent samples t-tests, while non-normally distributed measurement data were analyzed using the Mann-Whitney U test. Categorical data were expressed as frequencies and percentages, and comparisons between groups were performed using the χ² test or Fisher’s exact test. The receiver operating characteristic curve (ROC) was used to evaluate the diagnostic value of clinical laboratory indicators and MRI characteristics for distinguishing PDAC in patients with PAC, and the area under the curve (AUC) was calculated. Comparisons between ROC curves were analyzed using MedCalc v22.001 through the non-independent samples Hanley & McNeil test. A p-value of less than 0.05 was considered statistically significant.
Comments (0)