
Remember me

This retrospective, single-center study was initiated following approval from the local ethics committee (Approval number: 13/13072021). Before undergoing PCN procedures, all patients provided informed consent after being thoroughly informed about the procedure and its potential risks. Data were collected from electronic medical records and the Picture Archiving and Communication System (PACS), including patients’ clinical history, Eastern Cooperative Oncology Group (ECOG) performance status scores, body mass index values, demographic details, the number of PCN dislodgement events, and the median catheter dislodgement time (days). Between January 2016 and June 2021, a total of 332 patients who underwent PCN catheter replacement procedures at our clinic were evaluated. Among these, 92 patients (63 males, 29 females; mean age 63.9 ± 11.4 years, range 28–88) meeting the following criteria were included in the study. These patients underwent a total of 151 PCN catheter replacements.
Inclusion criteria 1.Patients without PCN Catheter Dislodgement (Group 1): This group included patients with long-term PCN catheters placed due to malignancy, whose catheters were replaced prophylactically at three-month intervals without any history of catheter dislodgement.
2.Patients with PCN Catheter Dislodgement (Group 2): This group also consisted of patients with long-term PCN catheters placed due to malignancy. Patients included were those with at least one documented episode of inadvertent and spontaneous catheter dislodgement in their medical history or those whose PCN catheters were replaced due to dislodgement.
Exclusion criteriaThe following patients were excluded from the study:
Those who underwent PCN replacement for benign causes, including benign prostatic hyperplasia, urinary tract stone disease, ureteral leak or fistula, and ureteral stricture.
Patients without a computed tomography (CT) scan within two months before or after the nephrostomy procedure.
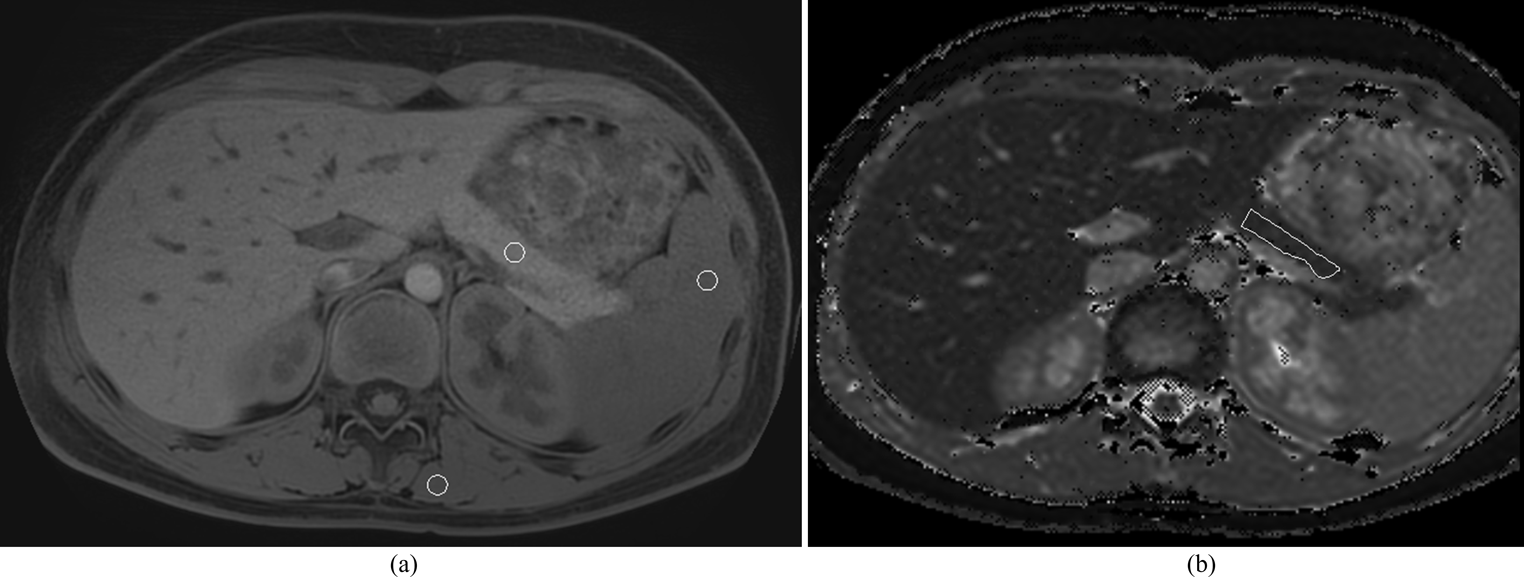
Patients having CT examinations with significant imaging artifacts (e.g., motion or beam hardening) causing density changes in soft tissues.
Cases in which the nephrostomy catheter dislodged due to accidental or traumatic causes.
Patients with the need for recurrent PCN eliminated by the insertion of a double J stent via anterograde approach.
Cases with renal rotation or axis anomalies.
Bedridden patients (Patients with an ECOG performance status score of 4).
Patients with scoliosis.
Cases with infections, abscesses, or hematomas along the nephrostomy tract.
PCN catheter replacement ProcedureAll PCN catheter placements included in the study were performed by two radiologists with 15 and 8 years of experience in interventional radiology. All patients underwent a complete blood count and coagulation studies on the day of the procedure. Acceptable pre-procedure criteria included platelets > 50,000/µL and INR < 1.5. Anticoagulant therapy was assessed, and according to SIR guidelines, coumadin and antiplatelet drugs such as plavix and aspirin were stopped five days before. Bridging therapy with low molecular weight heparin was provided for patients with recently placed stents, mechanical heart valves, or peripheral artery disease. Unfractionated heparin was discontinued 2–3 h before the procedure, and fractionated heparin, such as enoxaparin, was withheld for 24 h prior to the procedure [14, 15].
During the procedure, patients were placed in the prone position with two arms and hands gently resting next to the body superiorly. Aseptic technique was carried out and after skin preparation with % 10 povidone iodine, the patients were covered with sterile drapes. Local anesthetic (10–20 mL of lidocaine) was administered subcutaneously and along the planned puncture route, including the perirenal area and existing immatured tract, using a 21-gauge needle. Since PCN catheter insertion and replacement is classified as a clean-contaminated or contaminated procedure, antibiotic prophylaxis with 1 g of ceftriaxone or 1.5–3 g of ampicillin/sulbactam was administered prior to the intervention [2]. In patients whose PCN catheter had been dislodged within the last three days and tract maturation had not yet developed, a new PCN catheter was placed over a 0.035-inch hydrophilic coated guidewire (Terumo Glidewire®, Natick, MA, USA). Following the insertion of a 6 French(F) or 8 F dilator at the skin entry point and the administration of contrast material through the established tract under fluoroscopic guidance, a 0.035-inch hydrophilic guidewire was navigated into the collecting system. Once the guidewire’s position within the collecting system was confirmed, an 8 F pigtail tip catheter with pull-string tethered locking system (Flexima, Boston Scientific, Marlborough, MA, USA) was introduced over the guidewire (Fig. 1). For patients with a longer duration since dislodgement, or in cases where access to the renal collecting system could not be achieved using the described method, a new PCN catheter was placed using the standard technique with a fresh puncture. In this technique, the lower pole posterior calyx is accessed via a subcostal approach using an 18-gauge needle under ultrasound guidance. This is followed by the administration of contrast material to confirm access to the renal collecting system, introduction of a 0.035-inch hydrophilic guidewire to the ureteropelvic junction, sequential dilation of the tract with 6 F and 8 F dilators, and finally, the insertion of an 8 F PCN catheter into the renal pelvis (Fig. 2). To prevent inadvertent or spontaneous displacement, the pigtail-shaped tip of the PCN catheters were positioned securely within the renal pelvis and stabilized by fastening the nylon thread tied between the catheter’s opening and the final side hole of the pigtail. Skin fixation was performed using 1/0 natural nonabsorbable silk surgical sutures by the physicians who carried out the procedure, assisted by two nurses with 7 and 11 years of experience in interventional radiology (Fig. 3).
Fig. 1
Percutaneous Nephtrostomy Via an Immaturated Tract (a) With the patient in the prone position, an 8-French (8 F) dilator is inserted at the skin entry point, and the existing immature tract from the skin to the collecting system is opacified by administering contrast material under fluoroscopic guidance. (b) A 0.035-inch hydrophilic guidewire is advanced through the 8 F dilator towards the renal pelvis. (c) The guidewire is left in place while the dilator is removed. (d) Over the guidewire, the catheter is advanced along the tract through the subcutaneous and perirenal tissues. (e) The catheter is positioned within the renal collecting system. (f) Finally, the catheter’s tip is curled into a pigtail shape by pulling its string using the locking mechanism, completing the procedure
Fig. 2
Basic Technique of Percutaneous Nephrostomy Step by Step (a) With the patient in the prone position, an 18-Gauge percutaneous needle is inserted into the lower pole calyx of the kidney at a cranial angle via a direct posterior approach. After collecting a urine sample, entry into the collecting system is confirmed with contrast material, followed by antegrade pyelography. (b) A 0.035-inch hydrophilic guidewire is advanced through the needle towards the ureteropelvic junction. (c) The guidewire is left in place while the needle is removed, and the tract is sequentially dilated to 8 F using a rigid dilator. (d) Over the guidewire, the catheter is advanced along the dilated tract through the subcutaneous and perirenal tissues. (e) The catheter is then positioned within the renal collecting system. (f) Finally, the tip of the catheter is curled into a pigtail shape by pulling its string using the locking mechanism, completing the procedure
Fig. 3
Catheter Fixation in Two Steps (a, b): The process involves placing a suture on the skin on each side of the catheter and tying multiple knots over the catheter to form a braid. This is performed first on one side and then repeated on the other
Abdomen CT measurements and evaluationAll unenhanced abdomen CT examinations were performed with 16-detector row CT scanner (Brilliance; Philips Healthcare, Netherlands). CT images of all patients were evaluated using Osirix software (v12.5.2; Pixmeo SARL, Bernex, Switzerland) on medical imaging workstation by a 4 year radiology resident who completed abdomen imaging training process and a radiologist with 15 year experience on a consensus basis. The readers were blinded to all laboratory, clinical and pathological findings of patients.
The total area of intra-abdominal visceral adipose tissue, subcutaneous adipose tissue, and abdominal perimeter values were calculated by delineating boundaries at the L1 level using the region of interest (ROI) method. Similarly, the total bilateral psoas muscle area was measured at the L4 level using the same technique (Fig. 4). Intra-abdominal visceral and subcutaneous fat tissue measurements on CT were performed using values in the range of -250 to -50 Hounsfield Units (HU), which is considered the fat density range [16]. To normalize these measurements, the obtained values (intra-abdominal visceral adipose tissue area, subcutaneous adipose tissue area and sum of bilateral psoas muscle area respectively) were divided by the square of the patient’s height, and the intra-abdominal visceral adipose tissue index (IAVATI), subcutaneous adipose tissue index (SATI), and psoas muscle index (PMI) were subsequently calculated. Renal size was assessed on coronal images, while the renal cortex-to-skin distance and the total thickness of the posterolateral abdominal muscles (from superficial to deep: external oblique, internal oblique, and transversus abdominis muscles) traversed by the catheter were measured on axial images. Renal parenchymal thickness was evaluated at the lower pole of the kidney on axial images, as the PCN catheter is typically inserted through this region. (Fig. 5)
Fig. 4
Calculation of intra-abdominal visceral adipose tissue area (a), subcutaneous adipose tissue area (b), and abdominal perimeter (b) at L1 level and the total bilateral psoas muscle area (c) at the L4 level
There is no clear consensus in the literature regarding the optimal location for measuring the areas of intra-abdominal visceral and subcutaneous adipose tissue or the abdominal perimeter on CT. Recent studies assessing intra-abdominal visceral and subcutaneous adipose tissue areas have performed calculations at various levels between L1 and L4, including the first abdominal slice where the lungs are no longer visible and the umbilical level [17,18,19,20,21,22,23]. Other publications have measured the abdominal perimeter at levels ranging from T12 to L3, the midpoint between the inferior edge of the 12th rib and the superior margin of the iliac crest, and the first abdominal slice cranial to the iliac crest where the iliac bones are no longer visible [24,25,26,27]. Based on these studies, we performed our intra-abdominal visceral and subcutaneous adipose tissue area, and abdominal perimeter measurements at the L1 level.
Recent studies in the literature have highlighted that assessing the total psoas muscle area at all levels between T10 and L5, particularly at the L3/L4 levels, offers a reliable method for the radiological evaluation of sarcopenia [28,29,30,31]. In some of our patients, PCN catheters transgressed the abdominal wall muscles at the L3 level, potentially causing artifacts and affecting the accuracy of muscle tissue area and thickness measurements; therefore, based on guidance from studies in the literature, the total psoas muscle area and the thickness of the posterolateral abdominal wall muscles were measured at the L4 level.
ECOG performance status scores are routinely recorded in the medical system for oncology patients, and these scores were retrieved from the medical records. ECOG performance status is a widely used scale to assess a patient’s functional ability, with scores ranging from 0 to 4: 0 indicates fully active, 1 reflects restrictions in strenuous activity but ability to perform light work, 2 indicates limited ability for work but capacity for self-care, 3 reflects significant limitations with self-care and confinement to a chair or bed for more than 50% of waking hours, and 4 represents complete disability and total confinement to bed [32]. However, as bedridden patients were excluded from the study, the analysis included only scores ranging from 0 to 3.
The relationship between inadvertent or spontaneous PCN catheter dislodgement and all aforementioned parameters (IAVATI, SATI, abdominal perimeter, PMI, renal size, renal parenchymal thickness, renal cortex-to-skin distance, and total thickness of posterolateral abdominal wall muscles), as well as the number of spontaneous PCN dislodgements and ECOG scores, were analyzed in detail for the two patient groups.
Statistical analysisStatistical analyses were conducted using SPSS version 28.0 (IBM SPSS Statistics for Windows, IBM Corp., Armonk, NY, USA). For parameters related to the relevant side of nephrostomy, such as renal size, renal parenchymal thickness, skin-to-cortex distance, total thickness of posterolateral abdominal wall muscles, and the number of PCN catheter replacements, each nephrostomy replacement procedure was treated as a separate event. Multiple replacements in the same patient (due to scheduled or prophylactic replacements or spontaneous dislodgements) were analyzed independently based on the side involved. In contrast, body fat-muscle composition parameters, including ECOG performance status scores, IAVATI, SATI, and abdominal perimeter, were analyzed on a per-patient basis, with patients categorized as having experienced at least one spontaneous catheter dislodgement or none, irrespective of the side or number of dislodgements.
The normality of the data distribution was assessed using skewness and kurtosis metrics, Kolmogorov–Smirnov, and Shapiro–Wilk tests. Descriptive statistics were expressed as mean, standard deviation, minimum, maximum, and ratio values. The Mann–Whitney U test was used to analyze quantitative independent variables with non-normal distributions, while independent t-tests were applied for normally distributed data. The chi-square test was used to analyze qualitative independent data; however, Fisher’s exact test was applied in cases where the absolute value was less than 5.
Receiver Operating Characteristic (ROC) analysis was performed to determine the optimal cutoff values for the examined variables, utilizing Youden’s Index to optimize sensitivity and specificity. Univariate and multivariate logistic regression analyses were conducted to evaluate the effect sizes of significant factors. A p-value of less than 0.05 was considered statistically significant.
Comments (0)