
Remember me

This retrospective study was approved by the Institutional Review Board (IRB No. 2311-038-1483), which waived the requirements for informed consent.
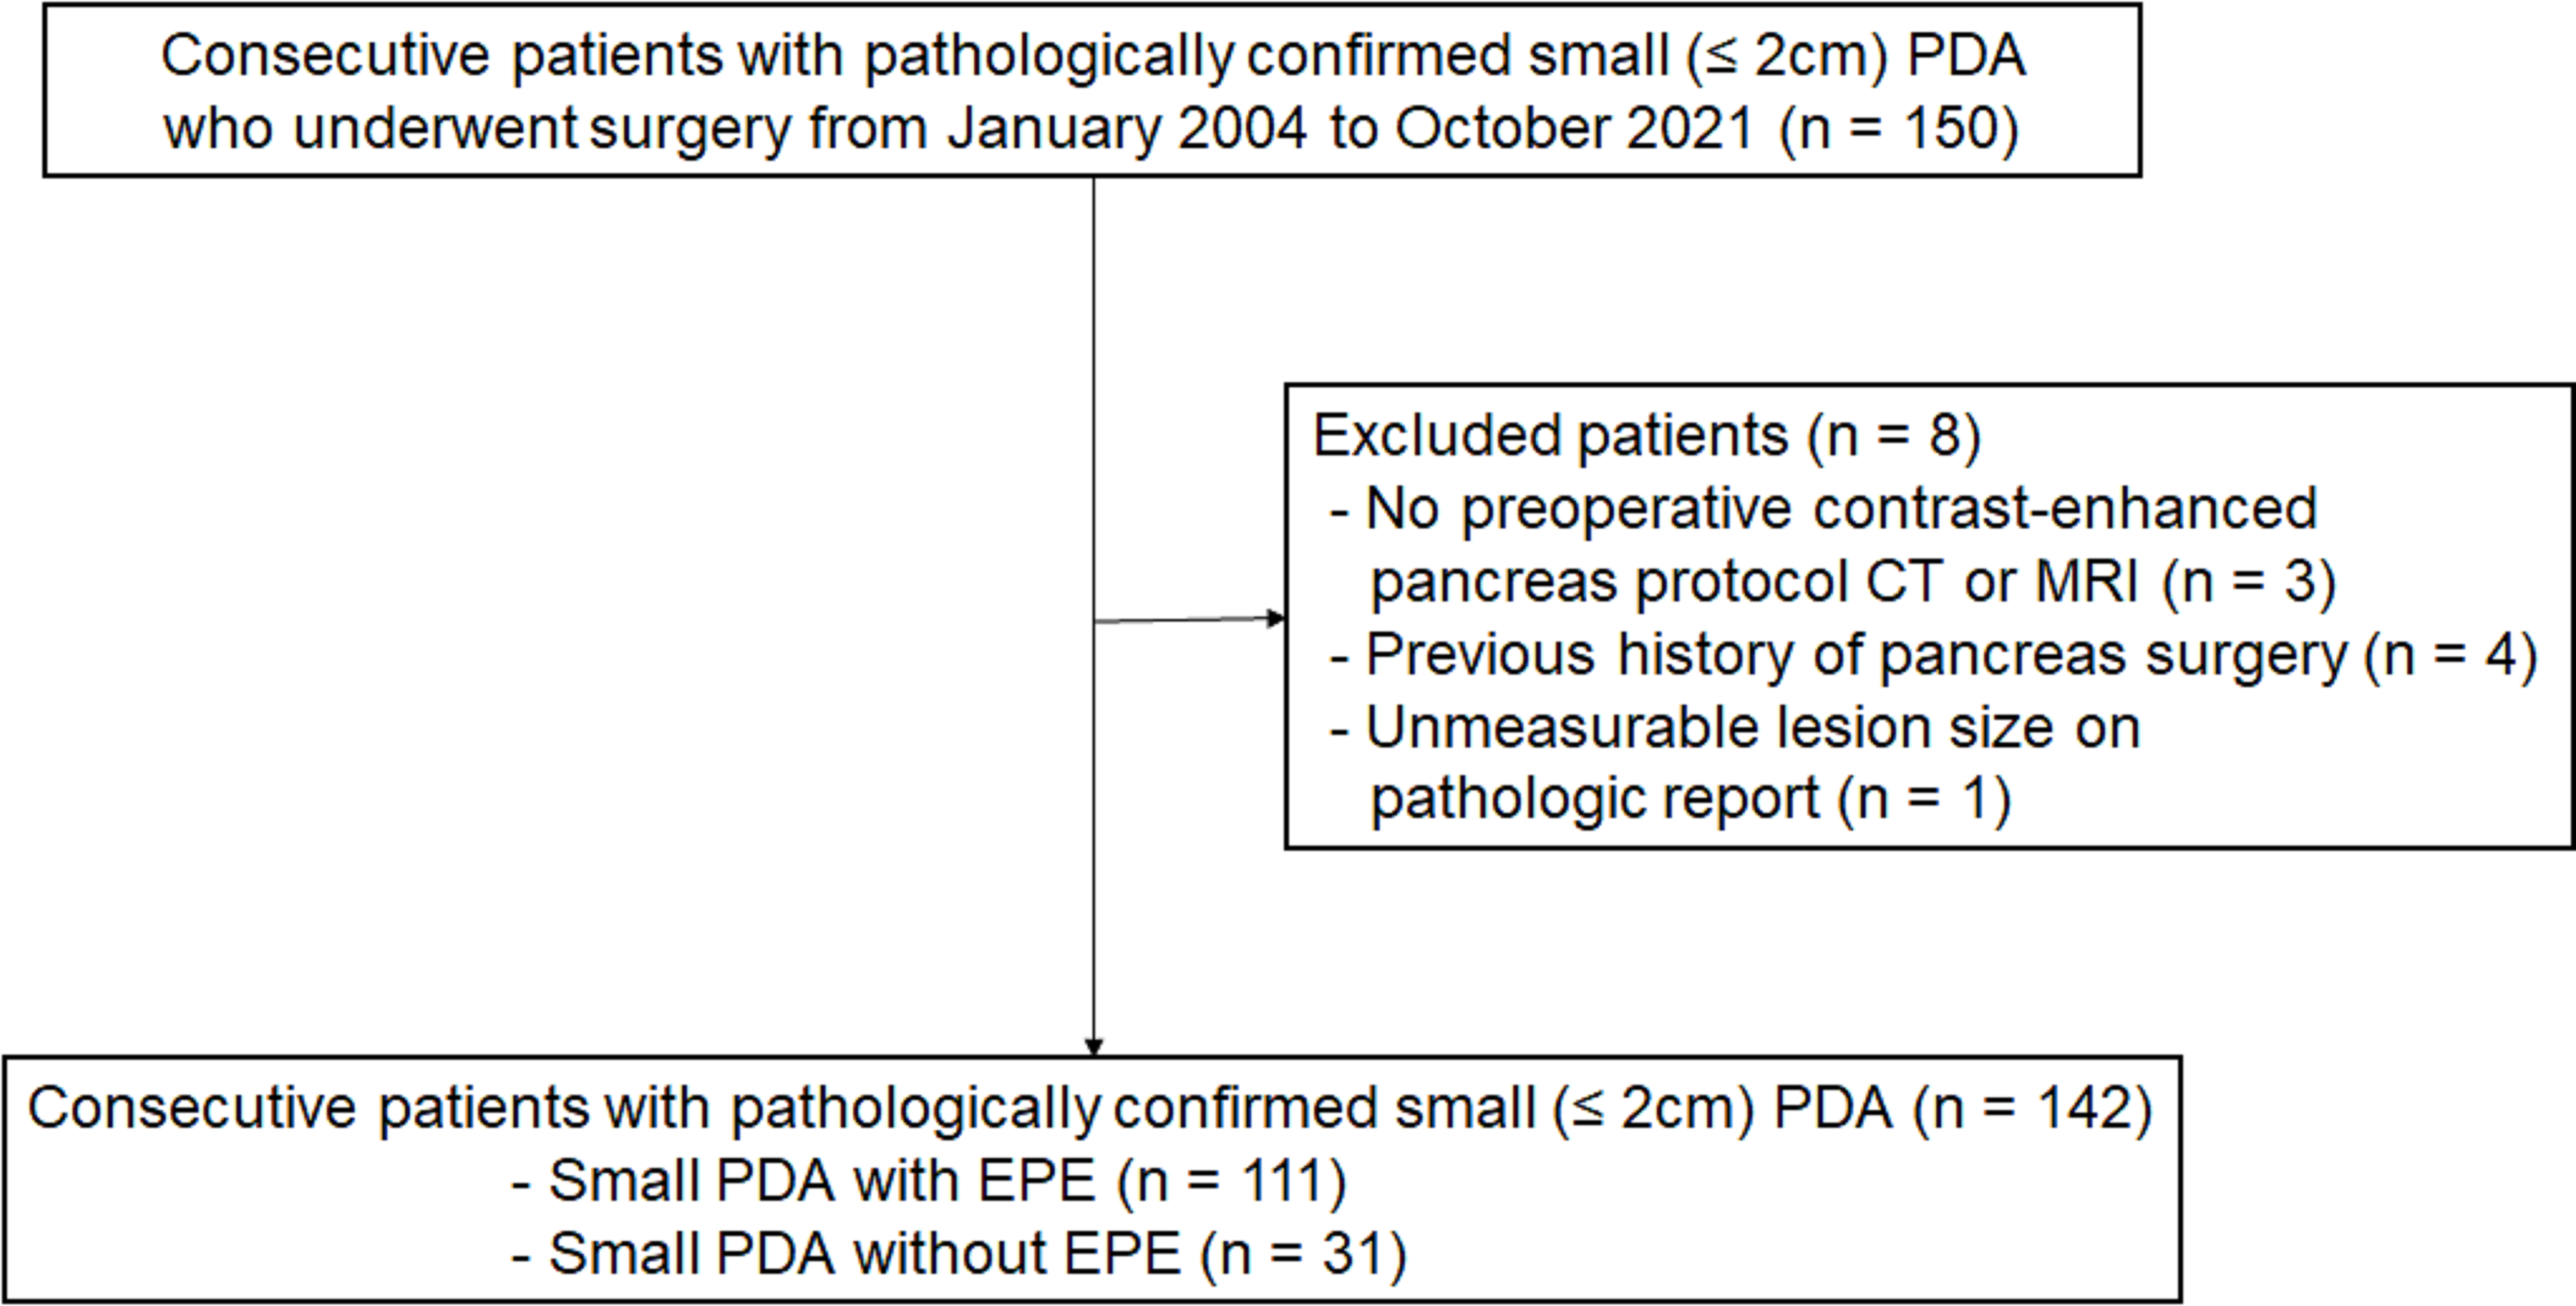
PatientsAfter reviewing the institution’s databases from January 2004 to October 2021, 150 patients diagnosed with s-PDA measuring 2 cm or less following surgical resection were identified, and their initial CT or MR images were obtained. Among these, three cases were excluded because they were not evaluated using a contrast-enhanced pancreas protocol CT or MRI. Four cases who underwent pancreaticoduodenectomy or hepatojejunostomy for other malignancies prior to s-PDA surgery were excluded. And one case that the tumor size was reported “unmeasurable” in the pathology report was also excluded.
Ultimately, a total of 142 patients (77 male and 65 female; mean age, 64.7 ± 9.3 years) were included in this study (Fig. 1). All patients had a tumor size of 2 cm or less, corresponding to the AJCC 8th Edition pathological T1 stage. The surgeries performed were pancreaticoduodenectomy (n = 78, 54.9%), distal pancreatectomy (n = 62, 43.7%), and total pancreatectomy (n = 2, 1.4%).
Fig. 1
Flow diagram of the included patients
CT examinationOf 142 patients, 134 underwent preoperative CT using commercially available scanners (Supplementary Table 1). Of these, 115 underwent dual-phase MDCT (pre-contrast, pancreatic, and venous phases), and 19 underwent triple-phase multi-detector CT (MDCT) (pre-contrast, pancreatic, venous, and delayed phases). Each patient received 120 mL of non-ionic contrast material at a rate of 2–5 mL/s using an automatic injector. Early arterial phase imaging was delayed by 6 s after reaching 100 Hounsfield unit in the descending aorta, with early and late arterial images acquired during separate breath-holds (5–9 s between scans). Portal venous phase images were obtained 70 s after triggering. CT parameters were as follows: detector configurations, 0.6–0.75 mm; matrix size, 512 × 512; tube voltage, 90–120 kVp; tube current, 120–200 mAs; and rotation time, 0.50–0.75 s. Axial images were reconstructed using slice thickness of 2.5–3 mm, and coronal reconstructions were obtained at a slice thickness of 3 mm using 3D imaging software.
MRI examinationOf 142 patients, 115 underwent preoperative MRI on 1.5T or 3.0T machines (Supplementary Table 1). The sequences included breath-hold axial T2-weighted imaging (single-shot fast spin echo or half-Fourier acquisition single-shot turbo spin echo), T1-weighted in- and opposed-phase spoiled 3D gradient-echo, DWI using a single-shot echo-planar imaging pulse sequence with b values of 0, 400, and 800 s/mm2 (respiratory triggering), and breath-hold T1-weighted fat-suppressed gradient echo. Dynamic imaging used a fat-suppressed 3D gradient echo sequence before and after administering 7.5 mL of Gadovist (1.0 M gadobutrol; Bayer Healthcare, Berlin, Germany) at a 0.1 mmol/kg body weight and a rate of 2 mL/s, followed by a 20–30 mL saline flush. Dynamic phase acquisition timing was monitored using real-time MRI fluoroscopy with placement of the region of interest in the descending aorta. Arterial phase images were obtained 8 s after contrast arrival, and portal venous phase images were obtained at 60 s. Additional delayed phase images were acquired at 2, 3, and 5 min post-injection. The 3D gradient echo data for each phase were collected in a single breath-hold at expiration (mean time, 18 s [range, 16–22 s]).
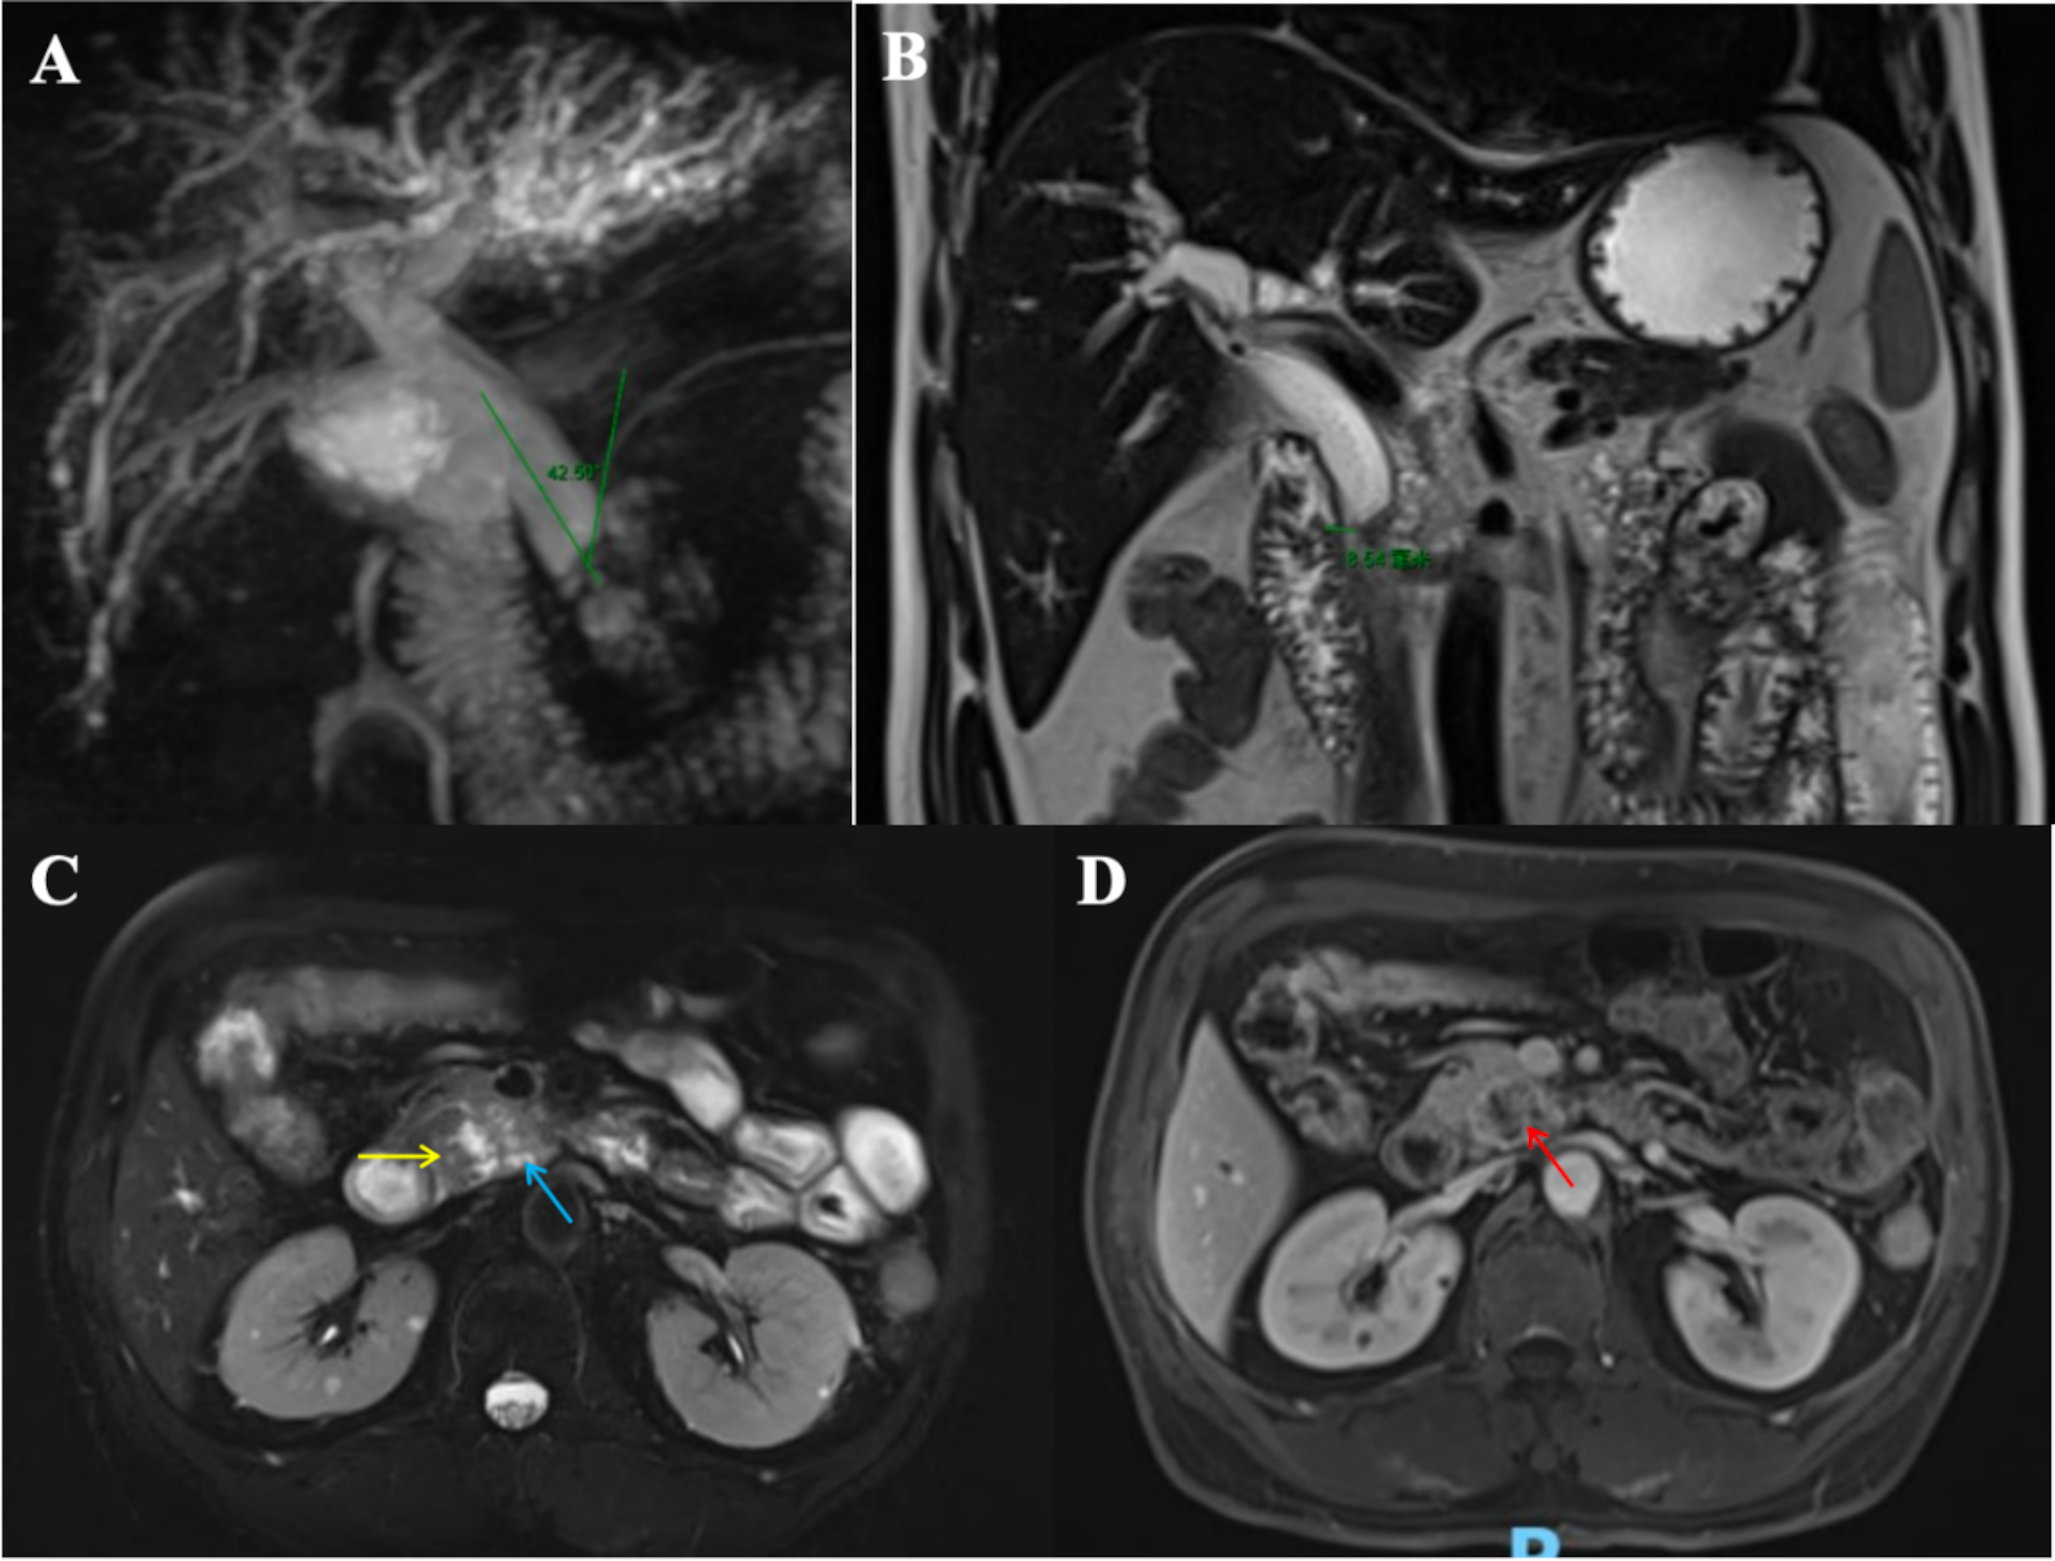
Imaging analysisTwo abdominal radiologists, J.H.P. and S.J.H., each with 5 years of experience, independently reviewed anonymized and randomly distributed images. They were blinded to clinical information and radiologic reports except for tumor location. They evaluated preoperative CT and MR images for tumor size, diameter of the main pancreatic duct (MPD) and CBD, relationship between the tumor and major vessels: celiac axis, common hepatic artery (CHA), superior mesenteric artery (SMA), main portal vein (MPV), and superior mesenteric vein (SMV); presence of extrapancreatic neural invasion (EPNI), metastatic lymph nodes (LNs), and resectability. Tumor size was measured in the most clearly visible phase of dynamic imaging; measurements were omitted if evaluation was not possible due to iso-attenuation or intensity. The largest MPD and CBD diameters were measured regardless of phase and plane. Duct dilatation was defined as greater than 3 mm for the upstream MPD [13] and 7 mm or more for the CBD [14]. Tumor-vessel relationships were categorized as no involvement, abutment, or encasement. The tumor-vessel relationships were classified as follows: no involvement when the tumor does not contact the vessel, abutment when the tumor is in direct contact with the vessel but the contact is less than 180° of the vessel’s diameter, and encasement when the tumor contacts more than 180° of the vessel’s diameter or causes a change in caliber, contour irregularity, or occlusion [15]. EPNI was assessed based on five major pathways: from the celiac ganglia to the posterior surface of the pancreatic head (plexus pancreaticus capitalis 1); from the bilateral celiac ganglion to the left margin of the uncinate process via the plexus and around the SMA (plexus pancreaticus capitalis 2); from the plexus around the CHA to the pancreatic head’s anterior region coursing along the gastroduodenal artery; from the left celiac ganglia to the pancreatic body and tail via the splenic artery plexus; and from the left celiac ganglia and plexus to the posterior region of the pancreatic body [16,17,18]. EPNI was scored on a 3-point scale, as follows: 1, normal pancreatic fat tissue; 2, streaky or strand-like infiltrations in fat tissue observed along known EPNI pathways, regardless of their continuity to the tumor; 3, irregular masses adjacent to tumor along known EPNI pathways, with or without direct continuity to the tumor. Scores of 2 and 3 indicated EPNI. Metastatic LNs were defined as necrotic or exceeding 10 mm in short-axis diameter. Resectability was assessed based on the most widely used and relatively recently revised NCCN guidelines (Supplementary Table 2), taking into account the tumor’s location. Discrepancies were resolved by a third reviewer (J.H.K., with 24 years of experience in abdominal imaging).
Pathology reference standardAll resected specimens were stained with hematoxylin and eosin staining. The entire portion of the resected specimen examined under a light microscope by two board-certified pathologists in our institution. The gross and microscopic descriptions of the specimens provided in the pathological reports were reviewed retrospectively. The pathological reports included data regarding the diagnosis, differentiation, location of tumor, size of tumor, depth of invasion (including presence of EPE), presence of venous invasion (including large vessels), presence of perineural invasion, tumor (T) and nodal (N) status according to AJCC 8th Edition staging system, and resection status according to the International Union Against Cancer. Resection status was assessed as no residual tumor (R0), microscopic residual tumor (R1), or macroscopic residual tumor (R2).
Recurrence assessmentAll patients underwent postoperative follow-up with CT or MRI every 3–6 months, either alone or alternately. Surveillance intervals were modified based on patient’s risk factors and other considerations. Recurrence was defined as a new enhancing soft tissue lesion in the remnant pancreas or resection margin, or the presence of metastatic lesions on contrast-enhanced CT, MRI, or PET-CT. Recurrence-free survival (RFS) was defined as the interval from surgery to recurrence or, if there was no recurrence, to the last follow-up image.
Statistical analysisClinicopathological and imaging findings were compared between s-PDA with and without EPE using the independent t-test and Mann-Whitney U test for continuous data, and Pearson’s chi-squared and Fischer’s exact tests for categorical data. Variables with p <.05 were included in stepwise multivariable analysis. Univariate and multivariate Cox regression analyses were used to identify significant predictors of recurrence. We calculated the optimism-adjusted area under the ROC curve (AUC) of significant predictors. Inter-observer agreement for imaging findings was calculated using the intraclass correlation coefficient (ICC) for continuous variables and κ statistics for categorical variables, interpreted as follows: poor (< 0.20); fair (0.21–0.40); moderate (0.41– 0.60); substantial (0.61–0.80); and near-perfect (0.81–1.00) [19, 20]. Statistical analyses were performed using SPSS software (version 22; SPSS Inc.) and R statistical software (version 4.2.0; R Foundation for Statistical Computing).
Comments (0)