
Remember me

Under institutional review board approval, data were retrospectively collected at Cincinnati Children’s Hospital Medical Center a quaternary pediatric hospital. All study activities were HIPAA compliant. Consecutive patients who underwent a clinically indicated MRCP between January 2020 and August 2023 were identified using an imaging report search engine (Illuminate InSight v4.3, Softek Illuminate). From this sample, we included pediatric patients less than 18 years of age and only patients imaged on Philips MRI scanners (Philips Healthcare, Best, The Netherlands). The scanner manufacturer limitation was applied to avoid potential confounding based on technical differences in implementation of T1 mapping between MRI manufacturers.
Given the known dependence of T1 relaxation times on magnetic field strength, identified patients were sub-divided based on the field strength of scanners used (i.e., 1.5T, 3T). We excluded examinations without a visible and measurable pancreas and included no more than 12 patients per year of age for 1.5T scans, and no more than 6 patients per year of age for 3T scans, selecting the most recently performed scans in each age group. We applied this limitation to the number of patients included in each age group because of the potential that T1 relaxation time and, correspondingly, T1 SIR could change based on patient age. The selected group of patients have previously been reported, in a paper reporting T1 relaxation time estimates but not T1 SIR [7]. This work builds upon that previous work by exploring the potentially more available T1 SIR in children and exploring associations between T1 SIR and T1 relaxation time.
MRI examinationsMRI examinations included in our study were obtained on one of the following MRI scanners: Philips Ingenia 1.5T, Philips Ingenia 3T, and Philips Ambition 1.5T (Philips Healthcare, Best, The Netherlands). These examinations included both T1 mapping and 3D T1 modified DIXON sequences which were compared for this study.
As detailed in our prior publication, T1 mapping was accomplished using an Electrocardiogram (ECG)-triggered two-dimensional Modified Look-Locker Inversion Recovery (MOLLI) sequence implemented as a (5 s(3 s)3 s) scheme using a balanced steady state free precession (bSSFP) gradient echo acquisition [7]. Parametric maps of T1 relaxation time, estimated based on a single compartment model, with 95% confidence maps overlaid, were generated immediately on the scanner console using the vendor’s product software (PACS) (Merge PACS, version 7.2.0.157991, Merge Healthcare).
T1 SIR metrics were generated from signal intensity measurements made on T1W MR images acquired using either a navigator gated 3-dimensional (3D) pseudo-golden-angle radial stack-of-stars chemical shift encoded (also known as mDIXON) radiofrequency (RF) spoiled gradient echo acquisition (3D VANE) [13,14,15,16]; or a single breath-hold 3D T1 mDIXON RF spoiled gradient echo acquisition. Both 3D acquisitions were acquired in the axial plane and positioned to cover the liver dome to the iliac crest. For both sequences, the water only image was used for the signal intensity measurements from which the T1 SIRs were calculated. Representative acquisition parameters for the 3D VANE sequence included: repetition time (TR) = 7.3 ms, echo time (TE) (N = 2) = 2.0 ;4.4ms, flip angle = 12 degrees; field of view (FOV), 320 × 320mm2; matrix, 320 × 320, turbo field echo (TFE) factor = 38, Radial % = 200, (SENSitivity Encoding) SENSE acceleration factor (in plane phase encode/slice phase encode) = 1 / 2.2, Half Fourier (slice) = 0.8, slice thickness = 4 mm; acquisition time ≥ 3:46 (navigator gated used for respiratory compensation). Representative acquisition parameters for the breath-hold T1 mDIXON RF spoiled gradient echo sequence: TR = 5.3 ms, TE (N = 2) = 1.74;3.6 ms, flip angle = 15 degrees; FOV, 320 × 320mm2; matrix, 212 × 212, SENSE acceleration factor (in plane phase encode/slice phase encode) = 2/ 1.8, slice thickness, 4 mm, Half Fourier (In plane Phase encode/Slice) = 0.675/0.75; acquisition time: ~16–17 s.
Image analysisMeasurement of estimated T1 relaxation times has already been described for this study sample [7]. Briefly, a research fellow used a vendor-neutral post-processing platform (IntelliSpace, Philips Healthcare) to draw freehand regions of interest (ROI) on the T1 parametric map for each of the four slices, encompassing as much of the pancreas as possible on each slice. Mean T1 relaxation time was recorded for each ROI with an overall mean T1 relaxation time calculated as an area weighted mean of all ROI values.
In addition, for the current study, at an interval of 90 days after the initial estimated T1 value measurements were made, the same research fellow measured signal intensities of the pancreas, spleen and paraspinal muscle on the single slice where the largest amount of pancreas was visible. Single, size-matched, ovoid ROIs were drawn in the pancreas, spleen and paraspinal muscle on either the navigator gated mDIXON 3D VANE images, or if not available, on the 3D T1 mDIXON RF spoiled gradient echo images (Figs. 1 and 2). Pancreas and spleen ROIs were drawn as close as possible to a similar anteroposterior level within the patient. Paraspinal muscle ROIs were drawn on the left in all cases.
Fig. 1
Axial 1.5T (A) T1-weighted 3D VANE and (B) T1 parametric map images in a 14-year-old boy with no pancreatic disease. Circular regions of interest (ROIs) in the pancreas, spleen, and paraspinal muscle on T1-weighted 3D VANE images were used to calculate T1-weighted signal intensity ratios (T1 SIR). An irregular ROI drawn on the pancreas on the corresponding slice on the T1 parametric map was used to measure estimated T1 relaxation time. ROIs are indicated using a white outline. Pancreas:spleen T1 SIR was 1.48 and Pancreas:paraspinal muscle T1 SIR was 1.70 with corresponding T1 relaxation time of 658 msec
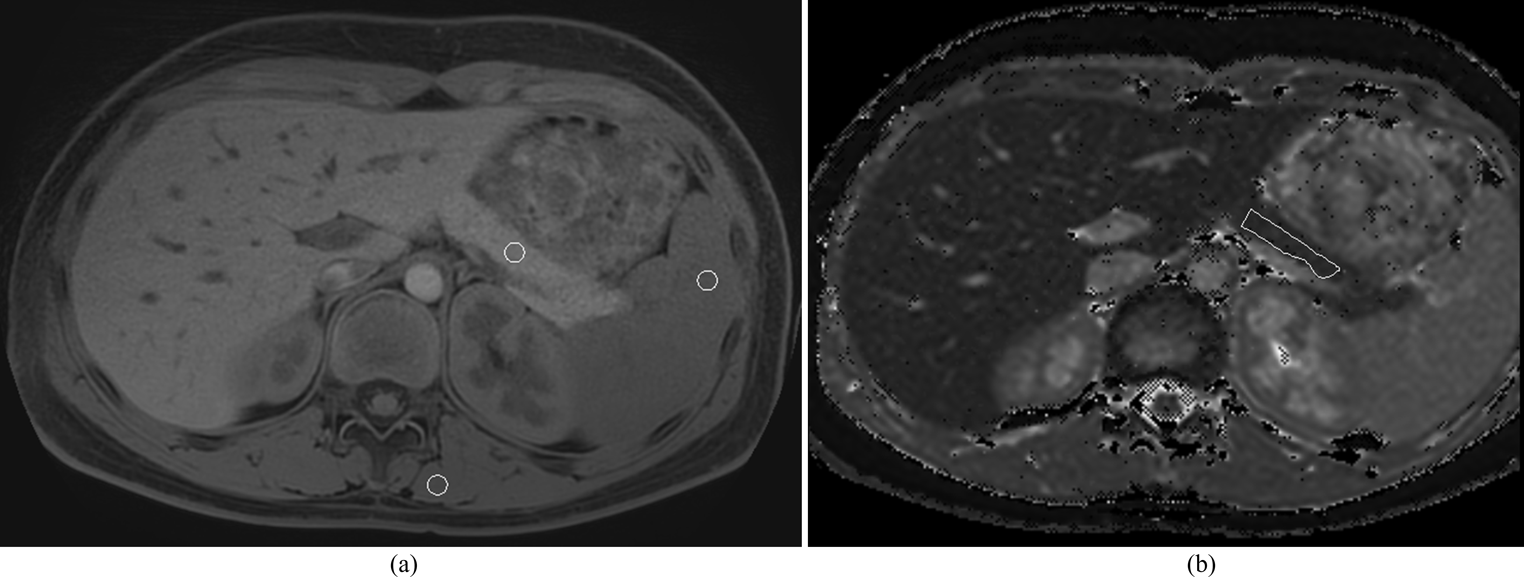
Fig. 2
Axial 1.5T (A) T1-weighted 3D VANE and (B) T1 parametric map images in a 7-year-old boy with chronic pancreatitis. Circular regions of interest (ROIs) in the pancreas, spleen, and paraspinal muscle on T1-weighted 3D VANE images were used to calculate T1 weighted signal intensity ratios (T1 SIR). An irregular ROI drawn on the pancreas on the corresponding slice on the T1 parametric map was used to measure estimated T1 relaxation time. ROIs are indicated using a white outline. Pancreas:spleen T1 SIR was 1.02 and Pancreas:paraspinal muscle T1 SIR was 0.93 with corresponding estimated T1 relaxation time of 1053 msec
All ROIs for measurement of T1 relaxation time (T1 maps) and T1 signal intensities were drawn by a single research fellow, experienced in analysis of pancreatic imaging. ROIs were reviewed and corrected as needed by a board-certified pediatric radiologist with more than 11 years of post-fellowship experience. T1 relaxation time estimates were reported as an ROI area weighted mean. Pancreas-to-spleen T1 SIR (SIR-PS) and pancreas-to-muscle T1 SIR (SIR-PM) were calculated using the following formula [10]:
Reference = spleen or paraspinal muscle.
Medical record reviewFor all included patients, electronic health records (Epic; Verona, WI) were reviewed to record demographics, anthropometric data, and any relevant health conditions (involving the liver, spleen, pancreas). The radiology reports were also reviewed to identify the indications and imaging findings relevant to the pancreas (including presence of acute and chronic pancreatitis).
Patient groupingPatient subgroups were defined based on review of imaging reports, electronic medical records, and laboratory values. Additionally, relevant laboratory values were recorded which included amylase and lipase within 24 h of imaging date. Acute pancreatitis was defined by meeting at least two of three INSPPIRE diagnostic criteria (imaging findings, lipase ≥ 3x the upper limit, or abdominal pain) [3]. Chronic pancreatitis was defined also based on the INSPPIRE criteria which included imaging findings (ductal and/or parenchymal changes) plus one of the following: abdominal pain in the pancreatic region, exocrine insufficiency, or endocrine insufficiency [3]. The acute on chronic pancreatitis group met INSPPIRE criteria for both acute and chronic pancreatitis at the time of imaging. The control group was a group with no pancreas pathology, and no pancreatitis documented in their chart or evident on any prior imaging.
Statistical analysisMeans and standardized deviations or medians and interquartile ranges (IQR) were used to summarize parametric and non-parametric continuous data respectively. Counts and percentages were used to summarize categorical data.
Because study data were non-normally distributed, non-parametric tests were used for statistical analysis. Spearman’s rank correlation coefficients were calculated between T1 SIR, and estimated T1 relaxation time measured on the same image and between T1 SIR and overall mean estimated T1 weighted relaxation time. The strength of correlation was classified as follows: 0-0.19, very weak; 0.2–0.39, weak; 0.40–0.59, moderate; 0.60–0.79, strong; and 0.80-1.0, very strong [17].
The Mann-Whitney U test was used to compare SIR between male and female patients while Spearman’s rank correlation coefficient correlation was used to correlate age with SIR values. The Kruskal–Wallis test was used to compare T1 SIR between subgroups with Dunn’s test used for pairwise comparisons.
Receiver operating characteristic (ROC) curve analysis was used to assess the use of T1 SIR to identify the presence of any pancreatitis (acute, chronic, or acute on chronic) compared to no pancreatic disease. Youden’s index was used to identify the threshold value that maximized sensitivity and specificity. A p value < 0.05 was considered statistically significant. Statistical analyses were performed using MedCalc Statistical Software version 22.009 (MedCalc Software Ltd., Ostend, Belgium).
Comments (0)