Cell culture and treatment
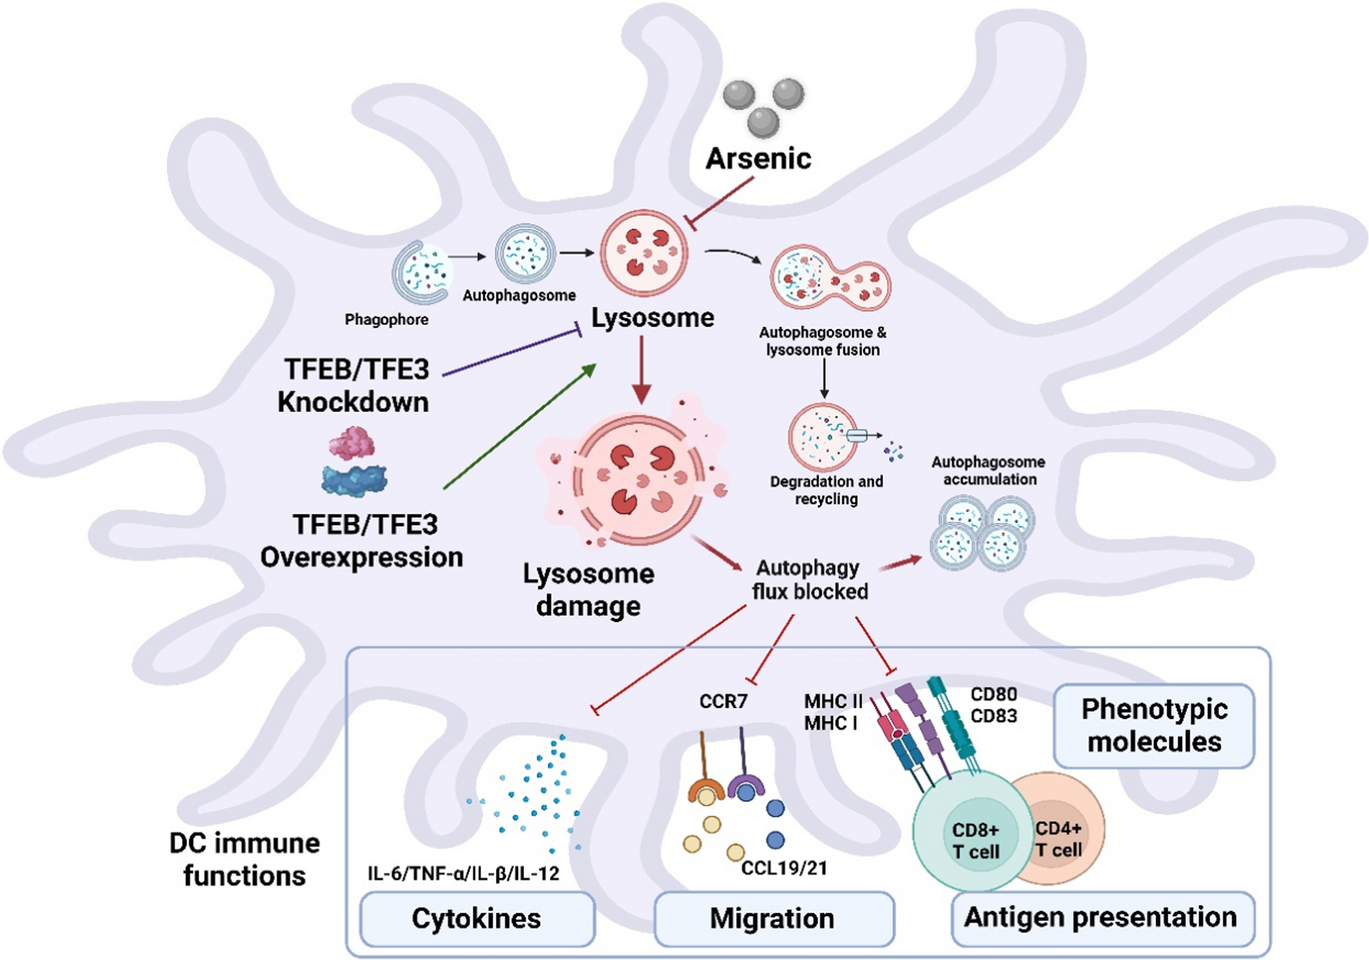
Primary cultures of BMDCs were prepared from the bone marrow of C57BL/6 mice with the approval by the Institutional Animal Care and Use Committees of China Medical University. Briefly, the bone marrow was separated and collected from the femurs and tibias of C57BL/6 mice under sterile conditions. After removal of red blood cells, the bone marrow cells were washed with PBS (Thermo Fisher Scientific, hereafter as Thermo, 20,012,027) and filtered through a 70-μm cell strainer. The bone marrow cells were then plated in a 6-well plate and cultured in fresh RPMI 1640 (Thermo, 11,875,119) growth medium supplemented with 10% FBS (Thermo, 10100147C), 100 U/mL penicillin/streptomycin (Thermo, 15,070,063), L-glutamine (20 mM, Thermo, A2916801), 1% HEPES buffer solution (Thermo, 15,630,130), murine IL-4 (5 ng/mL, PeproTech, 214–14), and GM-CSF (5 ng/mL, PeproTech, 315–03). Half of the culture medium was replaced after 12 h and the medium was then refreshed every other day. BMDCs were finally obtained by gently harvesting the semi-adherent cells from the culture dishes on day 7. Over 80% of the cell population was positive for the dendritic cell-specific marker CD11c (Thermo, 12–0114-82), as confirmed by flow cytometry (BD Biosciences, USA, CantoII) (Fig. S1).
The following treatments were added to the cells: sodium arsenite (1 μM, 6, 12, and 24 h, Sigma-Aldrich, hereafter as Sigma, S7400), lipopolysaccharide (25 ng/mL, 6 and 12 h, Sigma, SMB00704), rapamycin (200 nM, Sigma, V900930), 3-methyladenine (3-MA, 1 mM, Sigma, M9281), and chloroquine (CQ, 20 μM, GlpBio, GC19549). Rapamycin, 3-MA, and CQ pre-treated BMDCs for 1 h and then co-treated with arsenic for 12 h. Treated cells were harvested at various times for the subsequent experiments.
Immunolabeling by flow cytometry
The different groups BMDCs were initially pre-treated with PBS containing 5% FBS for 20 min to obviate non-specific binding. Afterward, the flow cytometry was assessed as previously described (Li et al. 2021). BMDCs were separately incubated with appropriate anti-CD11c (PE-labeled, Thermo, 12–0114-82), anti-MHC II (FITC-labeled, Thermo, 11–5321-82), and anti-MHC I (PE Cyanine7-labeled, Thermo, 25–5999-82) for 30 min at 4 ℃. Blank and isotype controls were set concurrently. Finally, BMDCs were washed and immunolabeled fluorescence was measured using a flow cytometer (BD Biosciences, USA, LSRFortessa) at a rate of 10,000 events per sample.
Western blotting analysis
To extract whole-cell proteins, BMDCs were lysed in RIPA Cell Lysis Buffer (Sigma, V900854) containing protease and phosphatase cocktail inhibitor (Sigma, PPC1010). The lysates were sonicated and then centrifuged at 12,000 g for 15 min at 4 °C to collect whole-cell proteins in the supernatant. The lysosomal fraction was isolated using the Lysosome Isolation Kit (Sigma, LYSISO1) according to the manufacturer’s instructions.
Protein concentrations were measured using the BCA Protein Assay Kit (Thermo, 23,225). Thirty micrograms of protein per sample was separated by 10% SDS-PAGE and transferred to 0.2-μm PVDF membranes (Millipore, ISEQ00010). Membranes were blocked with 5% BSA (Sigma, V900933) or 5% non-fat milk for 1 h and then incubated with primary antibodies overnight at 4 °C. On the second day of the experiment, the membranes were washed and then exposed to the respective secondary antibodies diluted 1:2000–5000 for 2 h at room temperature. Blots were covered with the ECL (Tanon, 180–506) and visualized using an Electrophoresis Gel Imaging Analysis System (Azure Biosystems, USA, C500).
For the whole-cell protein samples, band densities were normalized to β-actin as a loading control. For the lysosomal fraction, LAMP2 was used as a loading control. Details of the primary antibodies used for western blotting are shown in Table S1.
RNA isolation and real-time PCR (RT-PCR)
The Trizol method was used to extract total RNA from BMDCs. The PrimeScriptTMRT reagent Kit (Takara, RR047A) was used for reverse transcription of the RNA into cDNA using a gradient PCR instrument (IMPLEN, Germany, N60 Touch). The TB Green ® Premix Ex Taq™ fluorescence quantification kit (Takara, RR820A) was used to prepare the reaction solution, and the reaction was performed using a two-step PCR amplification procedure with a QuantStudio 6 Flex Real-Time PCR System (ABI, USA). The relative differences in gene expression were calculated using the cycle threshold (Ct) values according to Eq. 2−△△Ct. Primers for the corresponding genes were designed and synthesized by Sangon Biotech (Shanghai, China), which are listed in Table S2.
Lysosomal staining
Fluorescent probes Lyso-Tracker (Beyotime, C1046) and Lyso-Sensor (Yeasen, 40767ES50) were used to label lysosome in primary BMDCs. Lyso-Tracker exhibits pH-independent fluorescence, while Lyso-Sensor exhibits a pH-dependent fluorescence. Therefore, we used Lyso-Tracker to detect lysosomal abundance and Lyso-Sensor to assess the relative changes in lysosomal pH. BMDCs were cultured on 14-mm glass bottom dishes coated with poly-d-lysine. After exposure to arsenic or other treatments, BMDCs were incubated with 50 nM Lyso-Tracker Red or 1 μM Lyso-Sensor Green in culture medium for 30 min at 37 °C, and then cells were gently rinsed twice with warm PBS. BMDCs visualized live using a Nikon Ni-U fluorescence microscope. Immunofluorescence images were captured from randomly selected fields to evaluate the experimental outcomes.
Immunofluorescence assay
After the indicated treatments, BMDCs were harvested and fixed with 4% paraformaldehyde (Sigma, 818,715) for 15 min and permeabilized with 0.5% Triton X-100 (Thermo, 85,111) for 20 min. Next, cells were incubated with BlockAid™ blocking solution (Thermo, B10710) for 1 h at room temperature, followed by overnight incubation at 4 °C with primary antibodies, which are listed in Table S3. Subsequently, cells were further incubated with the appropriate secondary antibodies for 1 h. Nuclei were stained with DAPI (Thermo, S36939) and samples were imaged by fluorescence microscopy (Nikon Ni-U).
Plasmid construction
The CRISPR/Cas9 knockdown technique was utilized to generate the TFEB/TFE3 knockdown plasmid (Plasmid-TFEB/TFE3 KD) and the negative control plasmid (NC, Plasmid-TFEB/TFE3 scrambled). Mouse Tfeb and Tfe3 sequences were obtained and target sequences were designed according to sgRNA target design principles, with nonsense sequences serving as sgRNA negative controls. The targeting sequences used are shown in Table S4. These target and nonsense sequences were cloned into the backbone vector (plasmid vector information: pLV-hU6-sgRNA-EFS-hCas9-2A-Puro) to generate the target plasmid. The gene editing plasmid was synthesized, transformed, and extracted, and the target gene sequence was sequenced at the target site and compared to identify successful plasmid construction for subsequent experiments. Furthermore, using the exogenous gene overexpression technique, the TFEB/TFE3 overexpression plasmid (Plasmid-TFEB/TFE3 OE) and negative control plasmid (NC, Plasmid-TFEB/TFE3 scrambled) were constructed. The Tfeb, Tfe3, and the nonsense sequences were designed and cloned into the plasmid vector (plasmid vector information: ppCDNA3.1( +)-CMV-MCS-3Flag) to generate the overexpression plasmids. The subsequent steps of plasmid transformation, extraction, and sequencing were carried out as described above.
Cell transfection
For the generation of a transient cell model of TFEB/TFE3 knockdown or overexpression in mouse primary BMDCs, electrotransfection was utilized. Firstly, the electrotransfection solution was prepared by mixing Nucleofector Solution from the Lonza transfection kit (Lonza, V4XP-3012) with supplement in a 4.5:1 ratio. The collected BMDCs were then resuspended in the prepared electrotransfection solution and transferred to the electrotransfection cups. Subsequently, the TFEB/TFE3 knockdown plasmid (Plasmid-TFEB/TFE3 KD) generated by CRISPR/Cas9 knockdown technique, TFEB/TFE3 overexpression plasmid constructed by exogenous overexpression technique (Plasmid-TFEB/TFE3 OE) or the negative control plasmid (NC, Plasmid-TFEB/TFE3 scrambled) was separately added to the electrotransfection cups according to the experimental design. After gently mixed, the electrode cups were then placed in the X-unit of the electrotransfer instrument, and the Nucleofector System (Lonza Group, Swiss) was initiated with the DJ-100 program selected for immature dendritic cells and the DN-107 program selected for mature dendritic cells (https://knowledge.lonza.com/). After completion of the electrotransfection process, the electrode cups were removed and the BMDCs were resuspended in pre-warmed RPMI-1640 culture medium. The transfection efficiency was evaluated by observing the fluorescence of the cells after 4–24 h, and subsequent experiments were carried out accordingly.
ELISA
The supernatants obtained from the BMDCs were collected, and ELISA kits were used to assess the levels of tumor necrosis factor (TNF)-α (Thermo, 88–7324), interleukin (IL)-1β (Thermo, 88–7013), and IL-6 (Thermo, 88–7064) following the manufacturer’s instructions. The absorbance of the samples was measured at 450 nm using a microplate reader (Biotech, H1MD). Cytokine concentrations were calculated and expressed in pg/mL.
Transwell migration assay
The experimental setup consisted of 200 μL BMDCs in an upper chamber with an 8-μm pore size Transwell, followed by 600 μL 1640 medium containing CCL19 (50 ng/mL, PeproTech, 250-27B) and CCL21 (50 ng/mL, PeproTech, 250–13) in the lower chamber. The upper chamber was then nested into the lower chamber and incubated in a CO2 incubator for 4 h. Subsequently, the upper chamber was removed and the BMDCs in the lower chamber were counted using a cell counter (ALIT Life science, China, IC1000). Migration rate (%) was finally calculated as the ratio of the cell numbers in the lower chamber to those in the upper chamber.
Antigen cross-presentation assay
The cross-presentation of ovalbumin (OVA) antigen (Sigma, A5503) by DCs to B3Z CD8 + T hybridoma cells was assessed using β-galactosidase (lacZ) color conversion. BMDCs were cultured with 1 mg/mL OVA for 24 h. OVA-pulsed BMDCs were then co-cultured with B3Z CD8 + T hybridoma cells in a 96-well U-bottom plate for a further 24 h. The centrifugated cells were then added to 150 μL CPRG lysis buffer (PBS supplemented with 0.15 mM chlorophenol red-β-galactopyranoside [GlpBio, GC47080] and [0.125% NP40 GlpBio, GF05305]) for 24 h under light avoidance in a CO2 incubator. Finally, 100 μL of the supernatant was transferred to a new 96-well flat-bottom plate, and the absorbance of the released chlorophenol red was measured at 590 nm using 650 nm as the reference wavelength as previously described (Zhang et al. 2017). The background absorbance value of co-cultured system containing B3Z CD8 + T hybridoma cells and BMDCs without OVA was subtracted in each assay.
Statistical analysis
A minimum number of mice required to perform a feasible and reproducible statistical analysis were consulted by a professional statistician before the study. Results were presented as Mean ± SEM. Statistical significance was determined by one-way analysis of variation (ANOVA) and least-significant difference (LSD) method (SPSS 17.0, SPSS Inc., Chicago, IL, USA). P < 0.05 was considered as statistically significant.

留言 (0)