
記住我
To investigate the novel transcriptome changes in MC-induced urothelial transformation, we performed transcriptome sequencing (RNA-Seq) in SV-HUC-1 and MC SV-HUC T2 cells. A total of 4762 differentially expressed genes (DEGs) with False Discovery Rate (FDR) no more than 0.05 and |log2 Fold Change| greater than 1 were screened out. Compared to the SV-HUC-1 group, MC SV-HUC T2 had 2428 genes upregulated while 2334 DEGs significantly downregulated (Fig. S1A). To understand the biological function of these DEGs, we conducted GO and KEGG pathway analysis. BP analysis showed that the DEGs were enriched in extracellular organization, CC analysis showed the DEGs were abundant in collagen-containing extracellular matrix and cell−cell junction, while MF analysis indicated the DEGs were mainly function in extracellular matrix structural constituent and integrin binding (Fig. S1B). Moreover, KEGG analysis suggested that the DEGs were linked to some cancer-related pathways, such as PI3K−Akt signaling pathway and MAPK signaling pathway (Fig. S1C), suggesting MC-induced urothelial transformation leading to core carcinogenic processes altered in the human uroepithelial cells.
To explore the profile by which MC-induced urothelial transformation regulates m6A modification, an m6A-modified RNA immunoprecipitation sequence (MeRIP-seq) was conducted in the cells. TopHat was used to map reads to the genome reference sequence. Compared with the normal cells, there were 730 m6A peaks on the transcripts of 659 genes that were significantly upregulated, and 246 m6A peaks on the transcripts of 232 genes were downregulated in the malignant transformation cells (Fig. S1D). Interestingly, these altered m6A genes were mainly enriched in protein folding, protein processing, and carcinogenic pathway according to the analysis results of GO and KEGG terms (Fig. S1E–F).
Translation is a critical step in gene expression regulation and also one of the energy-intensive biological activities in the cell. Translation dysregulation induced by abnormal function of upstream signaling pathways and/or alterations in the translation machinery components is frequent in the malignant transformation process (Bjornsti and Houghton 2004; Sun et al. 2021). Therefore, we depicted the translation and protein profiles by Ribo-seq analysis and proteome analysis. Using ribosome profiling sequencing, we detected a total of 5435 genes with changed translation levels in the MC SV-HUC T2 group (Fig. S2A). GO analysis of the altered genes revealed a strong enrichment for signal transduction and transmembrane transport (Fig. S2B). Further, KEGG analysis showed differential gene enrichment pathways involving Axon guidance, ECM-receptor interaction, focal adhesions, Hippo signaling pathway, and Rap1 signaling pathway (Fig. S2C).
A total of 699 proteins were differentially expressed between transformed cells and control cells. Of these, 331 proteins were upregulated and 368 were downregulated (Fig. S2D). The differentially expressed proteins (DEPs) were grouped into various biological processes, with the majority comprising neutrophil activation involved in the immune response, the ribose phosphate metabolic process, the ATP metabolic process, and cell redox homeostasis. The MF of these proteins is important in cadherin binding and unfolded protein binding. The CC analysis showed that these proteins were mainly in phagocytic vesicles, melanosomes, focal adhesions, secretory granule lumen, and mitochondrial matrix (Fig. S2E). KEGG pathway analysis showed Salmonella infection, protein processing in the endoplasmic reticulum (ER), pathogenic Escherichia coli infection, and tight junction were significantly involved (Fig. S2F).
We have described the hallmark of 3-MC malignant transformation at multiple levels including transcription, m6A, translation and protein levels. While single-level OMICS techniques have assisted to identify epigenetic alterations and molecular subtyping of tumors based on gene/protein expression, they lack the capacity to prove the causal link between molecular signatures and the phenotypic manifestation of cancer hallmarks. Multi-omics techniques, on the other hand, offer the potential to unveil the complicated molecular process underpinning diverse phenotypic manifestations of cancer hallmarks such as tumorigenesis and metastasis. The analysis integrating mRNA and translation levels, which aimed to explore the translation efficiency (TE), showed that the TE of 6120 genes was significantly changed (Fig. S3A). The genes were entered into the DAVID 6.8 database for GO enrichment analysis and KEGG pathway enrichment analysis. We observed the enrichment of terms linked to signaling, biological regulation, and metabolic process (Fig. S3B–C). It is suggested that the induction of 3-MC may exert carcinogenesis through the above pathways. m6A methylation modification was proven to alter the progression of tumor cells via weakening mRNA stability, increasing TE and nucleation efficiency (Deng et al. 2018; Jin et al. 2019; Lin et al. 2016; Yang et al. 2019). To identify what roles did m6A play in the process of 3-MC-induced uroepithelial transformation, transcriptome or translatome datasets were integrated with m6A datasets, respectively, to analysis. After 3-MC treatment, there were 190 genes with co-changes at mRNA and m6A levels and 136 genes with co-changes at TE and m6A levels (Fig. S4A–B). GO enrichment analysis implicated that these genes were primarily enriched in positive regulation of transcription by RNA polymerase II and cadherin binding (Fig. S4C). KEGG analysis also showed tight junction and protein processing in the endoplasmic reticulum (Fig. S4D). Taken together, it was suggested that m6A-regulated 3-MC-induced uroepithelial transformation may be dependent in part on its abilities to affect stability and TE of mRNA.
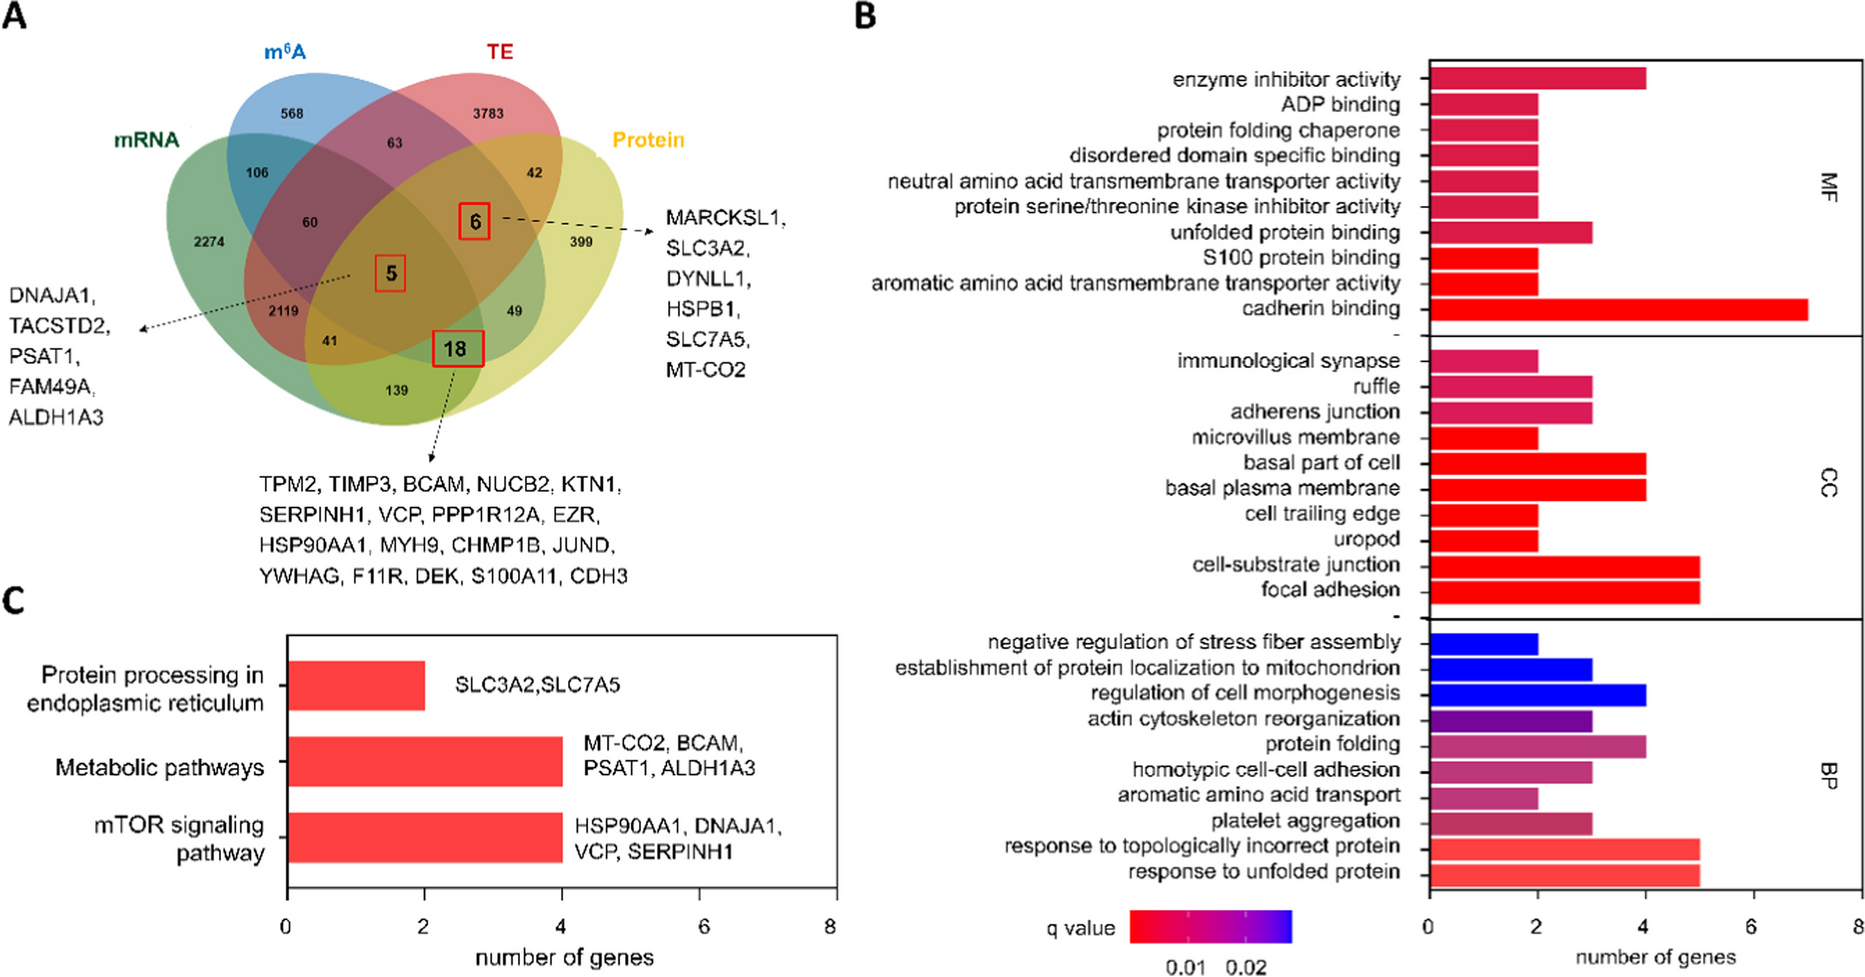
Next, we focused on the function of m6A in regulating stability and TE of mRNA and aimed to seek their key downstream gene. We brought the protein sequencing data of these genes into the integrated analysis, given that most genes perform their functions by directing the synthesis of proteins. Based on the integrated analysis, 29 genes were selected according to the conditions: (1) mRNA levels or translation efficiency were significantly changed; (2) protein levels were significantly changed; (3) m6A levels were significantly changed (Fig. 1A, Table 1). Fifteen genes were removed from the list of candidate genes due to their abnormal protein expression caused by post-translational modification or other m6A-independent factors. Following 3-MC therapy, the mRNA expression and m6A modification of certain genes involved in protein processing in the endoplasmic reticulum, including HSP90AA1, DNAJA1, and VCP, were changed. Furthermore, the expressions of MT-CO2, BCAM, PSAT1, and ALDH1A3 were substantially different between the two groups, indicating that both vitamin B6 metabolism and amino acid anabolism/catabolism were dysregulated in SV-HUC-1 cells following 3-MC therapy (Fig. 1B, C).
Fig. 1
Integrated analysis of muti-omics. A Venn diagram displaying overlapping significantly regulated genes at mRNA, m6A, translation, and protein levels (https://bioinfogp.cnb.csic.es/tools/venny/index.html). B GO function analysis of the key genes. C KEGG pathway enrichment analysis based on the key genes
Table 1 MeRIP-Seq and iTRAQ mass spectrometry data of the 14 candidate genesIdentification of key molecules SLC3A2/SLC7A5 in 3-MC-induced uroepithelial transformationAccording to the results of the multi-omics comprehensive analysis, the changes of SLC3A2 and SLC7A5 were most obvious during the 3-MC-induced uroepithelial transformation (Table 1). Interestingly, we found that the proteins encoded by SLC7A5 and SLC3A2 are bound to form a heterodimeric plasma membrane protein with extracellular disulfide to jointly play the role of amino acid transport. So SLC3A2 and SLC7A5 were selected as candidate targets for further investigation. To explore the biological function of 3-MC on SLC3A2/SLC7A5, we analyzed the SLC3A2/SLC7A5 mRNA, translation efficiency, protein, and m6A levels in MC-SV-HUC T2 and SV-HUC-1 cells. Compared to the control group, the mRNA levels of SLC3A2/SLC7A5 were not significantly upregulated after 3-MC treatment (Fig. 2A), while the protein levels significantly increased (Fig. 2B). Meanwhile, MeRIP-seq results showed the presence of m6A modifications in these two genes, and the m6A levels were also significantly enriched in after 3-MC treatment (Fig. 2C–E), which is consistent with previous studies showing that m6A methylation modifications affect translation efficiency. This raises the possibility that m6A methylation modifications may increase SLC7A5 and SLC3A2 protein expression in MC-SV-HUC T2 cells in a post-transcriptional manner.
Fig. 2
Validation of multi-omics sequencing results for SLC3A2 and SLC7A5. A RT-qPCR analysis of SLC3A2 and SLC7A5 mRNA in SV-HUC-1 cells and MC-SV-HUC T2 cells. B Western blotting of SLC3A2 and SLC7A5 expression in SV-HUC-1 cells and MC-SV-HUC T2 cells. Relative expression level =\(\frac\ \left(\textrm\ \textrm\textrm/\textrm\ \textrm\right)}\ \textrm\ \left(\textrm\ \textrm\textrm/\textrm\ \textrm\right)}\) C m6A sites in the SLC3A2 and SLC7A5 mRNA 3′UTR are shown using the MeRIP-Seq data in SV-HUC-1 and MC-SV-HUC T2 cells. D m6A enrichment in the SLC3A2 and SLC7A5 mRNA 3′UTR was validated by MeRIP-qPCR in SV-HUC-1 and MC-SV-HUC T2 cells. E m6A enrichment in the SLC3A2 and SLC7A5 mRNA 3′UTR was detected by single-base mapping of m6A. F The translation levels of SLC3A2 and SLC7A5 were shown using the Ribo-Seq data. G Polysome profile of SV-HUC-1 and MC-SV-HUC T2 cells. H RT-qPCR analysis of SLC3A2 and SLC7A5 mRNA derived from Polysome profiling. (**P<0.01, ***P<0.001)
To explore the specific m6A sites mentioned above, we used T3 DNA ligase, which has a significant steric hindrance effect on m6A modification sites. According to the previous m6A single nucleotide resolution m6A iCLIP (miCLIP)-Seq data, we retrievalled one SLC3A2 and three SLC7A5 m6A sites, with the unmodified A site serving as a negative control. As can be seen from Fig. 2E, the ligation efficiency of T3 ligase on SLC3A2-76 site and SLC7A5-1134 site was significantly inhibited after 3-MC treatment, indicating that 3-MC was able to increase the m6A modification on SLC3A2-76 site and SLC7A5-1134 site. Subsequently, our Ribo-seq sequencing data showed that the translation efficiency of SLC3A2 and SLC7A5 were significantly higher in MC-SV-HUC T2 cells than in control cells (Fig. 2F). In addition, polysome profile assay revealed that the overall translation levels of MC-SV-HUC T2 were increased (Fig. 2G). The mRNAs in the monosomal fraction combine one ribosome and have very low translation efficiency, so they were used as the reference to correct the initial total mRNA amount (Stark et al. 2019). SLC3A2 and SLC7A5 mRNA detected at a significantly increased abundance in the polysomal fraction showed that the translation efficiency of SLC3A2 and SLC7A5 was significantly up-regulated after 3-MC treatment (Fig. 2H), in agreement with the ribosome profiling results. Taken together, these results suggest that 3-MC treatment of human uroepithelial cells can increase the m6A modification on SLC3A2-76 site and SLC7A5-1134 site, improve the translation efficiency, and increase the protein expression level.
SLC7A5 and SLC3A2 promote uroepithelial cells transformation and tumorigenesisPrevious studies indicated that SLC3A2 and SLC7A5 exert functions through activating mTOR pathway in human tumors, thereby promoting growth and metastasis. To explore the functional role of SLC3A2 and SLC7A5 in the malignant transformation of 3-MC, we established stable overexpression or knockout models in normal and malignantly transformed cells. As expected, knockout of SLC3A2 and SLC7A5 remarkably suppressed the proliferation, migration, and invasion ability of MC SV-HUC T2 cells (Fig. 3A–D). In addition, overexpression of SLC3A2 and SLC7A5 greatly accelerated the proliferation, migration, and invasion of SV-HUC-1 cells (Fig. 3E–H). To further validate the oncogenic function of SLC3A2 and SLC7A5 in MC SV-HUC T2, we performed a subcutaneous implantation assay in nude mice to verify the effect of SLC3A2 and SLC7A5 knockout on tumorigenicity. We observed that stable knockout of SLC3A2 and SLC7A5 effectively inhibited tumor growth in vivo, as reflected by a significant reduction in tumor size and growth rate compared to non-target CRISPR-V2 controls (Fig. 3I–L). Moreover, Ki67 staining showed that the proliferation ability of tumor cells in vivo was also significantly inhibited after knockout of SLC3A2 and SLC7A5 (Fig. 3L). Therefore, our results indicate that SLC3A2/SLC7A5 exert the enormous function on promoting the malignant progression of bladder cancer cells in vitro and vivo.
Fig. 3
SLC3A2 and SLC7A5 promoted the growth and progression of bladder cancer cells in vitro and in vivo. A SLC3A2 and SLC7A5 were knocked out in MC-SV-HUC T2 cells. B Transwell assay to detect the effects of knocked out of SLC3A2 and SLC7A5 on invasion ability of MC-SV-HUC T2 cells. C MTS assay to detect the effects of knocked out of SLC3A2 and SLC7A5 on proliferation ability of MC-SV-HUC T2 cells. D Scratch assay to detect the effects of knocked out of SLC3A2 and SLC7A5 on migration ability of MC-SV-HUC T2 cells. E SLC3A2 and SLC7A5 were overexpressed in SV-HUC-1 cells. F Transwell assay to detect the effects of over-expression of SLC3A2 and SLC7A5 on invasion ability of SV-HUC-1 cells. G MTS assay to detect the effects of over-expression of SLC3A2 and SLC7A5 on proliferation ability of SV-HUC-1 cells. H Scratch assay to detect the effects of over-expression of SLC3A2 and SLC7A5 on migration ability of SV-HUC-1 cells. I Representation picture of tumor formation of xenograft in nude mice. J Weights of tumors in three groups were measured at the end point. K Summary of tumor volume of mice, which were measured every 7 days. L Representative images of SLC3A2, SLC7A5, and Ki67 IHC staining in tumors. Data are presented as ± SEM; n = 3. **p < 0.01, ***p < 0.001, ****p < 0.0001
m6A modification regulated SLC3A2/SLC7A5 translation in 3-MC-induced uroepithelial transformationOur previous data revealed that SLC3A2 and SLC7A5 mRNA levels were unchanged, and the translation efficiency, protein levels, and m6A modification levels were significantly increased after 3-MC treatment. Previous studies have found that YTHDF1 can selectively recognize m6A modifications on specific gene mRNAs to increase their translation efficiency and promote protein expression without affecting their mRNA abundance (Pi et al. 2021). Therefore, we hypothesized that an increase in the level of m6A modification leads to enhanced translation efficiency and upregulation of protein expression in SLC3A2 and SLC7A5 mRNAs. To verify this hypothesis, we first measured the expression levels of METTL3 and ALKBH5 in SV-HUC-1 and MC-SV-HUC T2 cells, which act as m6A writers and erasers, respectively, using a Western blot assay. Compared to SV-HUC-1 cells, METTL3 expression was slightly increased, while ALKBH5 expression was significantly decreased in MC-SV-HUC T2 cells (Fig. 4A), which is consistent with changes in other types of tumors (Wang et al. 2020a; Zhang et al. 2017). In SV-HUC-1 cells, ALKBH5 knockout or METTL3 overexpression both facilitated the expression of SLC3A2 and SLC7A5 (Fig. 4B). In contrast, in MC-SV-HUC T2 cells, knockout of METTL3 or overexpression of ALKBH5 reduced SLC3A2 and SLC7A5 protein levels (Fig. 4C). However, the mRNA levels of SLC3A2 and SLC7A5 were unchanged regardless of METTL3 and ALKBH5 knockout or over-expression in corresponding cell lines (Fig. 4D, E). Then, translation levels of SLC3A2 or SLC7A5 mRNA in each experimental group were measured using sucrose gradient fractionation. We found that the translation levels of SLC3A2 and SLC7A5 were significantly increased after over-expression of METTL3 or knockout of ALKBH5 (Fig. 4F, G) and decreased after knockout of METTL3 or over-expression of ALKBH5 (Fig. 4H, I). These data show that METTL3 and ALKBH5 modulate the expression levels of SLC3A2 and SLC7A5 via regulating the translation process of mRNA rather than directly affecting their mRNA levels.
Fig. 4.
METTL3 and ALKBH5 regulate m6A modification within the 3′ UTR of SLC3A2/SLC7A5 and SLC3A2/SLC7A5 translation. A Western blotting of METTL3 and ALKBH5 expression in SV-HUC-1 cells and MC-SV-HUC T2 cells. B Western blotting to verify the effect of METTL3 overexpression or ALKBH5 knockout on SLC3A2 and SLC7A5 expression in SV-HUC-1 cells. C Western blotting to verify the effect of METTL3 knockout or ALKBH5 overexpression on SLC3A2 and SLC7A5 expression in MC-SV-HUC T2 cells. D RT-qPCR results of SLC3A2 and SLC7A5 in METTL3-overexpressed or ALKBH5-knocked out SV-HUC-1 cells. E RT-qPCR results of SLC3A2 and SLC7A5 in METTL3-knocked out or ALKBH5-overexpressed MC-SV-HUC T2 cells. F RT-qPCR analysis of polysome-bound SLC3A2 or SLC7A5 mRNAs in METTL3-overexpressed SV-HUC-1 cells. G RT-qPCR analysis of polysome-bound SLC3A2 or SLC7A5 mRNAs in ALKBH5-knocked out SV-HUC-1 cells. H RT-qPCR analysis of polysome-bound SLC3A2 or SLC7A5 mRNAs in METTL3-knocked out MC-SV-HUC T2 cells. I RT-qPCR analysis of polysome-bound SLC3A2 or SLC7A5 mRNAs in ALKBH5-overexpressed MC-SV-HUC T2 cells
Programmable m6A modification of SLC3A2 and SLC7A5 mRNAs promotes its translationWe further investigated the role of these m6A sites, including SLC3A2-76 and SLC7A5-1134, in translational regulation. The catalytic structural domains of METTL3 (METTL3CD) and ALKBH5 (ALKBH5CD) were fused separately to catalytically inactive CasRx variants (dCasRx) and designed guide RNAs (gRNAs) for specific sites of target gene mRNAs. Under the guidance of gRNA, the dCasRx fusion protein could bind to the specific sites of target genes, thus achieving bidirectional regulation of m6A levels at specific sites in cell. Meanwhile, we generated catalytically inactive METTL3 and ALKBH5 mutants and constructed MUT-METTL3CD-dCasRx fusion protein and MUT-ALKBH5CD-dCasRx fusion protein with unchanged m6A levels and expression levels of SLC3A2 and SLC7A5 in cells. m6A MeRIP and single-base detection results showed that the dCasRx-METTL3 fusion protein in normal cells could significantly upregulate m6A at the SLC3A2-76 site and SLC7A5-1134 site (Fig. 5A, B) and correspondingly promoted gene expression with unchanged mRNA levels (Fig. 5C, D). In addition, the dCasRx-ALKBH5 fusion protein in MC-SV-HUC T2 cells significantly down-regulated the m6A levels at the SLC3A2-76 locus and SLC7A5-1134 locus (Fig. 5E, F) and repressed the expression of SLC3A2 and SLC7A5 with the mRNA levels remained unchanged (Fig. 5G, H). Overall, these data suggest that m6A modification at SLC3A2-76 site and SLC7A5-1134 site may exert considerable impact on the regulation of the translation process and upregulated protein expression of SLC3A2 and SLC7A5 in the process of 3-MC-induced uroepithelial transformation.
Fig. 5
Programmable m6A modification of SLC3A2 and SLC7A5 mRNAs promotes its translation. A MeRIP showed that the dCasRx-METTL3 fusion protein upregulated the m6A levels at SLC3A2-76 site and SLC7A5-1134 site in SV-HUC-1 cells. B Single-base detection of m6A showed that the dCasRx-METTL3 fusion protein upregulated the m6A levels at SLC3A2-76 site and SLC7A5-1134 site in SV-HUC-1 cells. C dCasRx-METTL3 fusion protein promoted SLC3A2 and SLC7A5 gene expression in SV-HUC-1 cells. D dCasRx-METTL3 fusion protein did not affect the mRNA levels of SLC3A2 and SLC7A5 in SV-HUC-1 cells. E MeRIP showed that dCasRx-ALKBH5 fusion protein downregulated the m6A levels at SLC3A2-76 site and SLC7A5-1134 site in MC-SV-HUC T2 cells. F Single-base mapping of m6A showed that dCasRx-ALKBH5 fusion protein downregulated the m6A levels at SLC3A2-76 site and SLC7A5-1134 site in MC-SV-HUC T2 cells. G dCasRx-ALKBH5 fusion protein inhibited SLC3A2 and SLC7A5 gene expression in MC-SV-HUC T2 cells. H dCasRx-ALKBH5 fusion protein did not affect the mRNA levels of SLC3A2 and SLC7A5 in MC-SV-HUC T2 cells
留言 (0)