Obtaining on clinical tissues
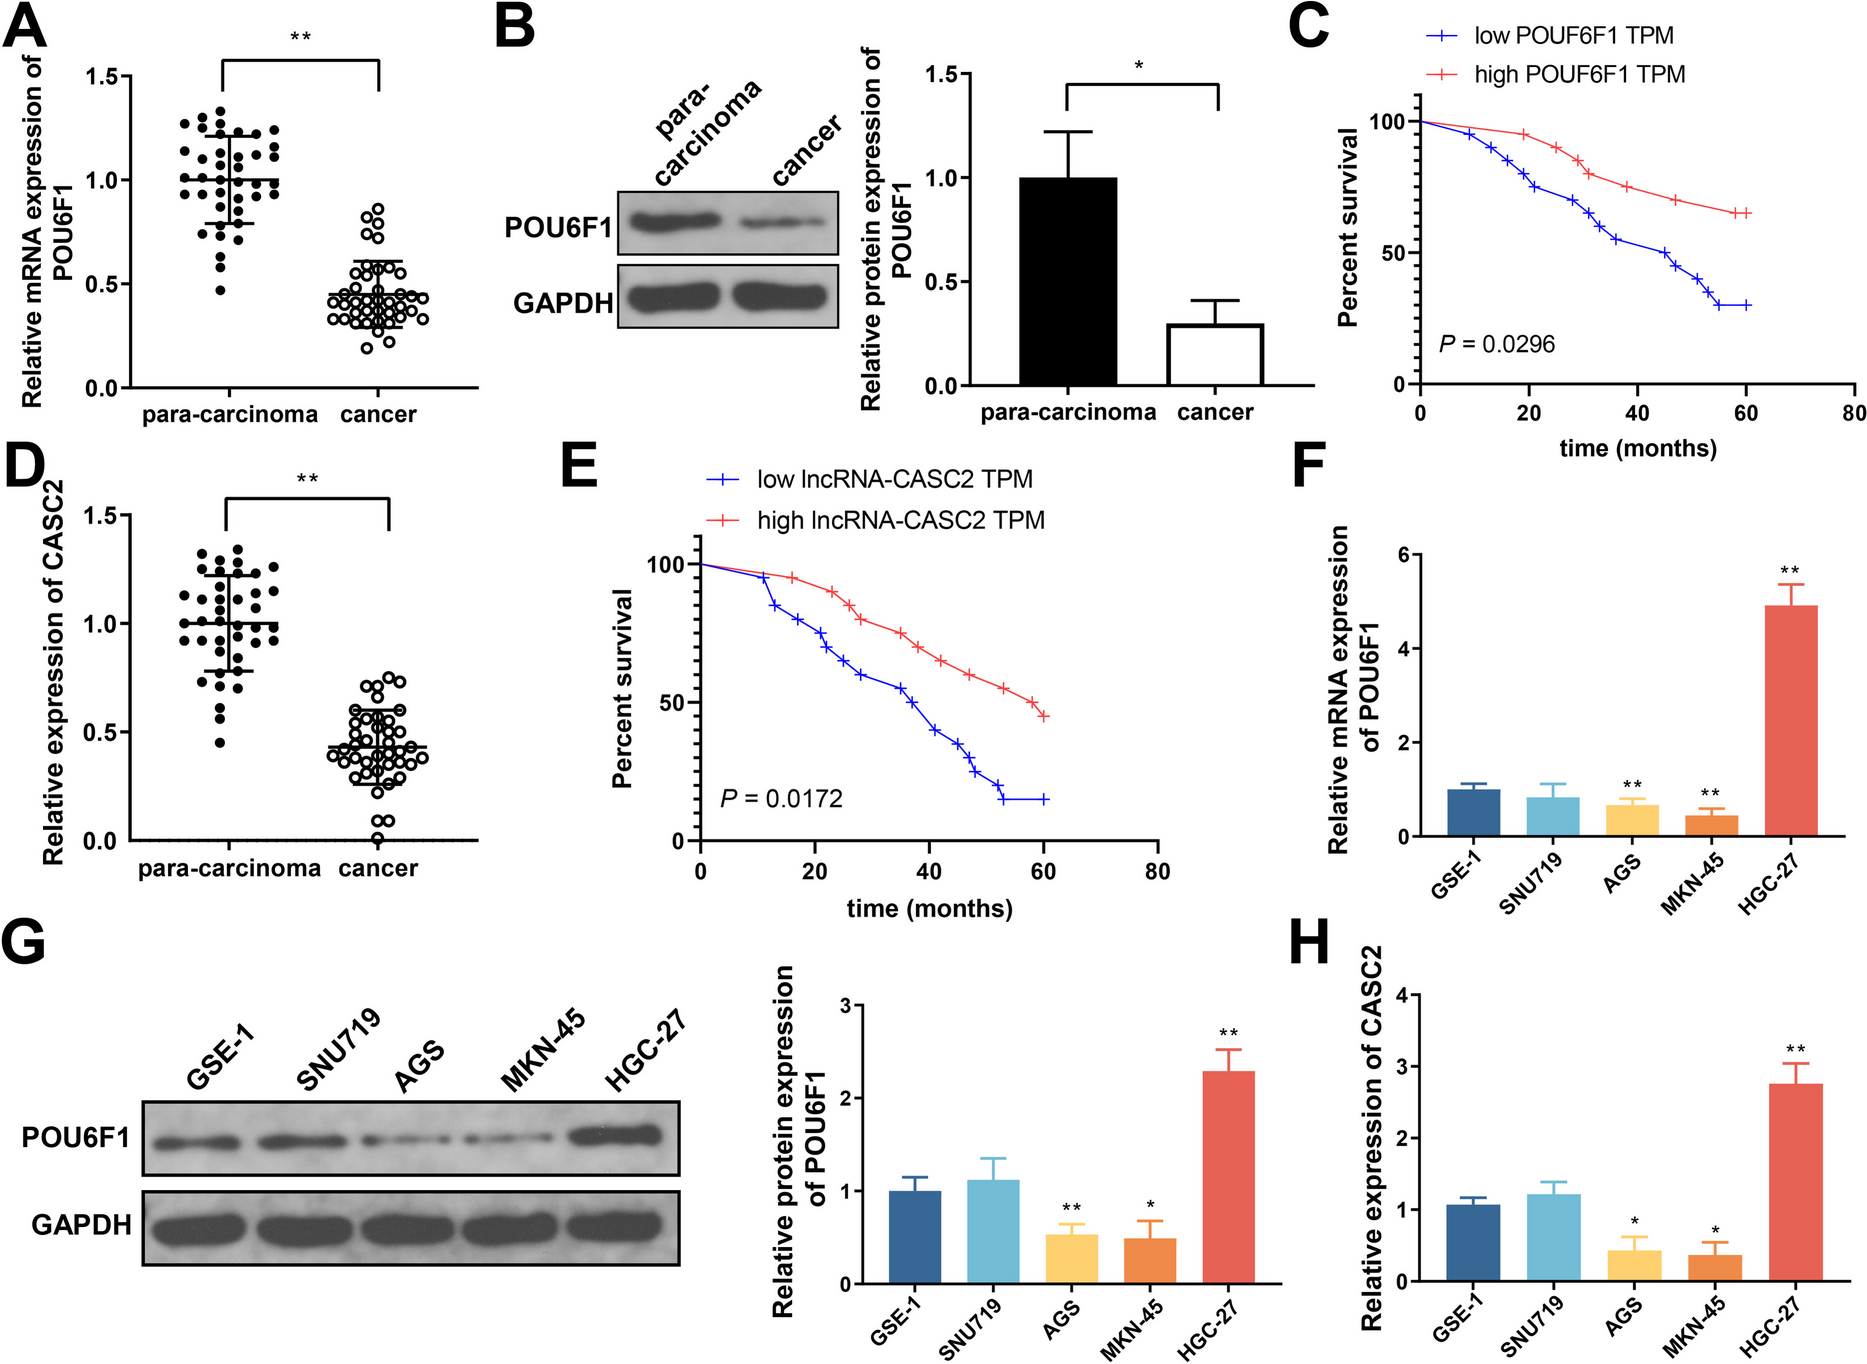
Based on Response Evaluation Criteria in Solid Tumors (RECIST), tumor and their corresponding precancerous tissues from 40 GC patients were selected from sample bank in the First Affiliated Hospital of Zhengzhou University. Immediately after surgical resection, the tissues were frozen and stored in liquid nitrogen.
Participants meeting following criteria were eligible for inclusion: 18–75 year old; GC diagnosed with histological evidence; without history of chemotherapy or radiotherapy; and free from other serious diseases (except GC).
Participants meeting following criteria were excluded: more than one cancer; significant multimorbidities; unwilling to participate; incomplete medical information or lost in follow-up; and pregnant or breastfeeding women.
Cell culture
Human GC cell lines include SNU719, AGS, MKN-45, and HGC-27. Human normal gastric epithelial cell line (GES-1) was used as control. All cells were purchased from ATCC (Manassas, Virginia, USA) and cultured in RPMI-1640 medium (Gibco, Grand Island, NY, USA) containing 10% FBS, 1% penicillin, and 1% streptomycin. Ferroptosis in GC cells were induced by 10 μM erastin (S7242, Selleck, TX, USA) and 2 μM RSL3 (S8155, Selleck) for 48 h.
Cell transfection
The lentiviral overexpression plasmid of POU6F1/CASC2 and the lentiviral overexpression/knockdown plasmid of SOCS2 were synthesized by WZ Biosciences Inc (Shandong, China).
The overexpression lentiviral plasmids were transfected into 293T cells via liposomes for lentiviral packaging. AGS and MKN-45 cells were infected (multiplicity of infection: 10), and puromycin was used to screen cells with stable overexpression. Knockdown plasmids were transfected by liposomes using LipoFiterTM transfection reagent (Hanbio, Shanghai, China) in AGS and MKN-45 cells. Transfection in each group was set up in three replicates. The overexpression plasmid vector was pCDH-GFP+puro-3xFlag (negative control: vector); the knockdown plasmid vector was sh-RNA (negative control: sh-NC). The lentiviral packaging plasmids psPAX2 and pMD2.G were purchased from Wuhan Bio-Tower (China).
Reverse transcription quantitative polymerase chain reaction (qRT-PCR)
TRIZOL (Invitrogen, Carlsbad, CA, USA) was used for total RNA extraction. RNA of 5 μL was diluted to 1:20 with RNA enzyme-free ultrapure water to detect the observance at 260 nm and 280 nm. A reverse transcription kit (TaKaRa, Tokyo, Japan) and LightCycler 480 (Roche, Indianapolis, IN, USA) instrument were used with reaction condition of pre-denaturation at 95 °C for 10 min, denaturation at 95 °C for 10 s, annealing at 60 °C for 20 s, and extension at 72 °C for 34 s, for 40 cycles. The primer sequences are in Table 1.
Table 1 Primer sequences for reverse transcription quantitative polymerase chain reactionWestern blot
Clinical tissue or tumor tissues from nude mouse were ground in liquid nitrogen. GC cells were lysed and placed on ice for 30 min for centrifugation at 4 °C and 12,000 rpm for 10 min. Then a 0.5-mL centrifuge tube was used to aspirate the supernatant for storage at −80 °C. After protein was mixing with loading buffer for boiling water bath to denature the protein, the proteins were electrophoresed on a 60 V and 120 V electrode. The proteins in PVDF membrane were treated with 5% skimmed milk-TBST for incubation for 1~2 h and treated with antibodies of POU6F1 (ab30944), SOCS2 (ab109245), GPX4 (ab125066), SLC7A11 (ab175186), and GAPDH (ab8245) in an incubator for overnight at 4 °C. All antibodies were from Abcam with a diluted ratio of 1:1000. After TBST washing (3 × 10 min), the proteins were incubated with HRP labeled goat anti rabbit IgG (1:5000, CWBIO, Beijing, China) for 1 h, followed by TBST washing (3 × 10 min). The membranes were subjected to color development and data analysis.
CCK-8 assay
Cell suspension (100 μL, 1×10⁵ cells/ml) were inoculated in each well of the 96-well plates. The volume of CCK-8 reagent (Dojindo) was 10 μL. After cell reaction for 24 h, the optic value was measured at 450 nm.
Measurement on total iron, lipid peroxidation (MDA), and glutathione (GSH) levels
The levels of total iron (OD at 593 nm) and Fe2+ (OD at 593 nm) were measured in GC cells using an iron assay kit (ab83366, Abcam). MDA production (OD at 532 nm) was measured using (MDA) Kit (ab233471, Abcam). GSH levels (OD at 405 nm) were measured using GSH Kit (ab239709, Abcam). The above assays were performed using a FlexStation 3 multifunctional enzyme marker (Flexstation3, Molecular Devices, Sunnyvale, USA).
Reactive oxygen species (ROS) levels using flow cytometry
AGS and MKN-45 cells were centrifuged (1200 rpm, 5 min) to collect cells. ROS levels were determined using a ROS kit (S0033S, Beyotime). The DCFH-DA was diluted with serum freed medium at 1:1000 to reach a final concentration of 10 μmol/l. Then 1 ml of DCFH-DA was added into cells for incubation at 37 °C for 20 min and blending every 3 min. Cells were washed (× 3 times) and detected using cytometry (CytoFLEX, BECKMAN, CA, USA).
Dual luciferase reporter gene assay
The binding sites for POU6F1 on the lncRNA-CASC2 promoter were predicted on JASPAR (http://jaspar.genereg.net/). The sequences of the binding sites (site 1 and site 2) were designed and synthesized for inserting into the luciferase reporter gene vector (pGL3-Basic, Promega, Madison, WI, USA) and cell transfection. The fluorescence intensity was measured using a dual luciferase reporter gene assay kit (Promega).
Chromatin immunoprecipitation quantitative PCR (ChIP-qPCR)
SimpleChIP Plus sonication chromatin IP kit (Cell Signaling Technology) was used. GC cells were fixed in 1% formaldehyde for DNA and protein cross-linking. Chromatin was cut using Microson Ultrasonic Cell DisruptorXL (Misonix) and was reacted with antibodies (anti-POU6F1 and IgG antibody) to enable the immunoprecipitates bind protein G magnetic beads. Then Protein-DNA cross-linking was reversed, and DNA was purified, in which the enrichment of CASC2 promoter was detected.
RNA pull-down assay
Pierce TMMagnetic RNA-Protein Pull-Down kit (Millipore, Billerica, MA, USA) was applied. Biotinylated lncRNA CASC2 (Geneseed, Guangzhou, China) or biotinylated NC were incubated with GC cell lysate. The complexes were captured with streptavidin-labeled immunomagnetic beads and then incubated with proteinase K-contained buffer at 25 °C for 1 h.
RIP assay
Cells were treated with RIP lysate for preparation of cell lysate. The re-suspended beads were reacted with FMR1 antibody (5 μg, ab259335, 1:100, Abcam). Then beads added RIP Wash Buffer (500 ul) for vortex and shaking, with the supernatant being discarded. This centrifugation and washing were repeated for one more time. The magnetic beads were added RIP immunoprecipitation buffer (900 ul). The pre-thawed cell lysis was centrifuged for 10 min (14,000 rpm, 4 °C), from which 100 ul supernatant was reacted with complex. After above centrifugation and supernatant removal process again, the tube was added RIP wash buffer (500 ul) again with the supernatant being removed. After washing for six times, the tube was re-suspended with bead-antibody complex in Proteinase K buffer (150 μl) (55 °C, 30 min). After supernatant in the tube was removed, the RNA was extracted for qRT-PCR.
Immunoprecipitation (Co-IP)
Cells were lysed in IP buffer (150 mM NaCl, 10 mM Tris-HCl, pH 7.5, 1% Nonidet P-40, supplemented with 1% protease inhibitor) for 30 min at 4 °C and treated with 20 mM NEM (N-ethylmaleimide) for centrifugation (12,000 rpm, 10 min, 4 °C), from which the supernatant was collected and reacted with SOCS2 or SLC7A11 antibodies for 2 h at 4 °C, followed by 2 h of incubation with ProteinA/G agarose beads at 4 °C. After cold IP buffer washing for five times, the complexes were collected by centrifugation (2000 rpm, 2 min) and boiled with 2×SDS sample buffer before western blot.
mRNA Stability
The expression of SOCS2 mRNA in Actinomycin D (1 μg/ml, Sigma-Aldrich)-treated GC cells at 0 h, 1 h, 4 h, 8 h, 12 h, and 24 h was detected by qRT-PCR.
Subcutaneous tumor formation in nude mouse
All experiments were conducted according to the regulation of experimental animals of the First Affiliated Hospital of Zhengzhou University (Approval no. 202310107). SPF staged BALB/c nude mice (n=24, 4–6 weeks old, 16 ± 2 g) from Hunan SJA Laboratory Animal Co., Ltd. were kept in a sterile laminar flow room at regular housing condition. Nude mice were randomly divided into four groups and received sodium pentobarbital (30 mg/kg) for anesthesia. MKN-45 cells stably expressing POU6F1 and CASC2 (2×10⁶ in 0.1 mL PBS) were injected subcutaneously into the left side of mice. When the tumor volume reached approximately > 60 nm3, 15 mg/kg of erastin was injected. The tumor volume was calculated at a regular base. After 5 weeks, mice were sacrificed and the tumor volume was calculated: 1/2 × long diameter × short diameter2. The tumor tissue was paraffin-embedded and sectioned for immunohistochemistry (IHC).
IHC
The paraffin sections (4 μm) were baked and then routinely dewaxed before 3% H2O2 was added and reacted. The slices were blocked with normal goat serum. After the excessive liquid was removed, primary antibodies of Ki-67 (12202S, 1:400), SLC7A11 (98051 , 1:400, cell signaling, Boston, USA), and SOCS2 (ab247806, 1:500, Abcam) were added, and the slices were reacted with secondary antibody for 1 h, followed DAB coloring and re-staining with hematoxylin. After dehydration and transparency, the slices were sealed for observation.
Statistical analysis
Data were processed using GraphPad prism7 and presented as mean ± standard deviation (mean ± SD). T test and one-way analysis of variance test were respectively used for pairwise comparison or comparison among multiple groups, with Tukey’s multiple comparisons test for post hoc comparisons. Kaplan-Meier survival analysis and Pearson correlation were performed to detect the association of target proteins with prognosis or their correlations. p < 0.05 indicates significant difference.

留言 (0)