
記住我


Numerous prediction tools have been proposed to predict a variety of health outcomes, including diabetes mellitus [1], hypertension [2], dyslipidemia [3], cancer [4], cardiovascular diseases (CVDs) [5], and mortality [6]. Because multiple risk factors usually contribute to the development of these health outcomes, prediction tools that account for the effects of multiple risk factors help stratify individuals according to their risk levels. Risk estimates from such models can also help people without a medical background to understand their likelihood of developing negative health outcomes.
Although many conventional approaches to developing risk prediction models employ a logistic regression or Cox proportional hazards model, a growing body of literature has used machine learning techniques as the conventional models cannot assume nonlinear associations; this may not reflect the complex nature of the health outcomes [3,7,8]. A meta-analysis of 23 studies that developed prediction tools based on machine learning techniques [7] reported a pooled c-index (i.e. an indicator of diagnostic ability) of 0.812, which suggests a good performance of models in terms of predicting diabetes mellitus.
The present study extends the previous studies in the following manner. First, we used DeepSurv [9], which is a neural network approach to survival analysis. It is promising because it simultaneously realizes nonlinear modelling and time-to-event survival analysis. It can model complex nonlinear interactions between multiple risk factors and enables survival analysis by dealing with censored cases, which other major machine learning techniques, such as decision trees and random forests, cannot handle. Despite the possible importance of prediction models based on the DeepSurv, few studies have used them [10–12]. Second, while previous studies using neural networks did not help understand the contribution of each risk factor to the calculated risk, we calculated the SHapley Additive exPlanations (SHAP) values [13], which is a new method proposed to address the ‘black box problem’ of machine learning.
Therefore, the purpose of this study was to develop risk prediction models by applying DeepSurv, a deep feed-forward neural network model for survival analysis. We focused on three major CVD risk factors (diabetes mellitus, hypertension, and dyslipidemia) as application examples of the DeepSurv models and compared their performances with those of Cox-based models.
METHODS DatasetThe Japan Epidemiology Collaboration on Occupational Health Study (J-ECOH) is an ongoing multicenter epidemiologic study at 12 companies, which includes various industries (electric machinery and apparatus manufacturing, steel, chemical, gas, nonferrous metal manufacturing, automobile and instrument manufacturing, plastic product manufacturing, and healthcare). The study aims to identify a range of determinants of workers’ health.
The J-ECOH study was approved by the Ethics Committee of the National Center for Global Health and Medicine (NCGM-S-001140). This study used anonymized data collected through the J-ECOH study.
Health check-upIn Japan, employers must organize annual health check-ups for their employees (including anthropometric measurements, physical examination, biochemical examination, and self-reported information on medication and diagnosis). The information collected at the study companies was sent to the J-ECOH study group.
Plasma glucose was measured either by enzymatic methods or the glucose oxidase peroxidative electrode method, whereas hemoglobin A1c (HbA1c) was measured by latex agglutination immunoassay, high-performance liquid chromatography method, or enzymatic method. Blood pressure was measured in a sitting position by trained nurses, with the arm held at the heart level, following the protocol at each company. Low-density lipoprotein cholesterol (LDL-C), high-density lipoprotein cholesterol (HDL-C), and triglycerides were measured using an enzymatic method.
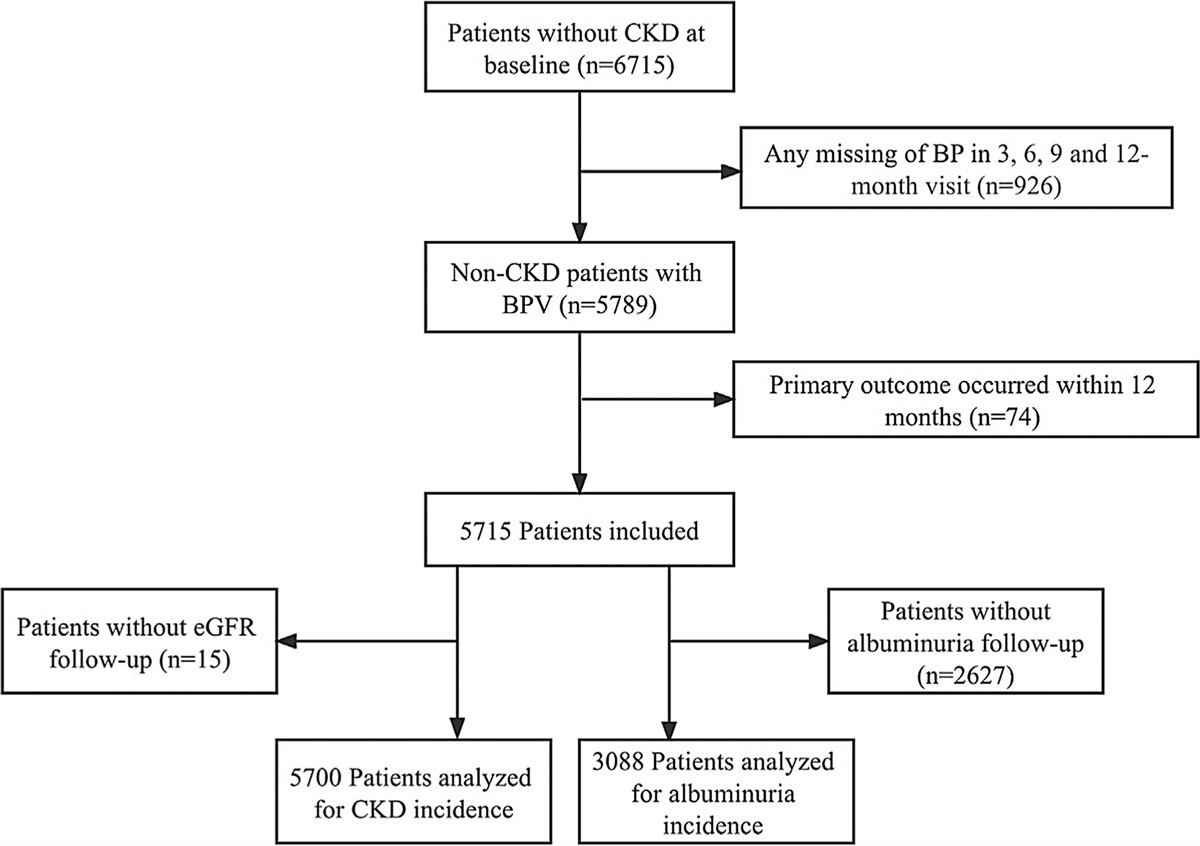
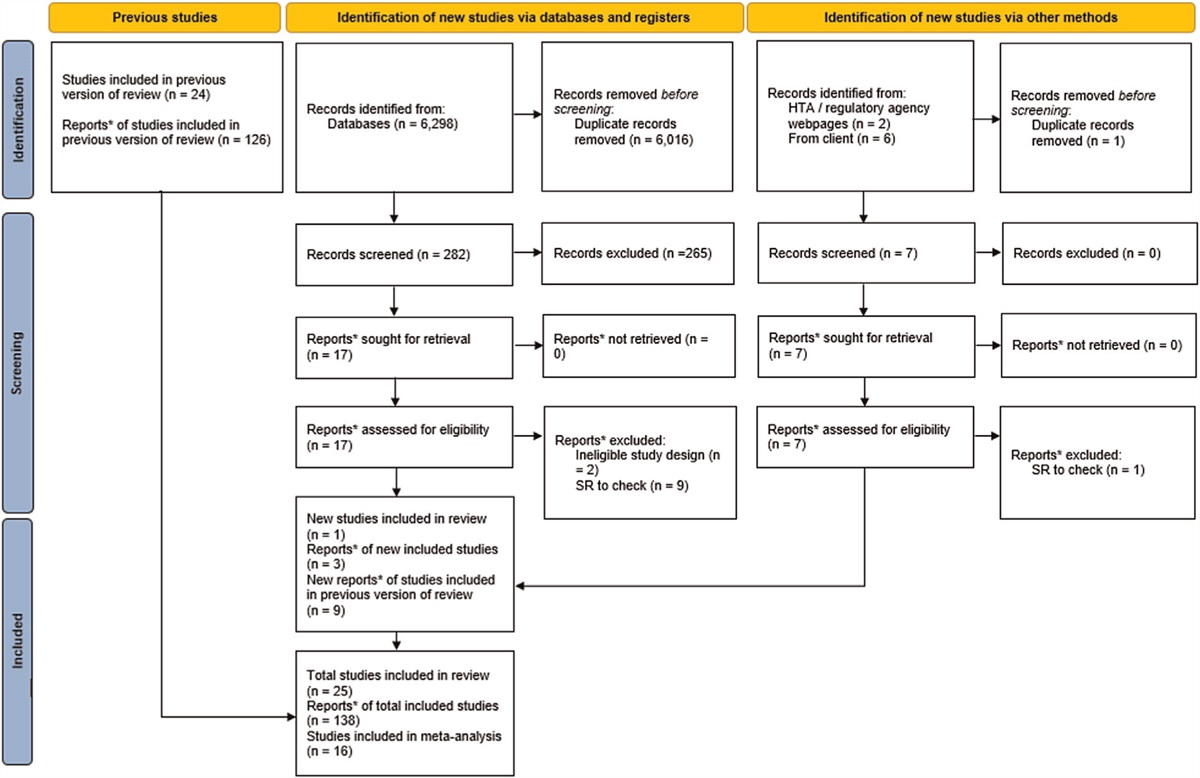
Analytic cohortWe used health check-up data of 147 548 individuals that participated in health check-ups from January 2010 to March 2018 (Fig. 1) and defined their first participation year as the baseline for each participant. Of these individuals, we excluded those who were less than 30 or at least 60 years old at the baseline given that a fair amount of those aged less than 30 years did not receive a blood test and that the age of 60 has long been the legal retirement age in Japan (n = 46 568), those who self-reported to have developed CVD or cancer (n = 2304), and those who had not fasted in the baseline measurement (n = 14 564).
 FIGURE 1:
 Selection of analytic cohorts.
From this point forward, the number of excluded participants varied between the three models. Specifically, for the diabetes mellitus model, we excluded those who were judged to be diabetic at the baseline (n = 5365). Diabetes mellitus at the baseline was defined as an HbA1c level at least 6.5%, fasting glucose level at least 126 mg/dl, or self-reported information on antidiabetic medication or diagnosis. We then excluded those with outliers (n = 50) at the baseline (the details of which are summarized in Supplementary Table S1, https://links.lww.com/HJH/C354), those with missing variables (n = 24 031) at the baseline (Supplementary Table S2, https://links.lww.com/HJH/C354), and those who did not participate in any of the subsequent health check-ups (i.e. follow-up information was not available; n = 3408). For the hypertension model, we excluded those who developed hypertension at the baseline (n = 16 273). Based on the Japanese Society of Hypertension Guidelines 2019, hypertension was defined as SBP at least 140 mmHg, DBP at least 90 mmHg, or self-reported information on antihypertensive medication or diagnosis. We then excluded those with outliers (N = 40) at the baseline (Supplementary Table S1, https://links.lww.com/HJH/C354), those with missing variables (N = 20 698) at the baseline (Supplementary Table S2, https://links.lww.com/HJH/C354), and those without follow-up information (N = 2904). Dyslipidemia at the baseline was defined as triglycerides at least 150 mg/dl, LDL-C at least 140 mg/dl, HDL-C less than 40 mg/dl, or self-reported information on antihyperlipidemic medication or diagnosis based on the criteria of the Japan Atherosclerosis Society 2012. The corresponding figures for the dyslipidemia model were 34 958, 38, 15 554, and 2110. Details of the missing values for the dyslipidemia model are also listed in Supplementary Tables S1, https://links.lww.com/HJH/C354 and S2, https://links.lww.com/HJH/C354. Consequently, the number of subjects was 51 258, 44 197, and 31 452 for the diabetes mellitus, hypertension, and dyslipidemia models, respectively.
Follow-upPerson-time was calculated from the date when individuals participated in health check-ups for the first time to the date of health check-ups when they were first judged to have the given outcome. Those who did not experience the outcome were censored on the date of their last participation in the health check-ups.
Incidence of diabetes mellitus, hypertension, and dyslipidemiaWe used the information collected in the subsequent annual health check-ups to define incident cases of diabetes mellitus, hypertension, and dyslipidemia. We used the same criteria to define incident diabetes mellitus, hypertension, and dyslipidemia as those employed to define the baseline conditions except for random glucose level at least 200 mg/dl, which was also used to define incident diabetes mellitus among those who were not fasting in the follow-up health check-ups.
Candidate predictor variablesFollowing previous studies that developed Cox-based risk prediction models [3,14–16], we created an exhaustive list of predictor variables for each outcome. We then selected variables based on their availability in occupational health settings in Japan (Table 1) as candidate predictor variables from which we selected predictor variables through the statistical selection procedures described in the next section.
TABLE 1 - List of candidate predictor variables used to develop risk prediction models for diabetes mellitus, hypertension, and dyslipidemia Diabetes Mellitus Hypertension Dyslipidemia DSa Coxb DSa Coxb DSa Coxb Basic attributes Sex ∗∗ ∗∗ ∗ ∗∗ ∗∗ ∗∗ Age ∗∗ ∗∗ ∗∗ ∗∗ ∗∗ ∗ Lifestyle behavior Smoking status ∗∗ ∗∗ ∗ ∗∗ ∗∗ ∗∗ Frequency of alcohol consumption ∗∗ ∗∗ ∗∗ ∗∗ ∗ ∗∗ Morbid conditions Gout/hyperuricemia ∗∗ ∗∗ ∗∗ ∗∗ – – Treatments Hypertension ∗∗ ∗∗ – – ∗∗ ∗∗ Dyslipidemia ∗∗ ∗∗ ∗ ∗ – – Measurements Height ∗∗ ∗∗ ∗∗ ∗∗ ∗ ∗∗ BMI ∗∗ ∗∗ ∗∗ ∗∗ ∗∗ ∗∗ SBP ∗∗ ∗∗ ∗∗ ∗∗ ∗∗ ∗∗ DBP ∗∗ ∗ ∗∗ ∗∗ ∗∗ ∗ TG ∗ ∗ ∗∗ ∗∗ ∗∗ ∗∗ HDL-C ∗∗ ∗∗ – – ∗∗ ∗∗ LDL-C – – ∗ ∗ ∗∗ ∗∗ FPG ∗∗ ∗∗ ∗∗ ∗∗ – – AST (GOT) ∗ ∗∗ – – – – ALT (GPT) ∗∗ ∗∗ – – ∗ ∗∗ γ-GTP ∗ ∗ ∗∗ ∗∗ ∗∗ ∗∗ HGB – – – – ∗ ∗∗ RBC – – – – ∗∗ ∗∗ALT (GPT), alanine transaminase (glutamic pyruvic transaminase); AST (GOT), aspartate transaminase (glutamic oxaloacetic transaminase); Cox, Cox proportional hazards model; DS, DeepSurv; FPG, fasting plasma glucose; HDL-C, high-density lipoprotein cholesterol; HGB, hemoglobin; LDL-C, low-density lipoprotein cholesterol; RBC, red blood cell; TG, triglyceride; γ-GTP, γ-glutamyl transpeptidase. ∗∗: predictor variables included in the final set; ∗: candidate predictor variables excluded during the selection procedures; –: variables not considered.
aPredictors were selected via permutation importance in which we measured the importance of each variable by computing the decrease in the prediction accuracy when the feature value was randomly shuffled.
bPredictors were selected using the backward selection method based on the Akaike information criterion.
The information on candidate predictor variables was also obtained during the health check-up. More specifically, the information on smoking status (never; former; currently smoke 1–10, 11–20, and ≥21 cigarettes/day) and frequency of alcohol consumption (hardly ever; sometimes; and everyday) as well as self-reported information on gout/hyperuricemia (yes/no) was collected via questionnaire. Hypertension and dyslipidemia were defined as explained earlier. Height and weight to calculate BMI were measured by trained staff members. Biochemical measurements were conducted in a standardized manner.
Statistical analysisWe assigned two-thirds of the participants to the derivation cohorts and the remainder to the validation cohorts by stratified randomization based on the incidence of the given event and 5-year age groups. More specifically, we generated random numbers (1, 2, and 3) based on the discrete uniform distribution for each stratum using ‘numpy’ library; those numbered 2 or 3 were allocated to the derivation cohort while those numbered 1 were allocated to the validation cohort. Consequently, 34 195, 29 618, and 21 083 subjects were included in the derivation cohorts for diabetes mellitus, hypertension, and dyslipidemia, respectively; correspondingly, 17 063, 14 579, and 10 369 subjects were included in the validation cohorts.
We normalized continuous variables (age, anthropometry, and biochemical measurements), and log-transformed aspartate transaminase (glutamic oxaloacetic transaminase) [AST (GOT)], alanine transaminase (glutamic pyruvic transaminase) [ALT (GPT)], and γ-glutamyl transpeptidase (γ-GTP) to reduce skewness before normalization. When we treated categorical variables (e.g. smoking status and the frequency of alcohol consumption) in DeepSurv models, we assigned integer values to each level and treated them as continuous variables (i.e. integer encoding).
To develop risk prediction models, we used the DeepSurv and Cox proportional hazards models. The hazard at time t in the Cox model is expressed as
hcox(t,x,b)=h0(t)exp(bTx),
where b is a coefficient vector, x is a vector of predictor variables for a subject at the baseline, and h0(t) denotes a baseline hazard function.
As DeepSurv is a nonlinear extension of Cox models, the hazard at time t for DeepSurv is described as
hdeepsurv(t,x,w)=h0'(t)exp(f(x,w)),
where f(x, w) refers to the output of the neural network model, w is a weight matrix, x is a vector of predictor variables for a subject at the baseline, and h0'(t) denotes another baseline hazard function. The weight matrix w is obtained using the backpropagation method in neural network training to maximize the partial log-likelihood.
In this study, when optimizing hyperparameters such as the number of layers and nodes in each layer and selecting predictor variables of DeepSurv, we performed a three-fold cross-validation to avoid overfitting in the derivation cohort. From a set of candidate predictors based on the previous literature, which is marked with an asterisk (∗) or a double-asterisk (∗∗) in Table 1, predictor variables in the DeepSurv-based risk models were selected via permutation importance, in which we measured the importance of each variable by computing the decrease in the prediction accuracy when the feature value was randomly shuffled [17,18]. This procedure is known to be less computationally intensive but performs as well as stepwise selection. Predictor variables for Cox PH-based models were selected using the backward selection method based on the Akaike information criterion. The final sets of predictor variables for each outcome are marked with a double-asterisk (Table 1).
We developed risk models to predict the 7-year risk of each outcome. The predictive performances of the DeepSurv-based and Cox PH-based models were assessed by scrutinizing two measures of discrimination: the time-dependent area under the receiver operating characteristic curve (AUROC) and Brier score. These scores range from 0 to 1, with a higher AUROC value and a lower Brier score indicating a better prediction. To assess the performance improvement of the DeepSurv-based models over the Cox proportional hazards-based models, we also computed the net reclassification improvement (NRI) and integrated discrimination improvement (IDI). The NRI is equivalent to the sum of the result of the proportion of those individuals who were reclassified as high in the new model subtracting that of those who were reclassified as low in the new model among those who developed the outcome and the result of the proportion of those individuals who were reclassified as low in the new model subtracting those who were reclassified as low in the new model among those who did not develop the outcome. The IDI directly calculates changes in the predicted values between the new and referent models with a particular focus on the sum of changes in predictive values in the new vs. referent models among those who developed the outcome (positive values indicating better performance in the new vs. referent models) and the sum of changes in predictive values in the new vs. referent models among those who did not develop the outcome (negative values indicating better performance in the new vs. referent models). Both indices take positive values, and a larger value indicates an advantage of the DeepSurv model over the Cox model. In addition, the agreements between the predicted and observed risks were also illustrated in the calibration plots. To facilitate the understanding of the contribution of each predictor to the predicted risk scores from the DeepSurv models, we calculated and graphically illustrated SHAP values [13].
All statistical analyses were conducted using Python ver. 3.9.5. (https://www.python.org/). Modules ‘pycox’, ‘lifelines’, and ‘SHAP’ were used to run DeepSurv models, Cox PH models, and calculation of SHAP values, respectively.
RESULTSThe baseline characteristics of the study participants are listed in Table 2, based on the outcomes. The mean age was 44.2–44.9 years old, while approximately 80% of the participants were male. We confirmed that there were no substantial differences in the basic characteristics between the derivation and validation cohorts.
TABLE 2 - Baseline characteristics of derivation and validation cohorts Diabetes mellitus Hypertension Dyslipidemia Derivation Validation Derivation Validation Derivation Validation Basic attributes Sex (men), n (%) 28 218 (82.5) 14 204 (83.2) 24 217 (81.8) 11 959 (82) 16 367 (77.6) 8003 (77.2) Age, mean [SD] 44.8 [7.6] 44.9 [7.6] 44.2 [7.5] 44.2 [7.5] 44.3 [7.7] 44.2 [7.7] Lifestyle behavior Smoking status, n (%) Never smoker 15 135 (44.3) 7427 (43.5) 13 079 (44.2) 6415 (44) 10 309 (48.9) 5025 (48.5) Past smoker 7342 (21.5) 3834 (22.5) 6050 (20.4) 3056 (21) 4383 (20.8) 2165 (20.9) 1–10 per day 2756 (8.1) 1389 (8.1) 2509 (8.5) 1237 (8.5) 1657 (7.9) 800 (7.7) 11–20 per day 7837 (22.9) 3855 (22.6) 6994 (23.6) 3373 (23.1) 4036 (19.1) 2013 (19.4) 21+ per day 1125 (3.3) 558 (3.3) 986 (3.3) 498 (3.4) 698 (3.3) 366 (3.5) Alcohol consumption frequency, n (%) Hardly ever 10 489 (30.7) 5203 (30.5) 9601 (32.4) 4756 (32.6) 6332 (30.0) 3082 (29.7) Sometimes 14 471 (42.3) 7208 (42.2) 12 678 (42.8) 6225 (42.7) 8735 (41.4) 4374 (42.2) Everyday 9235 (27.0) 4652 (27.3) 7339 (24.8) 3598 (24.7) 6016 (28.5) 2913 (28.1) Morbid conditions, n (%) Gout/hyperuricemia 901 (2.6) 458 (2.7) 480 (1.6) 251 (1.7) – – Treatments, n (%) Hypertension 6132 (17.9) 3084 (18.1) – - 3086 (14.6) 1494 (14.4) Dyslipidemia 15 133 (44.3) 7537 (44.2) 12 539 (42.3) 6192 (42.5) – – Measurements, mean [SD] Height (cm) 168.9 [7.7] 169 [7.6] 168.9 [7.7] 169 [7.8] 168.4 [8.0] 168.4 [8.0] BMI (kg/m2) 23.3 [3.3] 23.3 [3.3] 23 [3.2] 23 [3.2] 22.4 [3.1] 22.4 [3.1] SBP (mmHg) 120.2 [14.9] 120.3 [14.8] 116.4 [11.5] 116.5 [11.4] 118.3 [14.6] 118.5 [14.6] DBP (mmHg) 76 [10.5] 76 [10.5] 73.3 [8.4] 73.3 [8.4] 74.4 [10.4] 74.4 [10.4] TG (mg/dl) 119.1 [90.2] 118.5 [87.8] 115.8 [88.8] 115.2 [86.7] 79.4 [29.2] 79.6 [29.5] HDL-C (mg/dl) 59.4 [15.4] 59.3 [15.3] – – 64.2 [15.0] 64.4 [15.1] LDL-C (mg/dl) – – 120.8 [30.2] 121.2 [29.9] 106.6 [20.1] 106.6 [20.2] FPG (mg/dl) 96.5 [9.3] 96.7 [9.4] 98.3 [16.5] 98.1 [16.1] – – AST (GOT) (mg/dl) 22.8 [10.2] 22.8 [10.1] – – – – ALT (GPT) (mg/dl) 25.5 [18.1] 25.5 [18.0] – – 21.5 [14.9] 21.3 [14.0] γ-GTP (mg/dl) 43.3 [48.0] 43.2 [48.9] 40.5 [45.8] 40.7 [45.1] 35.5 [39.0] 34.9 [39.5] HGB (g/dl) – – – – 14.5 [1.4] 14.5 [1.4] RBC (104/μl) – – – – 475.1 [39.8] 474.9 [39.5]Values are expressed as the mean [standard deviation (SD)] for continuous predictors and n (%) for categorical predictors.ALT (GPT), alanine transaminase (glutamic pyruvic transaminase); AST (GOT), aspartate transaminase (glutamic oxaloacetic transaminase); FPG, fasting plasma glucose; HDL-C, high-density lipoprotein cholesterol; HGB, hemoglobin; LDL-C, low-density lipoprotein cholesterol; RBC, red blood cell; TG, triglyceride; γ-GTP, γ-glutamyl transpeptidase.
In the validation cohort of diabetes mellitus, 1181 participants developed diabetes mellitus during the follow-up period of 98 781.8 person-years. The corresponding figures were 3380 participants and 77 625.9 person-years for the hypertension model and 4903 participants and 43 372.4 person-years for the dyslipidemia model (Supplementary Table S3, https://links.lww.com/HJH/C354). Estimated hazard ratios and corresponding 95% confidence intervals (CI) obtained from the Cox proportional hazards models are summarized in Supplementary Table S4, https://links.lww.com/HJH/C354.
Table 3 lists the predictive performances of the risk prediction models in terms of predicting the 7-year risk of the three outcomes. The DeepSurv model for diabetes mellitus had an AUROC of 0.878 (95% CI = 0.864–0.892) and a Brier score of 0.070. The corresponding figures for the Cox model for diabetes mellitus were 0.872 (95% CI = 0.858–0.886) and 0.071. When we compared the two models, DeepSurv had a significantly better reclassification performance (NRI: 0.474, P ≤ 0.001) and integrated discrimination (IDI = 0.013, P ≤ 0.001) than the Cox model. The calibration plots for the DeepSurv and Cox proportional hazards models are shown in Fig. 2.
TABLE 3 - Predictive performance of the risk prediction models in terms of predicting 7-year risk of diabetes mellitus, hypertension, and dyslipidemia among Japanese working-age population AUROC (95% CI) Brier Score NRI (P value) IDI (P value) Diabetes mellitus DeepSurv 0.878 (0.864–0.892) 0.070 0.474 (P ≤ 0.001) 0.013 (P ≤ 0.001) Cox PH 0.872 (0.858–0.886) 0.071 Ref. Ref. Hypertension DeepSurv 0.835 (0.826–0.845) 0.156 0.194 (P ≤ 0.001) 0.007 (P ≤ 0.001) Cox PH 0.832 (0.822–0.841) 0.159 Ref. Ref. Dyslipidemia DeepSurv 0.826 (0.817–0.835) 0.165 0.397 (P ≤ 0.001) 0.043 (P ≤ 0.001) Cox PH 0.816 (0.807–0.826) 0.172 Ref. Ref.AUROC, area under the receiver operating characteristic curve; CI, confidence interval; NRI, net reclassification index; IDI, integrated discrimination improvement; Cox PH, Cox proportional hazard model.
 FIGURE 2:
 Calibration plots for the diabetes mellitus, hypertension, and dyslipidemia risk prediction models using the DeepSurv model and Cox proportional hazards model. The observed 7-year risk scores (mean of the actual counts of events) were calculated and plotted for each decile of the predicted 7-year risk scores. The diagonal dashed lines (y = x) indicate a perfect match between the actual and predicted values. Cox PH, Cox proportional hazards.
In the models predicting the 7-year risk of hypertension, the DeepSurv and Cox models had similar AUROCs (DeepSurv: 0.835, 95% CI = 0.826–0.845; Cox: 0.832, 95% CI = 0.822–0.841) and Brier scores (DeepSurv: 0.156; Cox: 0.159), but the predictive performance of the DeepSurv model was significantly better than that of the Cox model (NRI = 0.194, P ≤ 0.001; IDI = 0.007, P ≤ 0.001).
The DeepSurv model predicting dyslipidemia had an AUROC of 0.826 (95% CI = 0.817–0.835), which is similar to that of the Cox model (0.816, 95% CI = 0.807–0.826). The Brier score was 0.165 and 0.172 for the DeepSurv and Cox models, respectively. Like the previous two outcomes, the predictive performance of the DeepSurv model was better than that of the Cox model (NRI = 0.397, P ≤ 0.001; IDI = 0.043,
留言 (0)