
Remember me

This retrospective study was approved by the Ethics Committee of our institution. A total of 257 consecutive patients diagnosed with cHCC-CCA by postoperative pathology between January 2016 and December 2021 were included. Inclusion criteria were (1) a single mass, (2) MRI examination within 30 days before surgery, and (3) no history of any related treatment before surgery. Exclusion criteria were (1) lack of preoperative imaging data, (2) multiple lesions or concurrent other malignancies, such as HCC and ICC, and (3) patients who underwent hepatectomy more than once. Ultimately, 119 patients were enrolled in this study, and all cases were in accordance with the 2019 WHO classification [26]. The flow chart of patient registration is shown in Fig. 1.
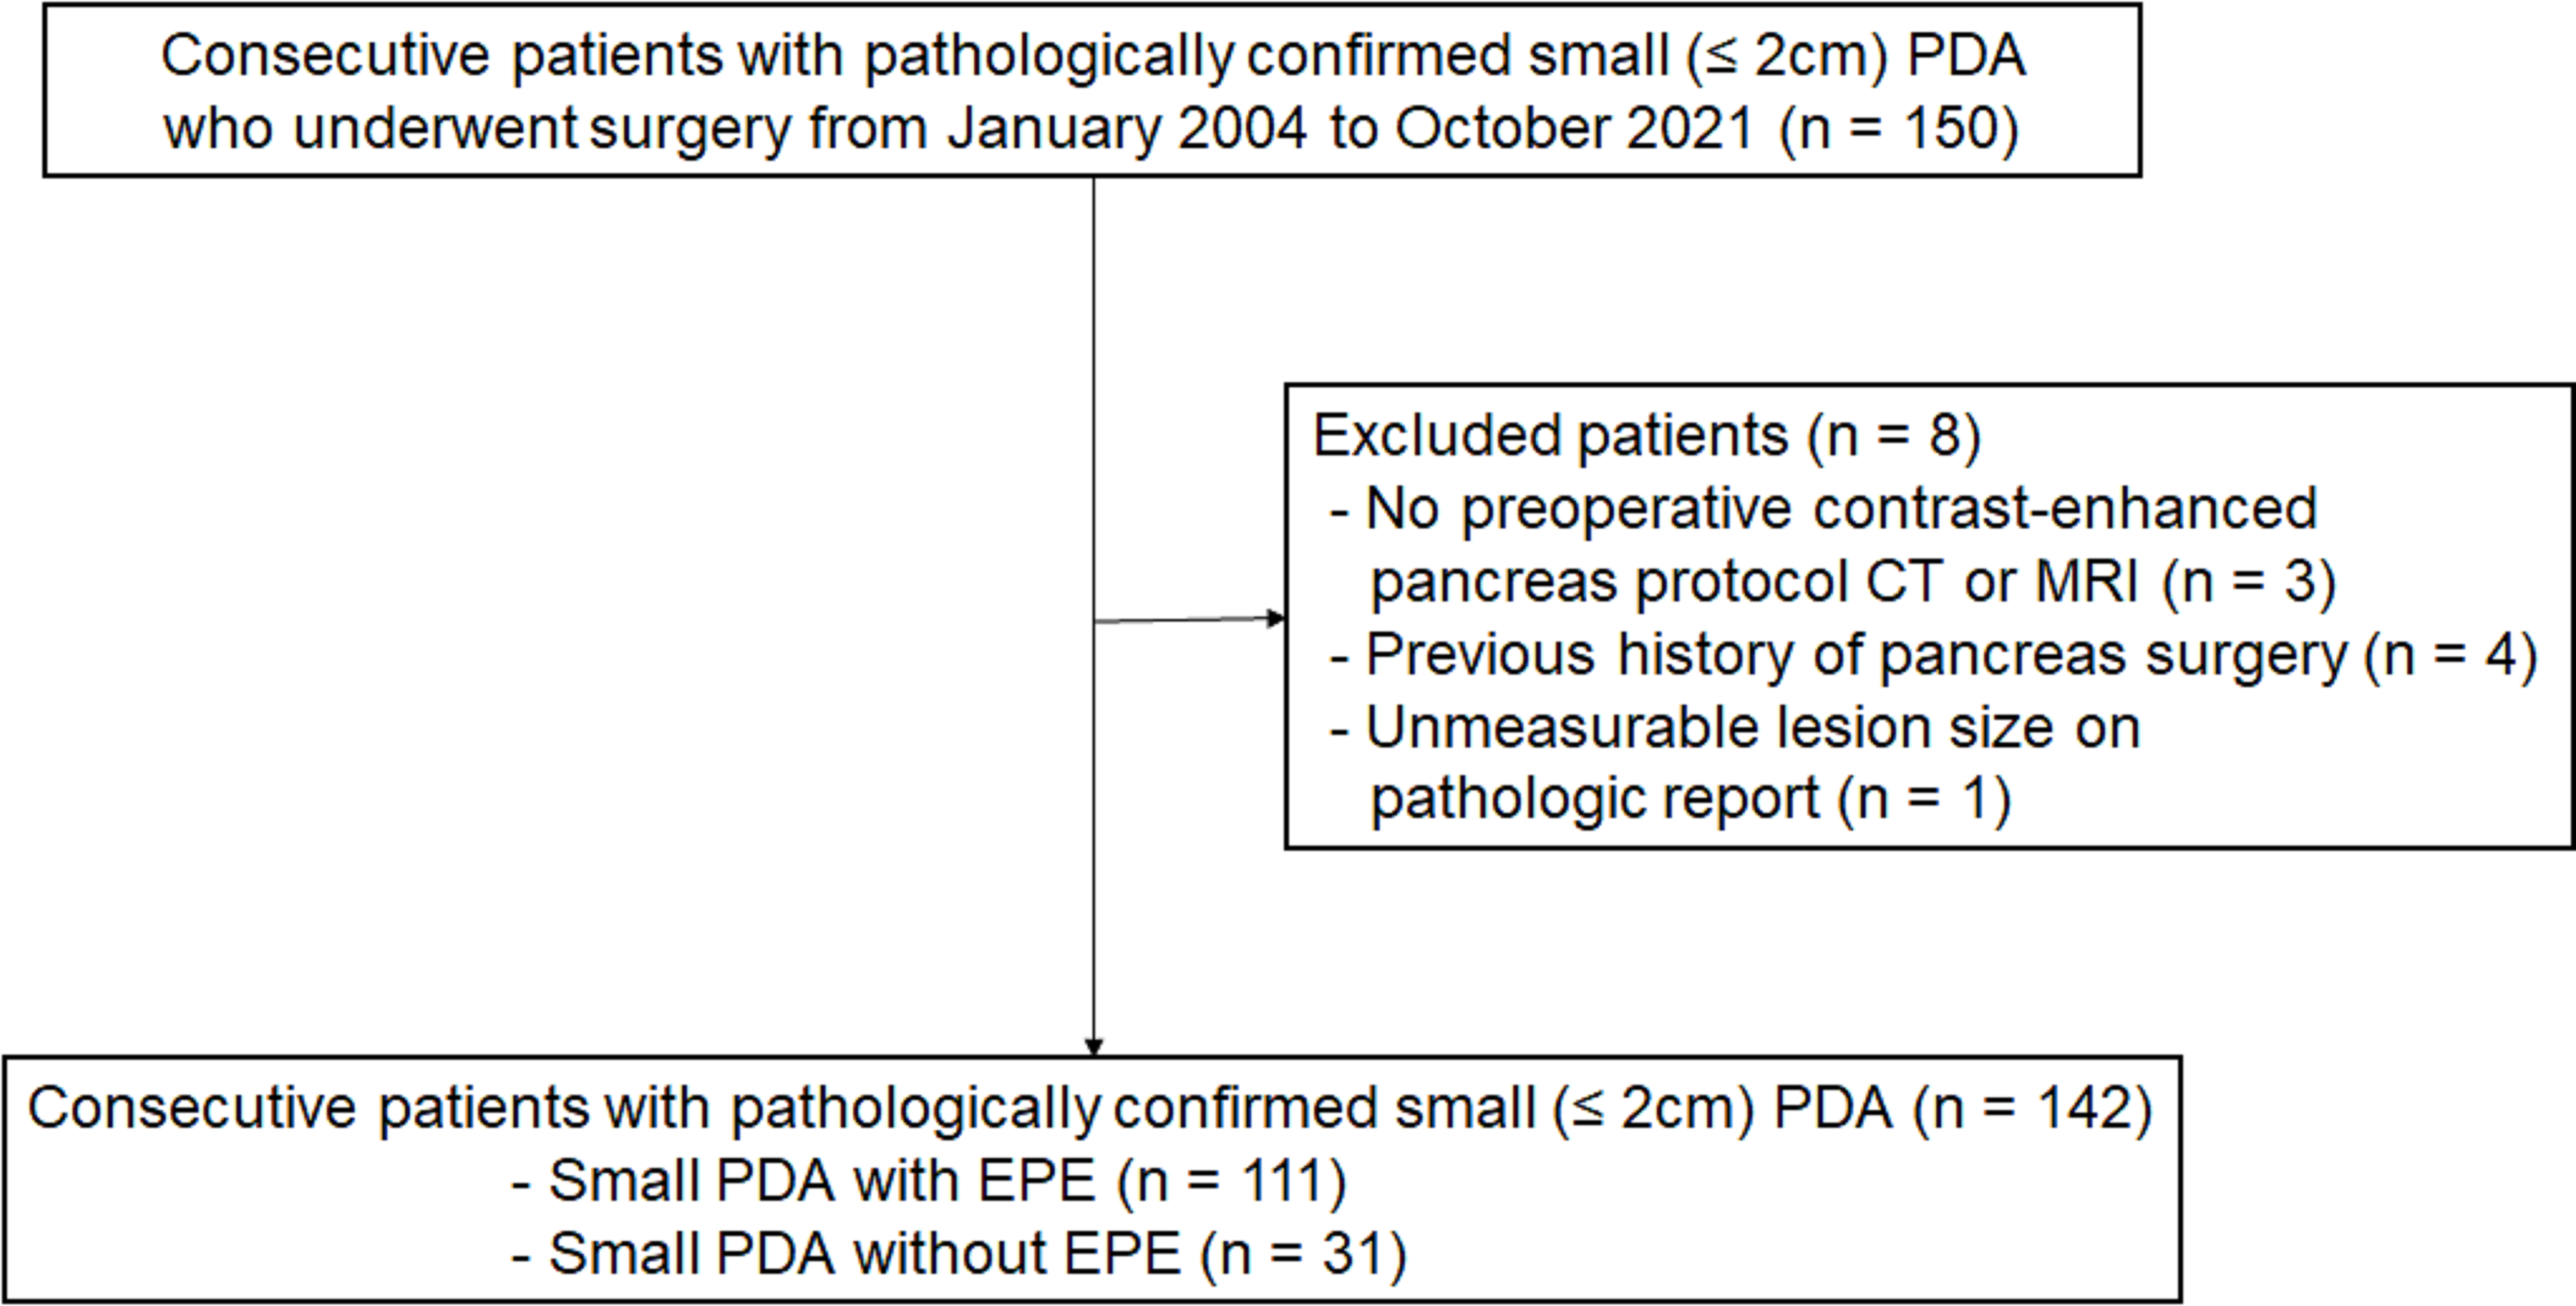
Fig. 1
Flowchart of this study population
Preoperatove MRIAll MRI examinations were performed using a Signa Infinity Twin Speed 8-channel body coil 1.5 T scanner (GE, USA). Patients fasted for 4 h before the scan. The following sequences were used: transverse T1-weighted breath-hold in-phase and opposed-phase gradient echo sequence, and transverse respiratory-navigated T2-weighted single-shot fast spin-echo sequences. Diffusion-weighted imaging (DWI) was performed using a spin-echo-echo planar imaging (SE-EPI) sequence with b values of 0 and 600 s/mm2. Gadolinium meglumine (Gd-DTPA, Beilu, China) at a dose of 0.1 mmol/kg was injected into the patient’s median cubital vein at a flow rate of 2.0 mL/s using a high-pressure syringe. Enhanced scans of the arterial, portal, and delayed phases were performed at 22–25 s, 55–65 s, and 120–160 s after Gd-DTPA injection, respectively. The detailed parameters of each acquisition sequence are provided in Table S1.
Imaging feature analysisAll MRI scans were evaluated independently by two radiologists (Z.J and H.L, with 7 and 14 years of abdominal imaging experience, respectively) using the picture archiving and communication system (PACS; Pathspeed, Pathspeed, GE Medical Systems Integrated Imaging Solutions). Both radiologists were aware that all patients had cHCC-CCA but were blinded to any clinical data or pathological findings. In case of disagreement, further analysis was conducted by both readers, followed by a consensual discussion.
The following imaging features of the lesions were evaluated on the unenhanced scan: (a) tumor shape (globular, lobulated, or irregular); (b) margin (smooth or non-smooth); (c) tumor location (right, left, or other liver lobes); (d) intratumoral hemorrhage; (e) intratumoral fat deposits; (f) intratumoral necrosis; (g) peritumoral bile duct dilation; (h) hepatic capsule retraction; and (i) DWI target sign. Dynamic enhancement features included (A) Arterial phase: (a) non-rim arterial phase hyperenhancement (APHE); (b) peritumoral enhancement; (B) Portal venous phase: (c) non-peripheral washout; (d) enhanced capsule; (C) Delayed phase: (e) delayed central enhancement; (D) Other features: (f) nodule-in-nodule architecture; (g) mosaic architecture. In addition, MRI features were classified according to LI-RADS Version 2018 [27]: LR-TIV (intravenous tumor), LR-M (definitely or probably malignant, not HCC-specific), or LR1-5 (1, definitely benign; 2, probably benign; 3, indeterminate probability of HCC; 4, probably HCC; or 5, definitely HCC).
Clinical variables and pathology evaluationThe following clinical data were collected from medical records: (a) demographic characteristics, including age and gender; (b) history of hepatitis B; (c) maximum tumor diameter, categorized into groups of 1–2 cm, 2–5 cm, and > 5 cm; (d) liver functional parameters, including alanine aminotransferase (ALT), aspartate aminotransaminase (AST), γ-glutamyltranspeptidase (GGT), albumin (ALB), pro-albumin (pro-ALB), total bilirubin (TB), and direct bilirubin (DB); (e) the following parameters were derived from neutrophil count, lymphocyte count, monocyte count, platelets, and liver function parameters: neutrophil-to-lymphocyte ratio (NLR = N/L), platelet-to-lymphocyte ratio (PLR = P/L), lymphocyte-to-monocyte ratio (LMR = L/M), albumin-to-alkaline phosphatase ratio (AAPR = ALB/ALP), aspartate aminotransaminase-to-platelet ratio (APRI = AST/PLT), aspartate aminotransferase-to-neutrophil ratio index (ANRI = AST/N), (alkaline phosphatase + gamma-glutamyl transpeptidase)/lymphocyte ratio (AGLR = (ALP + GGT)/L), γ-glutamyl transferase-to-platelet ratio index (GPRI = GGT/PLT), neutrophil to pro-albumin ratio index (NRPI = N/Pro-ALB), γ-glutamyl transferase-to-albumin ratio (GAR = GGT/ALB), and γ-glutamyl transferase-to-lymphocyte ratio (GLR = GGT/L); (f) tumor biomarkers, including alpha-fetoprotein (AFP), carcinoembryonic antigen (CEA), carbohydrate antigen 19-9 (CA19-9), and protein induced by vitamin K absence or antagonist-II (PIVKA-II).
The pathological features of hepatectomy patients were evaluated by experienced pathologists, who had at least 10 years of experience in reading tissue sections of liver cases and were unaware of the patients’ MRI characteristics and clinical indicators. Based on the pathological findings, the patients were divided into two groups: those who were positive for microvascular invasion (MVI) and those who were negative for MVI.
Statistical analysisContinuous variables that conformed to a normal distribution were expressed as the mean ± standard deviation (SD) and compared using an independent samples t test. Non-normally distributed continuous variables were represented as the median (25th, 75th percentile) and compared using the Mann–Whitney U test. Categorical variables were reported as frequencies and compared using the χ2 test. The interobserver agreement between two radiologists for imaging features was evaluated using the Cohen’s Kappa. The optimal cutoff points for NLR, PLR, LMR, AAPR, APRI, ANRI, GPRI, AGLR, NRPI, GAR, and GLR were determined using receiver operating characteristic (ROC) curves. Variables that reached statistical significance in the univariate analysis were included in a multivariate logistic regression analysis to investigate independent risk factors for MVI. A p value of less than 0.05 was considered statistically significant. All statistical analyses were performed using SPSS (version 26.0; IBM) and R software (version 3.6.1).
Comments (0)