
Remember me
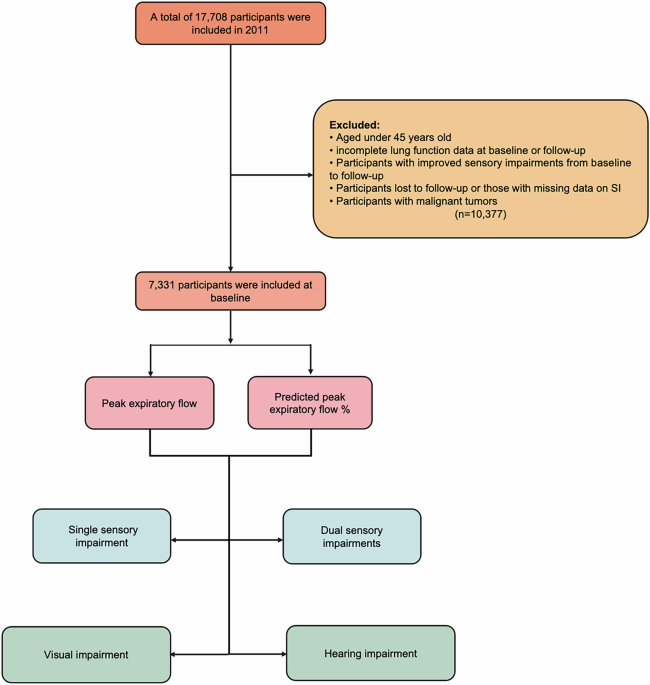

Table 1 presents the baseline characteristics of participants stratified by the quartiles of PEF. Among the 7331 participants included in the cross-sectional analysis, 5542 (75.60%) had VI, and 3852 (52.54%) had HI. Based on the number of sensory impairments, 2476 participants (33.77%) were categorized into the SSI group, and 3459 participants (47.18%) were categorized into the DSI group. Specifically, in the SSI group, 2084 participants had only VI, and 394 participants had only HI.
Table 1 Characteristics of included participants.The baseline characteristics of participants showed a median age of 58.00 years [51.00, 64.00], with 53.87% being female. When classified according to the quartiles of PEF (Table 1), the prevalence of SI significantly decreased with increasing PEF. Specifically, the proportion of participants with VI was 79.44%, 79.31%, 75.47%, and 67.94%, respectively, across the PEF quartiles. For HI, the proportions were 58.51%, 54.89%, 50.39%, and 46.07%, respectively. When classified by the number of sensory impairments, the prevalence of SSI was 31.15%, 34.19%, 35.60%, and 34.28%, respectively, and the prevalence of DSI was 53.40%, 50.00%, 45.13%, and 39.87%, respectively (all p < 0.001).
Additionally, participants with higher PEF were more likely to have the following characteristics: younger age, higher BMI, residing in urban areas, higher educational attainment, being widowed, divorced, or separated, past and current alcohol and tobacco use, and fewer comorbidities including hypertension, dyslipidemia, lung disease, and heart disease (Table 1). The baseline data stratified by the PEF % predicted quartiles can be found in Table S1.
Cross-sectional association between baseline PEF and sensory impairment in 2011This study employed both univariate and multivariate logistic regression analyses to investigate the cross-sectional associations between baseline PEF and PEF % predicted and the manifestations of SI (Table 2). According to the type of sensory impairment, first, for VI, the trend regression analysis of PEF showed that, compared to Q1, the OR for Q4 was 0.726 (95% CI 0.612, 0.862), and the trend OR was 0.894 (95% CI 0.846, 0.945). The trend regression analysis of PEF % predicted also showed that, compared to Q1, the OR for Q4 was 0.564 (95% CI 0.478, 0.667), and the trend OR was 0.829 (95% CI 0.786, 0.874). Furthermore, both PEF and PEF % predicted, treated as continuous variables, exhibited a significant dose-response relationship with VI (PEF: P-overall < 0.001; Non-linear P = 0.104; PEF % predicted: P-overall < 0.001; P non-linear = 0.049) (Fig. 2A, Figure S1A). For DVI and NVI, the trend regression analysis for PEF showed ORs of 0.881 (95% CI 0.839, 0.926) for DVI and 0.922 (95% CI 0.878, 0.969) for NVI. The trend regression analysis for PEF % predicted showed ORs of 0.755 (95% CI 0.719, 0.791) for DVI and 0.872 (95% CI 0.831, 0.914) for NVI. Further multivariate-adjusted RCS analysis results are shown in Figure S1. For HI, the adjusted trend regression analysis for PEF showed that, compared to Q1, the OR for Q3 and Q4 were 0.857 (95% CI 0.746, 0.983) and 0.769 (95% CI 0.662, 0.894), respectively, with a trend OR of 0.916 (95% CI 0.873, 0.961). The trend regression analysis for PEF % predicted showed that, compared to Q1, the OR for Q2, Q3, and Q4 were 0.795 (95% CI 0.692, 0.913), 0.623 (95% CI 0.542, 0.717), and 0.450 (95% CI 0.388, 0.522), respectively, with a trend OR of 0.770 (95% CI 0.735, 0.806). Further multivariate-adjusted RCS analysis revealed a significant dose-response relationship between both PEF and PEF % predicted as continuous variables and HI (PEF: P-overall < 0.001; P non-linear = 0.140; PEF % predicted: P-overall < 0.001; P non-linear = 0.406) (Fig. 2B, Figure S1A).
Fig. 2: The cross-sectional relationship between baseline PEF and the risk of various sensory impairments.
Based on a multivariable-adjusted restricted cubic spline model, we fully adjusted for factors such as age, gender, alcohol consumption, smoking, marital status, education level, place of residence, body mass index (BMI), hypertension, dyslipidemia, heart disease, stroke, lung disease, and diabetes. A Vision Impairment (VI); B Hearing Impairment (HI); C Single Sensory Impairment (SSI); D Dual Sensory Impairment (DSI). ight Y-axis: Density, represents the distribution density values of different PEF levels in the study population. lshap: stands for L-shaped restricted cubic spline curve.
Table 2 Cross-sectional association between PEF / predicted PEF % and sensory impairments in 2011.For sensory impairments categorized by number, for SSI, the trend regression analysis for PEF showed that, compared to Q1, the OR for Q4 was 0.784 (95% CI 0.632, 0.972), and the trend OR was 0.924 (95% CI 0.862, 0.990) (Table 2). The trend regression analysis for PEF % predicted showed that, compared to Q1, the OR for Q4 was 0.785 (95% CI 0.629, 0.980), and the trend OR was 0.915 (95% CI 0.853, 0.981). Further multivariate-adjusted RCS analysis revealed a significant dose-response relationship between both PEF and PEF % predicted as continuous variables and SSI (PEF: P-overall = 0.022; P non-linear = 0.108; PEF % predicted: P-overall < 0.001; P non-linear = 0.001) (Fig. 2C, Figure S1C). For only VI, the trend regression analysis for PEF showed that, compared to Q1, the OR for Q4 was 0.784 (95% CI 0.627, 0.979), and the multivariate trend OR was 0.923 (95% CI 0.860, 0.991) (Table S2). The trend regression analysis for PEF % predicted showed that, compared to Q1, the OR for Q4 was 0.788 (95% CI 0.630, 0.985), and the trend OR was 0.912 (95% CI 0.851, 0.978). For only HI, the trend regression analysis for PEF showed that, compared to Q1, the OR for Q4 was 0.676 (95% CI 0.471, 0.970), and the multivariate trend OR was 0.885 (95% CI 0.790, 0.991) (Table S2). The trend regression analysis for PEF % predicted showed that, compared to Q1, the OR for Q3 and Q4 were 0.575 (95% CI 0.403, 0.819) and 0.577 (95% CI 0.390, 0.854), respectively, with a trend OR of 0.804 (95% CI 0.712, 0.907). Finally, for DSI, the adjusted trend regression analysis for PEF showed that, compared to Q1, the OR for Q4 was 0.708 (95% CI 0.574, 0.873), and the trend OR was 0.884 (95% CI 0.826, 0.945) (Table 2). The trend regression analysis for PEF % predicted showed that, compared to Q1, the OR for Q3 and Q4 were 0.657 (95% CI 0.536, 0.806) and 0.458 (95% CI 0.371, 0.565), respectively, with a trend OR of 0.775 (95% CI 0.725, 0.829). Further multivariate-adjusted RCS analysis revealed a significant dose-response relationship between both PEF and PEF % predicted as continuous variables and DSI (PEF: P-overall < 0.001; P non-linear = 0.035; PEF % predicted: P-overall < 0.001; P non-linear < 0.001) (Fig. 2D, Figure S1D).
Longitudinal relationship between baseline PEF and the worsening sensory impairmentDuring the follow-up period, a total of 437 participants transitioned from Non-SI to SSI, and 616 participants transitioned to DSI. Additionally, 1584 participants in the SSI group transitioned to DSI. Regarding the analysis of the transition from Non-SI to Single SI, the trend regression analysis in the unadjusted model showed that, compared to Q1, the likelihood of transition to Single SI in Q4 was significantly reduced (OR 0.639, 95% CI 0.429, 0.952), with a trend OR of 0.860 (95% CI 0.758, 0.976). However, after adjustment, this result was no longer significant. For the analysis of the transition from Non-SI to DSI, the trend regression analysis in the unadjusted model showed that, compared to Q1, the likelihood of transition to DSI in Q4 was significantly reduced for both PEF and PEF % predicted. Specifically, the OR for PEF was 0.534 (95% CI 0.370, 0.772), and the OR for PEF % predicted was 0.631 (95% CI 0.434, 0.917) (Table 3, Table S3). In the adjusted trend regression analysis, the effect of PEF % predicted was no longer significant; however, the impact of PEF on the transition from Non-SI to DSI remained significant. The likelihood of transition in Q4 was significantly lower than in Q1, with an OR of 0.609 (95% CI 0.397, 0.933), and the trend OR was0.862 (95% CI 0.751, 0.988) (Table 3, Table S3). Further multivariate-adjusted RCS analysis revealed a significant dose-response relationship between PEF as a continuous variable and the transition from Non-SI to DSI (P-overall = 0.013; P non-linear = 0.329). Additionally, multivariate logistic regression analysis with PEF as a continuous variable showed a significant negative correlation between PEF and the transition in the overall cohort, indicating that for each 10 unit increase in PEF, the odds of transitioning to DSI were reduced (OR = 0.986, 95% CI: 0.975, 0.996). Finally, during the follow-up period, no significant associations were found between changes in PEF or PEF % predicted and the deterioration of SI (Fig. 3).
Fig. 3: The longitudinal relationship between baseline PEF, predicted PEF %, and the deterioration of sensory impairments.
Based on a multivariable-adjusted restricted cubic spline model, we fully adjusted for factors such as age, gender, alcohol consumption, smoking, marital status, education level, place of residence, body mass index (BMI), hypertension, dyslipidemia, heart disease, stroke, lung disease, and diabetes. A PEF and Non-SI to Single SI; B PEF and Non-SI to DSI; C PEF and Single SI to DSI; D Predicted PEF % and Non-SI to Single SI; E Predicted PEF % and Non-SI to DSI; F Predicted PEF % and Single SI to DSI. Right Y-axis: Density, represents the distribution density values of different PEF levels in the study population. lshap: stands for L-shaped restricted cubic spline curve.
Table 3 Longitudinal association between PEF/predicted PEF % and deterioration of sensory impairments.Subgroup analysisSubgroup analyses were conducted based on various characteristics such as age, sex, smoking status, drinking status, and lung disease, as shown in Table 4. In the cross-sectional subgroup analysis, we found that for every 10 L/min increase in PEF, the ORs for VI and HI in participants under 60 years of age were 0.986 (P < 0.001) and 0.990 (P < 0.001), respectively. In participants aged 60 years or older, PEF showed a significant negative association not only with VI and HI but also with SSI, with ORs of 0.983 (P < 0.001), 0.988 (P < 0.001), and 0.985 (P = 0.003), respectively. For those who had ever smoked or currently smoke, the relationship between PEF and SI was weaker, particularly for VI and SSI, where ORs were 0.985 (P = 0.080) and 1.000 (P = 0.921), respectively. Regarding PEF % predicted, except for the relationships with VI and SSI in participants aged ≥ 60 years and those with lung disease, the association between PEF % predicted and SI was not significant in these subgroups; however, it was significant in all other cases (Table 4).
Table 4 Subgroup analysis of the cross-sectional association between PEF / predicted PEF % and various sensory impairments.In the longitudinal subgroup analysis, for changes in PEF, the results showed that in participants under 60 years of age, PEF was significantly negatively associated with the transition from Non-SI to SSI (OR = 0.983, P = 0.019). In participants aged 60 years or older, the relationship between PEF and sensory impairment deterioration was weaker. Moreover, in males, there was a stronger negative correlation in the transition from Non-SI to SSI (OR = 0.985, P = 0.032). For non-smokers, PEF was significantly negatively correlated with the transitions from Non-SI to DSI and Single SI to DSI (Non-SI to DSI OR = 0.983, P = 0.045; Single SI to DSI OR = 0.988, P = 0.035). Finally, in participants with lung disease, there was also a strong negative correlation in the transition from Non-SI to SSI (OR = 0.985, P = 0.032). Regarding changes in PEF % predicted, for non-smokers, PEF % predicted was significantly associated with the transition from Non-SI to DSI (OR = 0.949, P = 0.037); in all other conditions, the relationship was not significant (Table S4).
Comments (0)