
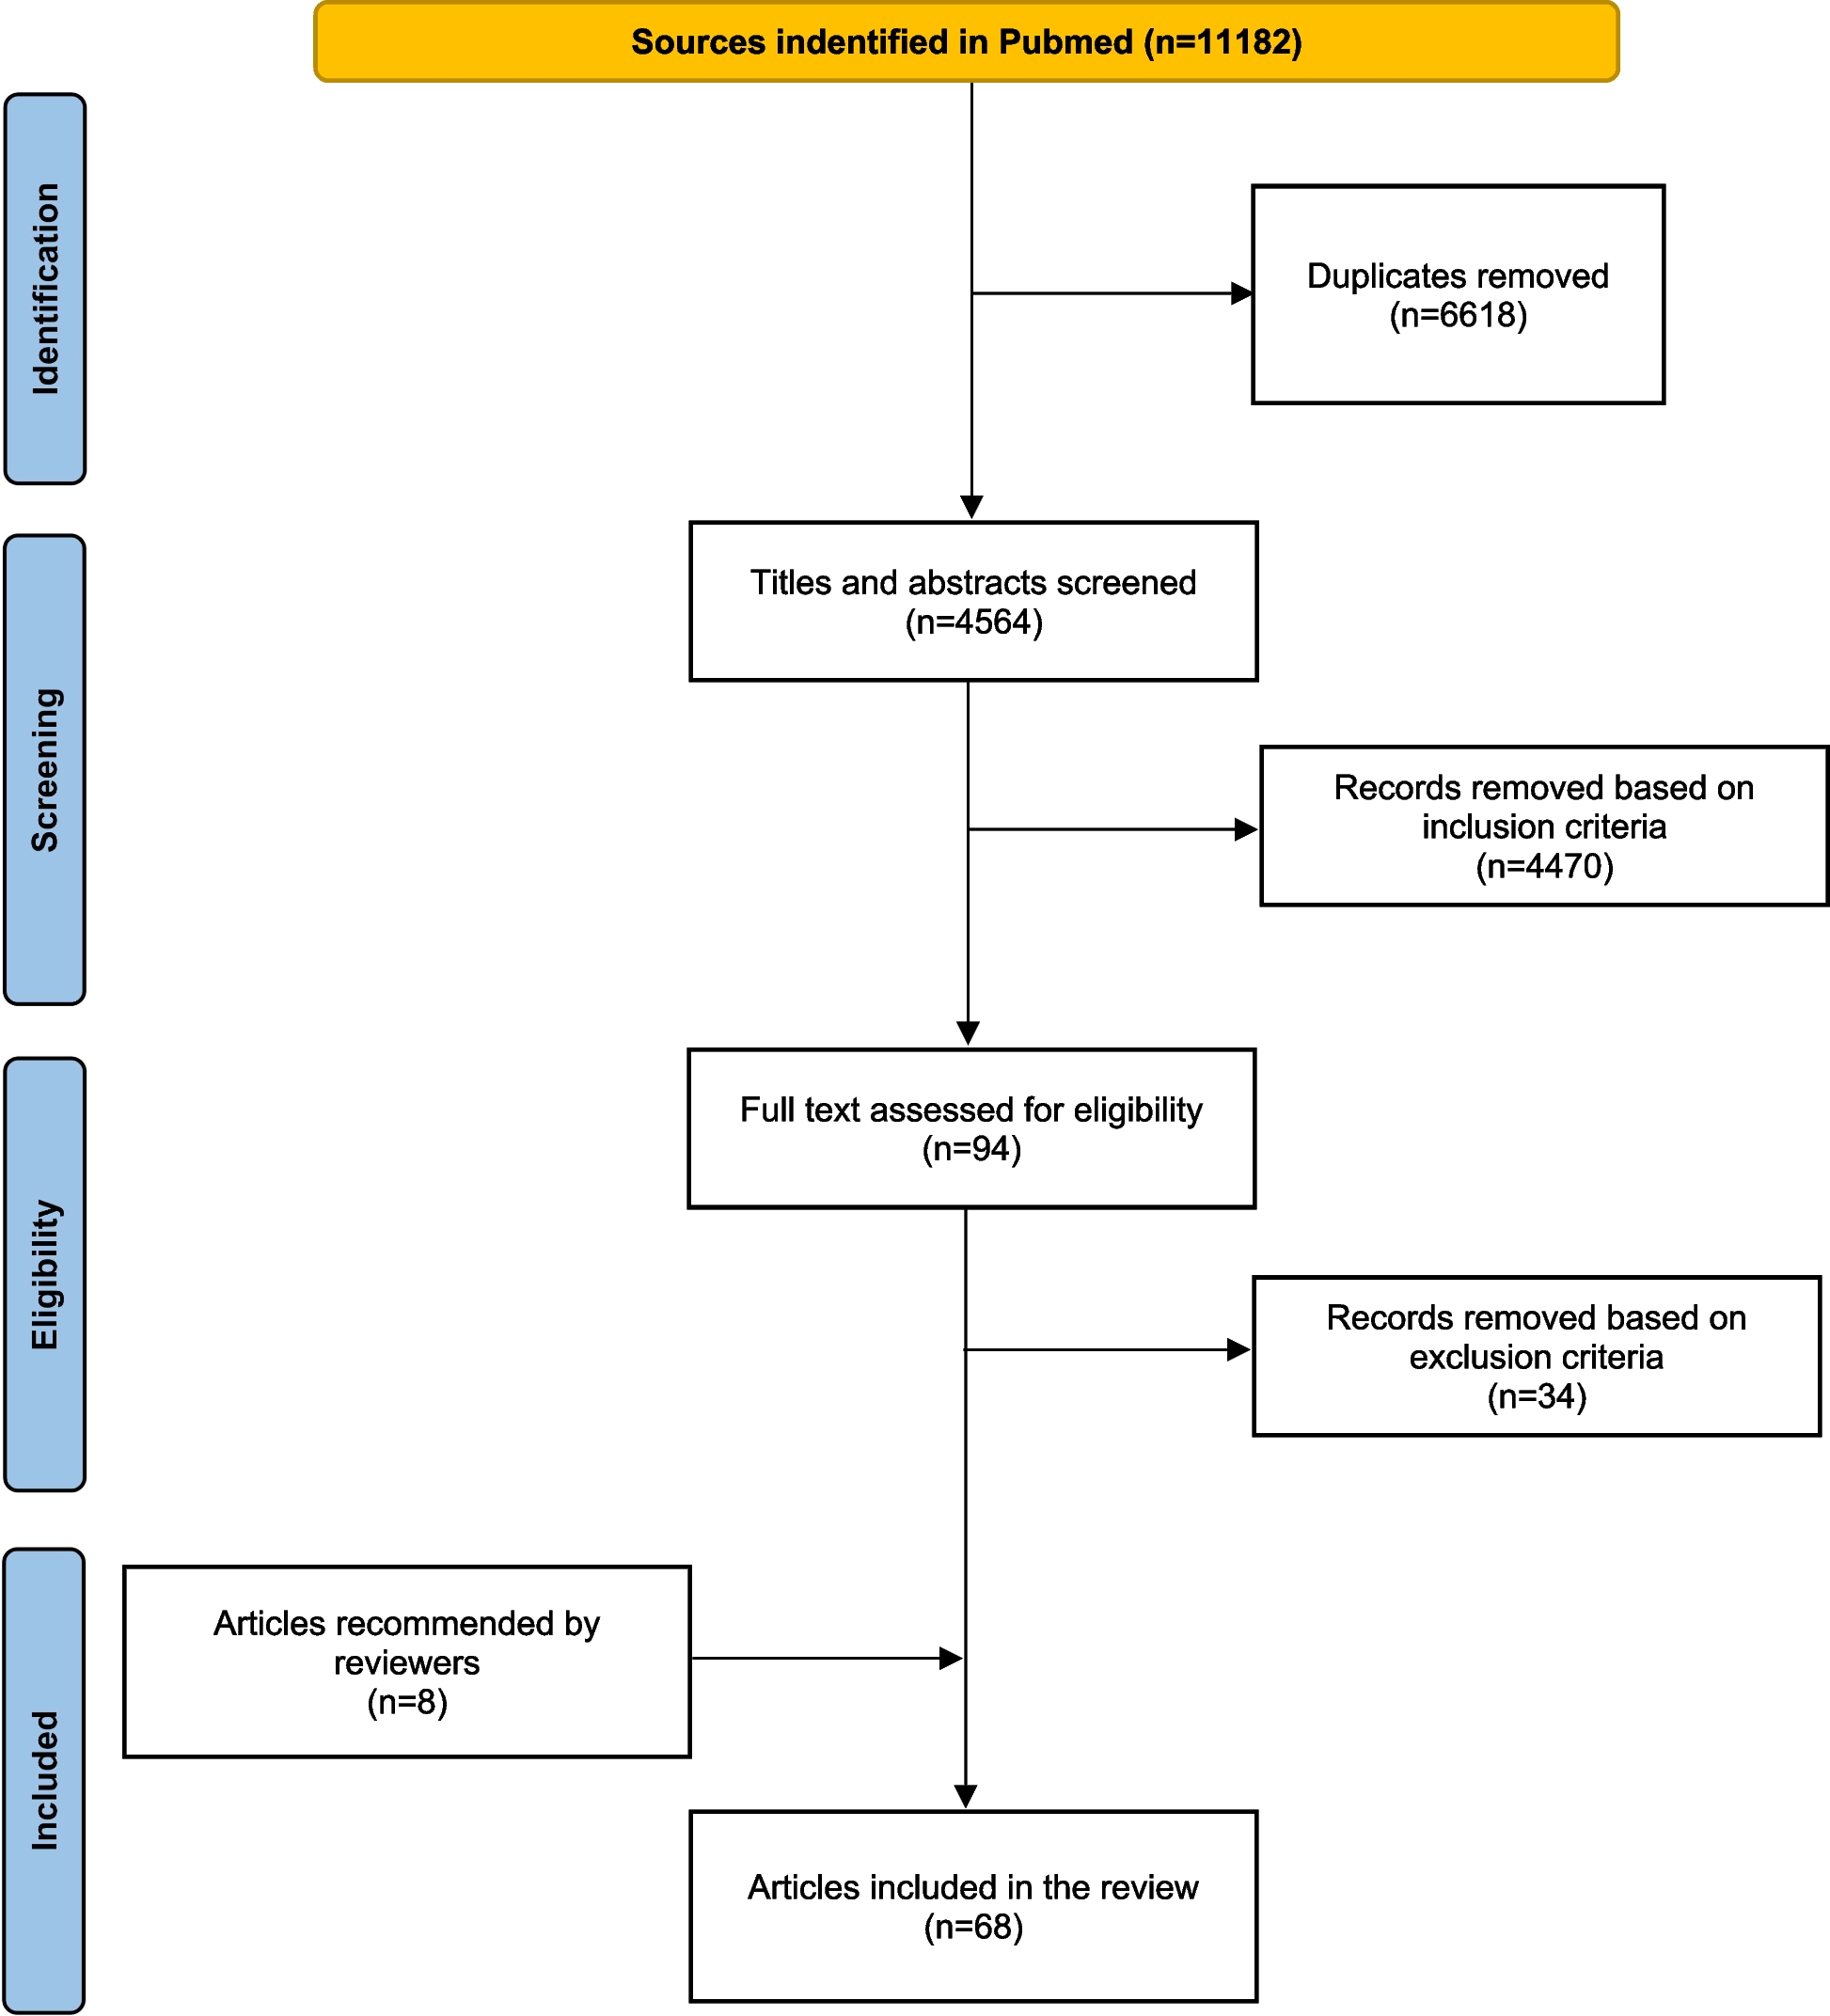
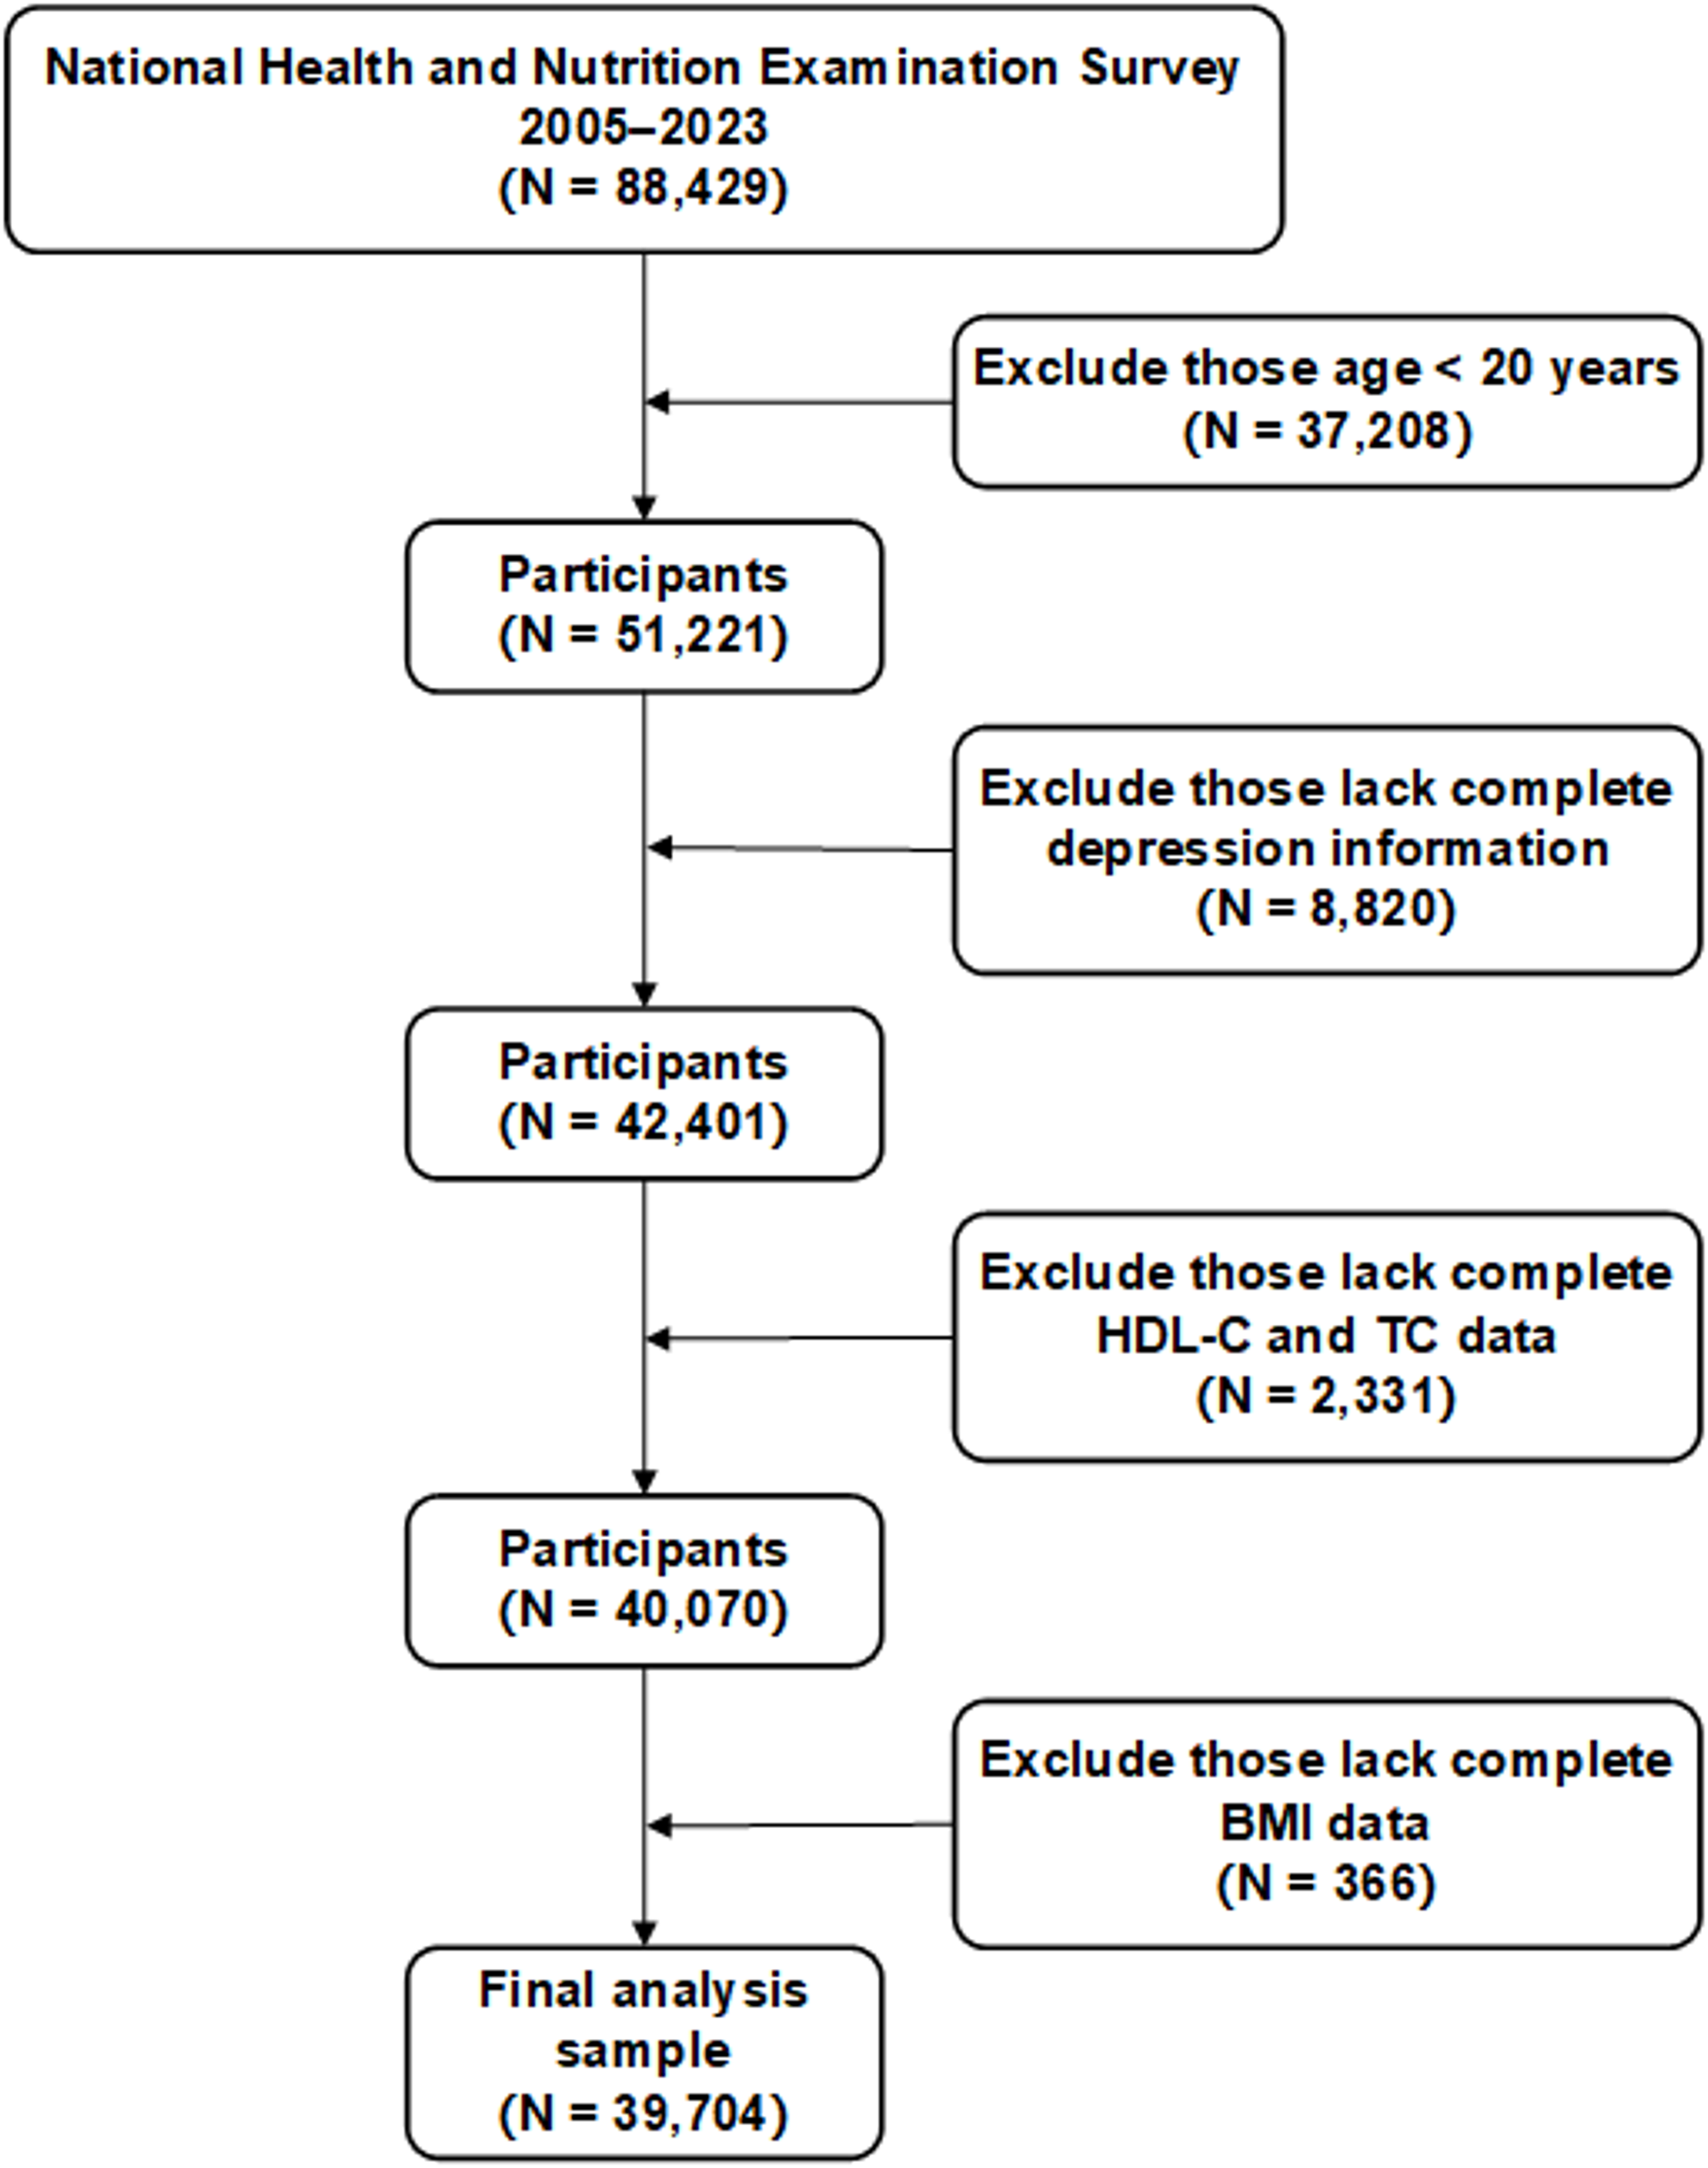
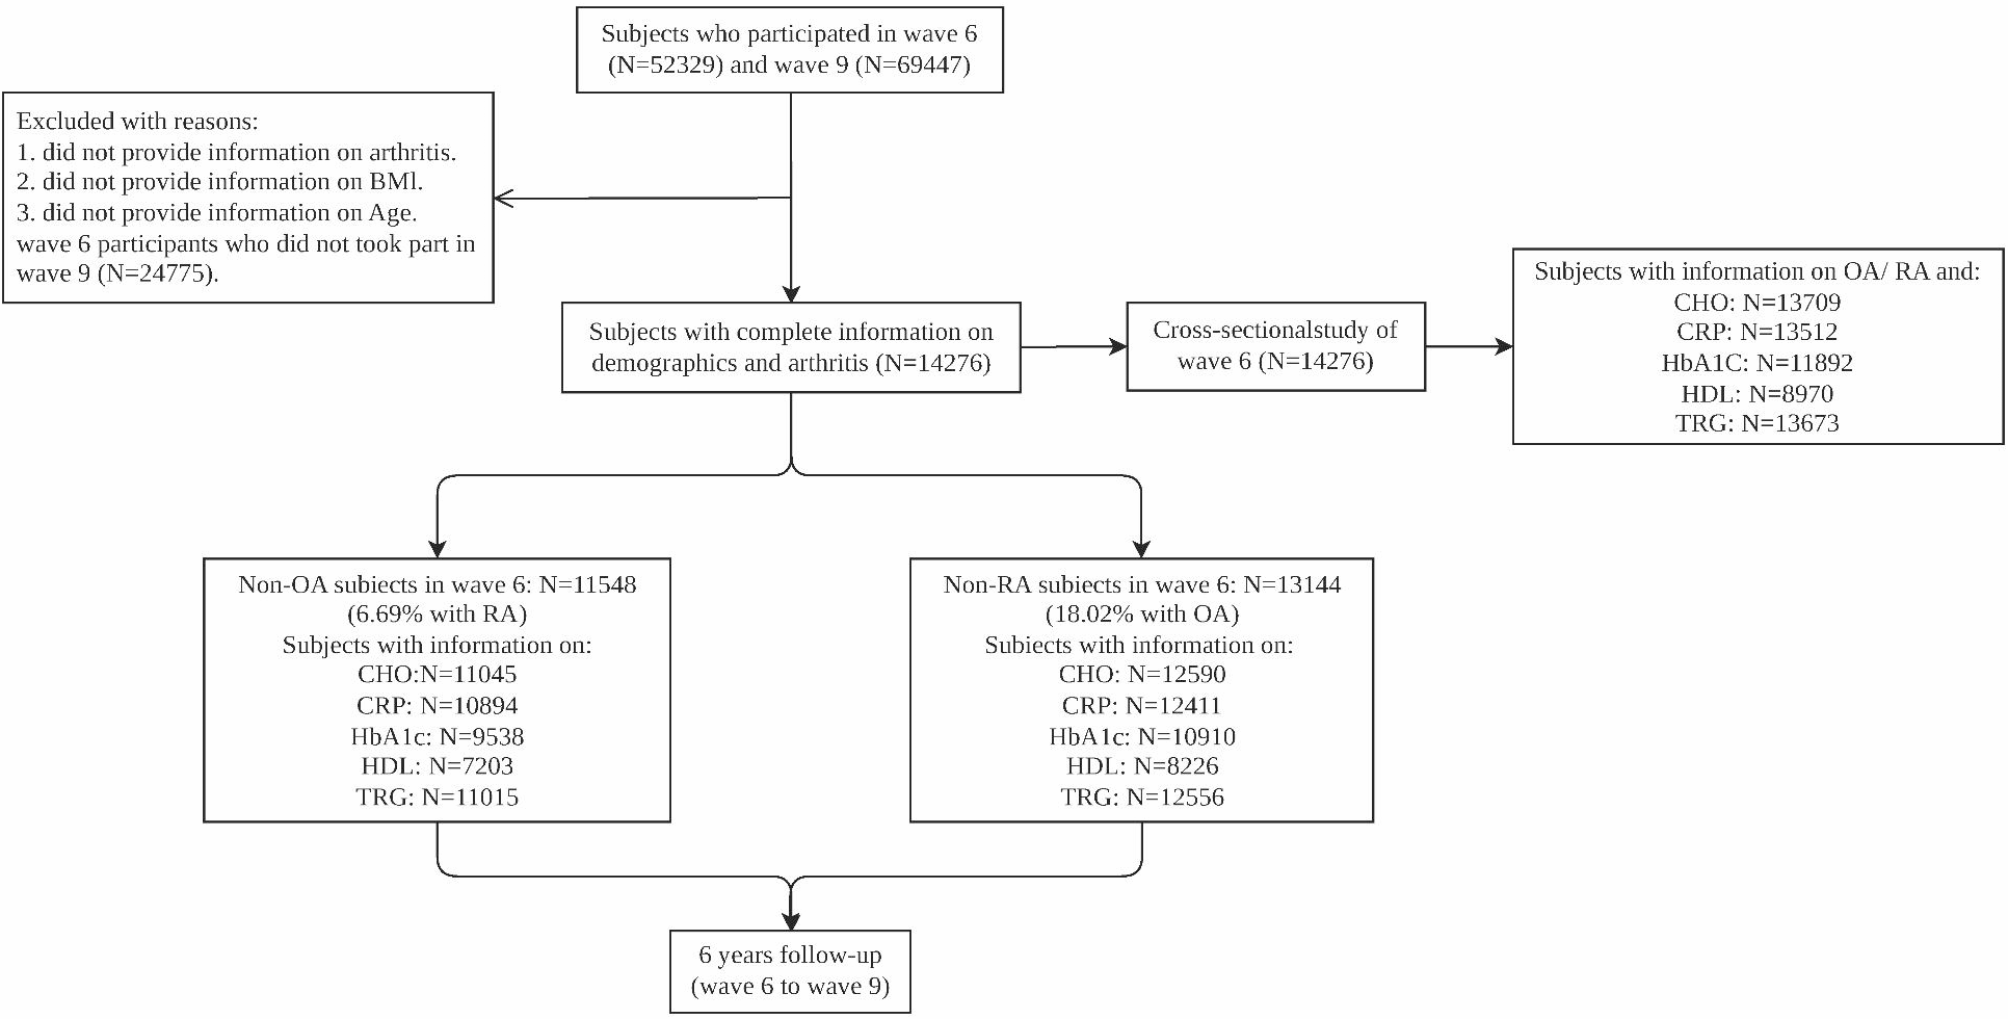
Remember me
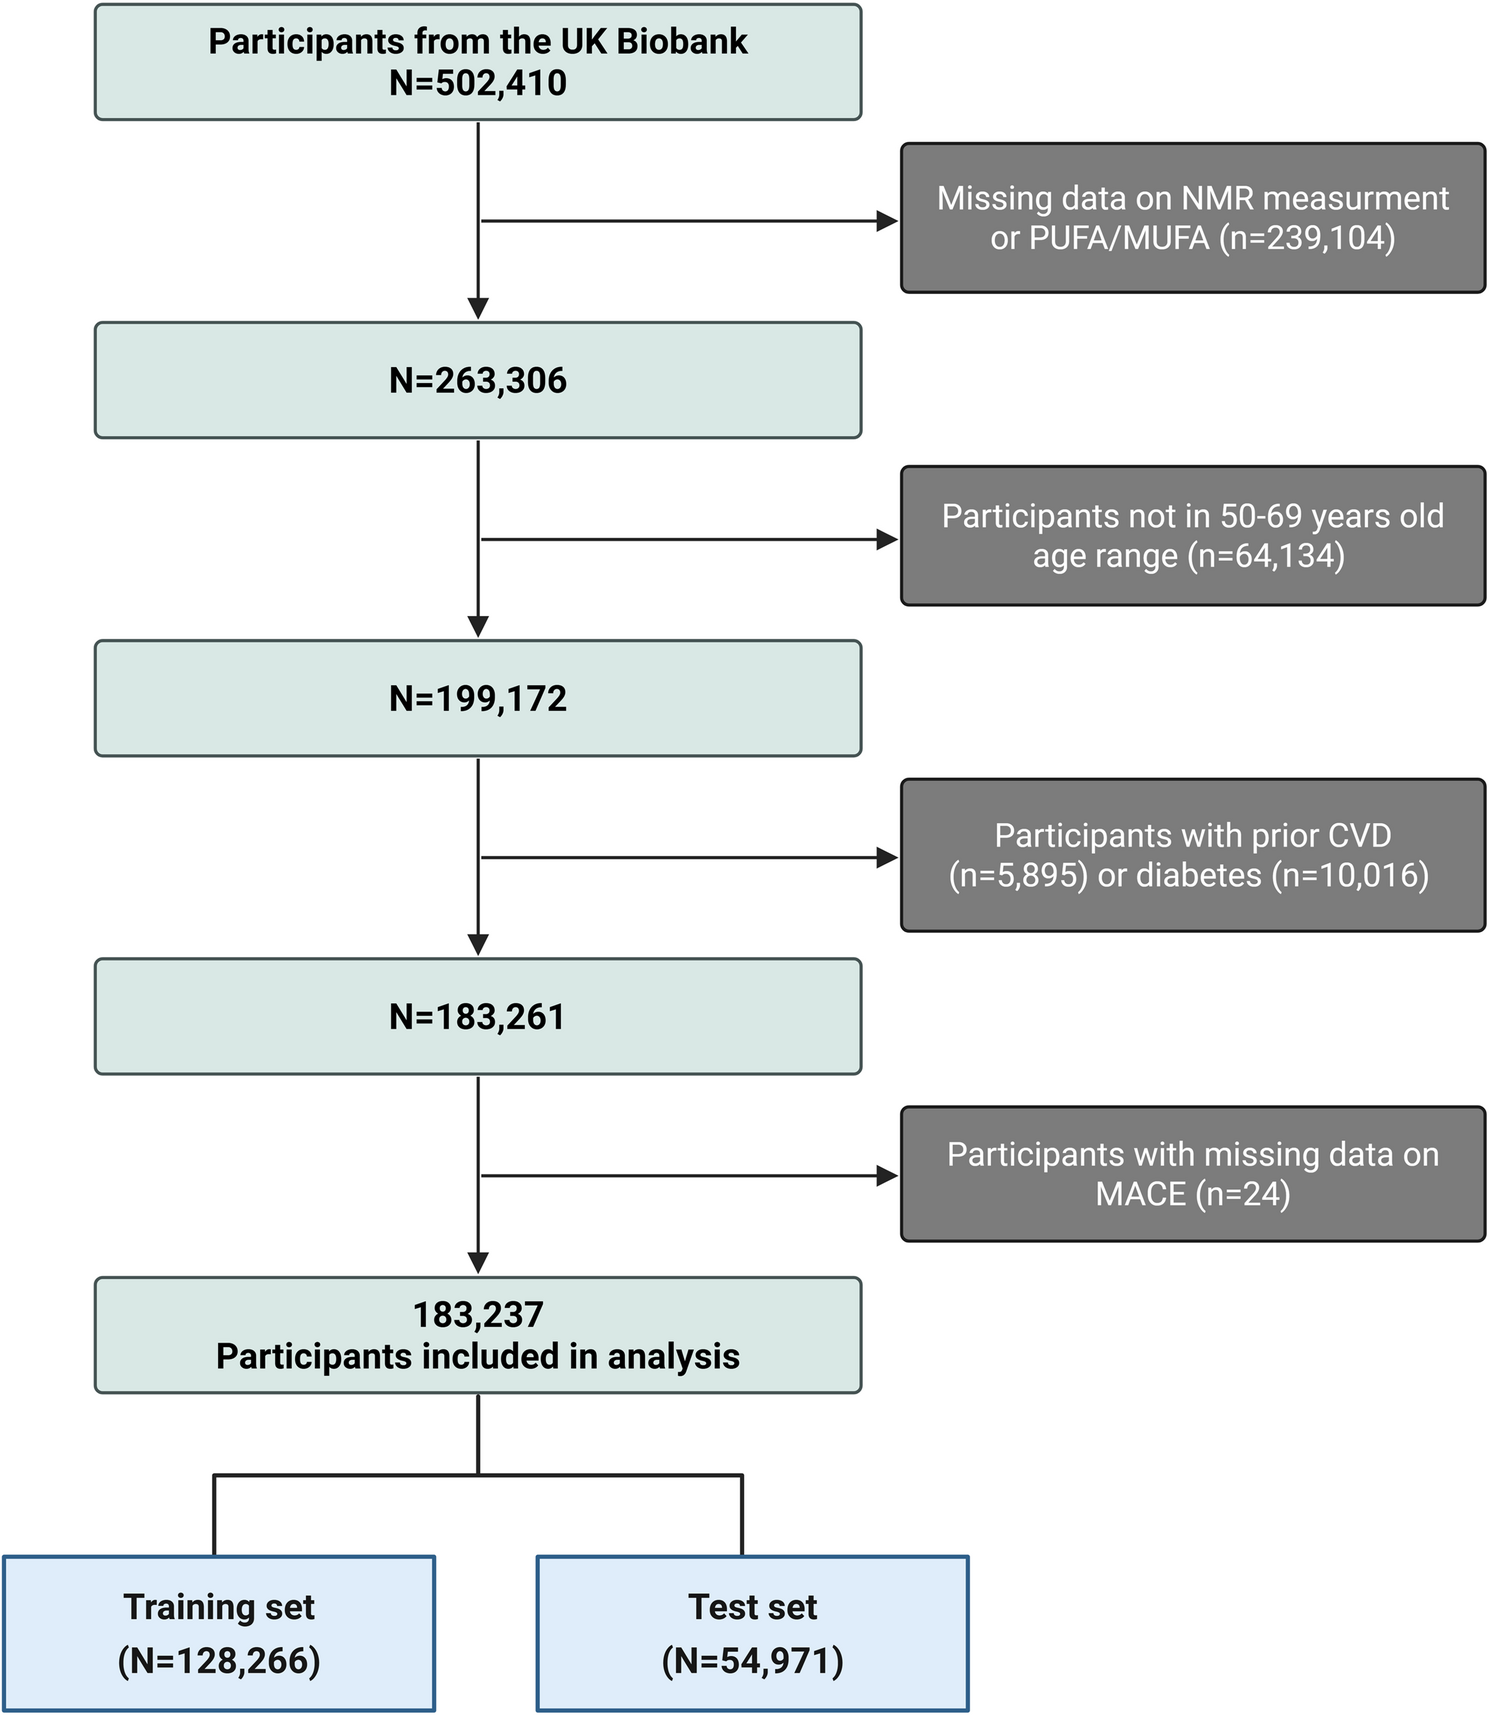


In the CHARLS cohort, during the 7-year follow-up, 1624 participants had incident CVD, including 919 females and 705 males. A total of 1232 participants experienced cardiac disease, and 536 experienced stroke. In the UK Biobank cohort, 37,744 incident CVD cases were identified during the 14.26-year median follow-up. Among these participants, 28,173 were diagnosed with ischaemic heart disease, and 11,804 were diagnosed with stroke.
Given differences in measurement conditions, cohort-specific cut-off values were derived using ROC analysis within each dataset (Fig. 2). Cut-offs were defined as the point with the minimum distance to (0,1) on the ROC curve. In CHARLS, the values were E-sdLDL-C 34.44, direct LDL-C 115.79, non-HDL-C 139.56, and TRL-C 20.27. In the UK Biobank, they were E-sdLDL-C 44.45, direct LDL-C 139.52, ApoB 105.65, non-HDL-C 166.69, and TRL-C 27.78. All values are reported in mg/dL.
Fig. 2
Optimal cut-off values of lipid-related markers for predicting cardiovascular outcomes. The optimal thresholds for lipid-related markers were determined by the minimum distance from point (0, 1) on the ROC curve. (A–D): CHARLS; (E–I): UK Biobank. Each vertical dashed line indicates the most appropriate cut-off value for corresponding biomarker
Baseline profilesThe participants’ baseline profiles were examined according to E-sdLDL-C stratification (low vs. high) in each cohort (Table 1). In the CHARLS cohort, the high E-sdLDL-C group had more females, higher BMIs, and higher lipid indices, except for HDL-C values. In the UK Biobank cohort, participants with elevated E-sdLDL-C were generally older, had increased BMI, and had adverse lipid profiles, including higher LDL-C, ApoB, non-HDL-C, and TRL-C. Notably, in the CHARLS cohort, higher prevalence of comorbidities—including hypertension and diabetes—was observed among individuals with elevated E-sdLDL-C levels. However, prevalence of hypertension and diabetes, along with the use of corresponding treatments, was lower among those with elevated E-sdLDL-C in the UK Biobank cohort. Across both populations, the proportion of cardiovascular disease events, including stroke and cardiac events, was substantially greater among participants with elevated E-sdLDL-C, compared to those with lower levels, supporting the potential role of the E-sdLDL-C level as a clinical risk indicator.
Table 1 Baseline profiles of participants categorized by elevated versus reduced E-sdLDL-C levelsAssociation of elevated E-sdldl-C with incident CVDKaplan–Meier curves demonstrated distinct differences in cumulative cardiovascular disease (CVD) incidence across lipid-related markers in both cohorts (Fig. 3). In the CHARLS cohort (panels A–D), participants with elevated E-sdLDL-C levels presented significantly greater cumulative CVD risk (log-rank P < 0.05). Similar trends were observed for non-HDL-C and TRL-C (P < 0.05), whereas direct LDL-C exhibited comparable values across the two categories (P = 0.13). In the UK Biobank cohort (panels E–I), all five markers—including E-sdLDL-C, direct LDL-C, ApoB, non-HDL-C, and TRL-C—showed strong associations with elevated cumulative CVD risk among participants with higher E-sdLDL-C concentrations, supported by log-rank significance P values below 0.0001 across all comparisons. These results were subsequently validated in terms of the risk of cardiac events and stroke separately (Figs. 4 and 5).
Fig. 3
Kaplan–Meier curves for cumulative cardiovascular disease incidence by lipid-related markers across CHARLS and UK Biobank cohorts (A–D): CHARLS cohort; (E–I): UK Biobank. High vs. low groups were defined according to cut-off values specific to each lipid marker
Fig. 4
Kaplan–Meier curves for the cumulative incidence of cardiac disease by lipid indices in the CHARLS and UK Biobank cohorts (A–D): CHARLS cohort; (E–I): UK Biobank cohort. High vs. low groups were defined according to cut-off values specific to each lipid marker
Fig. 5
Kaplan–Meier curves for the cumulative incidence of stroke by lipid indices in the CHARLS and UK Biobank cohorts (A–D) CHARLS cohort; (E–I) UK Biobank cohort. High vs. low groups were defined according to cut-off values specific to each lipid marker
The Cox models revealed a significant association between elevated E-sdLDL-C and CVD outcomes in both CHARLS and UK Biobank cohorts (Table 2). In the CHARLS cohort, the multivariable-adjusted hazard ratios (HRs) for high vs. low E-sdLDL-C were 1.30 (95% CI 1.18–1.44) in model 1, 1.22 (95% CI 1.10–1.35) in model 2, and 1.21 (95% CI 1.09–1.34) in model 3. The association with stroke remained significant across all the models (model 3 h 1.42; 95% CI 1.17–1.71; P < 0.001), whereas no significant association was observed for cardiac events after full adjustment (HR 1.10; 95% CI 0.98–1.24; P = 0.110) (Table 2). In the UK Biobank cohort, individuals with elevated E-sdLDL-C consistently demonstrated elevated risk for CVD, cardiac outcomes, as well as stroke. The HRs were 1.24 (1.21–1.27) for CVD, 1.29 (1.26–1.33) for cardiac events, and 1.09 (1.04–1.14) for stroke in model 3.
Table 2 Association between E-sdLDL-C and cardiovascular outcomesTo further evaluate the independent prognostic utility of E-sdLDL-C, additional models were constructed by incorporating each traditional lipid parameter (LDL-C, non-HDL-C, TRL-C, or ApoB) into model 3 (Table 3). In both cohorts, the associations between E-sdLDL-C and CVD remained statistically significant after these adjustments, although the effect sizes were slightly attenuated (HRs ranging from 1.08 to 1.30).
Table 3 Relationship of E-sdLDL-C with cardiovascular risk after additional adjustment for traditional lipid markersEach lipid parameter was also evaluated in a separate model containing the same covariates to allow direct comparison of their predictive strength (Table 4). E-sdLDL-C had the highest hazard ratio for CVD risk among all the lipid markers in both cohorts, indicating that E-sdLDL-C outperformed traditional lipid markers in terms of predictive value.
Table 4 Association between individual lipid markers and cardiovascular riskSubgroup analysesSubgroup evaluations were conducted to evaluate the stability of the association between E-sdLDL-C concentrations with CVD within different strata (Table 5). In the CHARLS cohort, a stronger association was observed among male participants (HR 1.35; 95% CI 1.15–1.59; P < 0.001) than in female participants (HR 1.08; 95% CI 0.94–1.24; P = 0.29), with a statistically significant interaction (P for interaction = 0.042). In the UK Biobank cohort, similar trends were observed, where risk estimates were HR: 1.26 (95% CI 1.22–1.30) in men and HR: 1.19 (95% CI 1.14–1.24) in women, with both P < 0.001 and an interaction P value of 0.02. After age stratification, the association remained significant across age groups, with a stronger effect size observed in younger participants in the UK Biobank cohort (HR: 1.40 for age < 60 vs. 1.15 for age ≥ 60; P for interaction < 0.001), while the CHARLS cohort showed no significant interaction (P for interaction = 0.549). Subgroup analyses by hypertension, diabetes, and cholesterol-lowering medication use showed consistent associations, with no significant interactions observed in the CHARLS cohort. However, significant interactions were noted for hypertension status in the UK Biobank cohort (P for interaction < 0.001), where the relationship was slightly stronger in those without hypertension (HR 1.29) than in those with hypertension (HR 1.14).
Table 5 Subgroup analysis of the associations between E-sdLDL-C and cardiovascular events in the CHARLS and UK biobank cohortsIncremental predictive value of E-sdldl-C over conventional lipid parametersModel performance was evaluated using Harrell’s C-index and continuous net reclassification improvement (NRI) in both cohorts (Table 6). In the UK Biobank, adding E-sdLDL-C to the model significantly improved C-index for CVD (0.689 to 0.692), cardiac events (0.698 to 0.703), and stroke (0.680 to 0.680), all P < 0.001. Continuous NRI further supported the incremental value of E-sdLDL-C, with significant improvement for CVD (15.29%, 95% CI 13.93–16.56), cardiac events (17.65%, 95% CI 16.13–19.10), and stroke (6.61%, 95% CI 4.48–8.90); all P < 0.001. In comparison, direct LDL-C and TRL-C showed minimal or inconsistent improvement in C-index and NRI, while ApoB demonstrated modest predictive value, generally lower than that of E-sdLDL-C.
Table 6 Comparison of C-index and net reclassification improvement (NRI) for E-sdLDL-C and conventional lipid parametersSimilar patterns were observed in CHARLS, where E-sdLDL-C modestly improved C-index for CVD (0.632 to 0.633, P = 0.046), with no significant changes for cardiac disease or stroke. Continuous NRI remained positive for all outcomes, particularly for stroke (16.49%, 95% CI 7.27–25.6, P < 0.001). In contrast, conventional lipid markers provided limited or no improvement in model performance. These findings indicate that E-sdLDL-C offers incremental predictive value beyond traditional lipids in cardiovascular risk stratification.
Sensitivity analysisCross-classification modelsAs a sensitivity analysis, cross-classification of E-sdLDL-C and traditional lipid indices (direct LDL-C, non-HDL-C, and TRL-C) was conducted by categorizing them into four groups based on high/low levels, with the low/low group used as the reference. The joint associations of E-sdLDL-C and conventional lipid indexes with incident CVD were explored by four-category classification (Table 7). In both two cohorts, participants with concurrently increased E-sdLDL-C and conventional lipid levels presented the highest CVD risk compared with participants presenting simultaneously low levels.
Table 7 Joint associations of E-sdLDL-C and conventional lipid parameters with cardiovascular risk in the CHARLS and UK biobank cohortsIn the CHARLS cohort, CVD risk was notably higher among individuals exhibiting high E-sdLDL-C alongside reduced LDL-C, as well as in those with elevated E-sdLDL-C and low TRL-C. In contrast, elevated traditional lipid levels in the context of low E-sdLDL-C were unrelated to significant risk increases, highlighting the potentially greater predictive contribution of E-sdLDL-C in this population.
In the UK Biobank cohort, a consistent increasing trend in hazard ratios was observed across the four groups. The greatest risk appeared in individuals with both high E-sdLDL-C and elevated conventional lipids, followed by those with high E-sdLDL-C but low levels of traditional lipids, and then by participants with low E-sdLDL-C but increased conventional lipid concentrations, compared with the reference group (low E-sdLDL-C/low conventional lipid). This pattern was observed across all lipid strata, indicating that elevated E-sdLDL-C may confer a greater cardiovascular risk than elevated levels of traditional lipid markers alone.
Quartile-based analysisParticipants were stratified into quartiles according to E-sdLDL-C concentrations or subsequent analysis, as detailed below: CHARLS: Q1 (< 26.97 mg/dL), Q2 (26.97–34.44 mg/dL), Q3 (34.44–43.36 mg/dL), and Q4 (≥ 43.36 mg/dL); UK Biobank: Q1 (< 34.58 mg/dL), Q2 (34.58–43.55 mg/dL), Q3 (43.55–54.00 mg/dL), and Q4 (≥ 54.00 mg/dL). The results derived from E-sdLDL-C concentration quartiles were consistent with the main findings. A distinct stepwise pattern was evident in the UK Biobank cohort (Fig. 6), showing substantially increased CVD incidence in those with elevated E-sdLDL-C concentrations compared to individuals in the lower quartiles (log-rank P < 0.0001) (panels D–F). In the CHARLS cohort, although the trend was generally consistent, separation was observed mainly between the highest quartiles (Q3 and Q4) and the lowest quartiles (Q1) (panels A–C).
Fig. 6
Kaplan-Meier curves for the cumulative incidence of cardiovascular outcomes across E-sdLDL-C quartiles. Panels A–C: CHARLS; panels D–F: UK Biobank. A and D: Cardiovascular disease; B and E: cardiac disease; C and F: stroke. E-sdLDL-C was categorized into quartiles (Q1–Q4)
Using multivariable Cox regression models with adjustment for covariates defined in model 3 (Table 8), it was observed that, in the CHARLS cohort, hazard ratios for CVD and stroke were significantly greater in Q3 and Q4 than in Q1, whereas no significant associations were found for cardiac diseases across quartiles. In the UK Biobank cohort, hazard ratios generally increased with higher quartiles, and significant associations were observed for Q3 and Q4 for most outcomes. For ischaemic heart disease, no significant association was found in Q2 compared with Q1. These findings remained generally in accordance with the initial results, supporting the stability of the observed associations.
Table 8 Association between E-sdLDL-C quartiles and the risk of cardiovascular outcomes in the CHARLS and UK biobank cohortsRestricted cubic spline (RCS) modelsThe P-spline curve was plotted to evaluate potential nonlinear associations between E-sdLDL-C and CVD outcomes via restricted cubic spline regression analyses, with covariable adjustments according to model 3 specifications (Fig. 7). In the CHARLS cohort, the association between E-sdLDL-C and CVD (panel A) showed a significant nonlinear pattern (P for nonlinearity = 0.003), with the highest HR observed at approximately 45 mg/dL, followed by a decline at higher concentrations; however, the confidence intervals were wide in the higher range. No significant associations were found for cardiac diseases (panel B) (P for overall = 0.066). For stroke (panel C), a nonlinear trend emerged (P for nonlinearity = 0.032), with HRs increasing with increasing E-sdLDL-C. In the UK Biobank cohort, E-sdLDL-C showed a positive correlation with CVD (panel D), exhibiting a significant nonlinear association (P for nonlinearity = 0.023), with the risk rising steadily across the exposure range. For cardiac diseases (panel E), a significant overall association was observed (P < 0.001), but the trend was linear (P for nonlinearity = 0.127). A comparable linear relationship was observed for stroke (panel F) (P for nonlinearity = 0.567). The results further support the consistent relationship between E-sdLDL-C and CVD across populations and analytic strategies.
Fig. 7
Restricted cubic spline regression curves for the associations between E-sdLDL-C levels and cardiovascular outcomes. Panels A–C: CHARLS; panels D–F: UK Biobank. A and D: Cardiovascular disease; B and E: cardiac disease; C and F: stroke. The models were adjusted for covariates in model 3 and incorporated four knots positioned at the 5th, 35th, 65th, and 95th values of E-sdLDL-C distribution, using the lowest value as reference. Solid lines represent HRs, and shaded areas represent 95% CI
Sensitivity analysis using NMR-measured sdldl-CIn the UK Biobank, a subset of participants (n = 179,315) had available data on sdLDL-C measured by nuclear magnetic resonance (NMR) spectroscopy, referred to as “Cholesterol in Small LDL”. As a sensitivity analysis, NMR-measured sdLDL-C was evaluated using a cohort-specific cutoff of 7.15 mg/dL derived from ROC analysis. Kaplan-Meier curves demonstrated significantly higher cumulative incidence of CVD and cardiac disease among participants with elevated NMR-measured sdLDL-C (log-rank P < 0.001). For stroke, the log-rank P value was 0.18, indicating a less distinct separation (Fig. 8). In Cox regression analyses adjusted according to model 3, elevated NMR-measured sdLDL-C was significantly associated with increased risk of cardiovascular disease (HR 1.25; 95% CI 1.21–1.29), cardiac disease (HR 1.29; 95% CI 1.24–1.34), and stroke (HR 1.12; 95% CI 1.05–1.18), with P values below 0.001 (Table 9). These results are consistent with the main analysis based on estimated sdLDL-C, indicating that the observed associations are not dependent on the method of sdLDL-C quantification.
Table 9 Association of NMR-measured sdLDL-C with risk of cardiovascular disease, cardiac disease, and stroke in the UK biobank cohortFig. 8
Kaplan–Meier curves for cumulative incidence of cardiovascular disease, cardiac disease, and stroke according to NMR-measured sdLDL-C levels in the UK Biobank High vs. low groups were defined according to a cut-off of 7.15 mg/dL for NMR-measured sdLDL-C (Cholesterol in Small LDL). A: Cardiovascular disease; B: cardiac disease; C: stroke
Comments (0)