The animal experiments in this study were conducted in accordance with the Guidelines for the Care and Use of Laboratory Animals and were approved by the Animal Care and Use Committee of Guangxi University of Chinese Medicine (Ethical Approval No. DW20220609-69). All animal procedures complied with the European Parliament’s Directive on the Protection of Animals Used for Scientific Purposes. Rats in the first, second, and third stages were euthanized at the end of the experiment following anesthesia and blood collection, which was performed via abdominal aorta puncture, in order to obtain heart, hippocampal tissues, and blood samples. Anesthesia was induced by intraperitoneal injection of 0.3% sodium pentobarbital (50 mg/kg), and euthanasia was performed by tail vein injection of 3% sodium pentobarbital (150 mg/kg). After euthanasia, death was confirmed by the absence of cardiac activity. The entire euthanasia process was conducted under the supervision of the Animal Ethics Committee of the Guangxi University of Chinese Medicine.
Experimental animals
100 Six-week-old healthy male Sprague–Dawley rats, weighing 220 ± 30 g, were sourced from Hunan Slack Jingda Experimental Animal Co., Ltd (Building 1, Room 101, Hunan Science and Technology Achievement Transformation Center, Longping Hi-Tech Park, Changsha High-Tech Development Zone, Hunan Province, China). The rats were specific-pathogen-free grade and housed under a 12/12-h light/dark cycle with ad libitum access to water and food at the Experimental Animal Center of Guangxi University of Traditional Chinese Medicine (No. 13 Wuhe Avenue, Nanning, Guangxi, China).
Establishment of rats with CHDWD
The disease model was induced in rats through a high-fat diet and chronic unpredictable mild stress (CUMS) interventions to emulate the clinical characteristics of patients with CHDWD, which often included hyperlipidemia [8,9,10]. The diet consisted of 5% lard, 2% cholesterol, 0.2% bile salts, 20% sucrose, and 72.8% base feed. The CUMS regimen encompassed several stressors applied regularly over 6 weeks, including food deprivation, cold water swimming, white noise exposure, water deprivation, damp bedding, restraint, cage shaking, tail pain stimulation, cage tilt, and light/dark cycle reversal. Coronary artery ligation surgery was performed from the third week following the established methods [11, 12]. The control group received a base diet and underwent a sham operation. The control group initially consisted of 15 rats, with 12 remaining at the end of the experiment and 10 ultimately included in the statistical analysis after outlier exclusion. The disease group initially had 25 rats, of which 15 completed the experiment and 10 were included in the statistical analysis following the exclusion of outliers.
Model establishment success evaluation scheme
The success of the CHDMD rat model was evaluated based on three criteria: ECG readings, behavioral assessments, and myocardial enzyme levels. The model was considered successfully established if the following conditions were met: ECG showed ischemic changes, such as T wave inversion, ST-segment elevation, or pathological Q waves; behavioral tests indicated depressive-like behaviors or states; and the levels of all three myocardial enzymes—lactate dehydrogenase (LDH), creatine kinase (CK), and CK-MB—were elevated.
Electrocardiogram
After an intraperitoneal injection of sodium pentobarbital for anesthesia, the hair on the rats’ left and right forelimbs, left and right hindlimbs, and left precordial area was shaved. The rats were fixed on an operation board, with the LL lead connected to the left hind limb, RL lead to the right hindlimb, RA lead to the right forelimb, LA lead to the left forelimb, and V lead to the precordial area. Electrocardiogram (ECG) was recorded for 1 min.
Animal behavior
Open field test: The open field test was conducted using a rat open field test box, and the ANY-maze behavioral analysis system was used to measure the total distance traveled, number of rearing events, and grooming episodes within specific areas over a set period. The specific method was performed as previously described [13]. These measures reflect the degree of depression in rats; deeper depression correlates with shorter total distance moved and fewer rearing and grooming behaviors.
Elevated plus maze test: The rats were assessed using an elevated plus maze and the ANY-maze system to measure the number of entries into the open arms and the time spent in the open arms, following the method described by Bertoglio and Carobrez [14]. Higher levels of depression were correlated with fewer open arm entries and shorter time spent in the open arms.
Forced swim test: The rats were assessed in a forced swim cylinder using the ANY-maze system to measure the total immobility time and number of dives, following the method described by Shoji and Miyakawa [15]. Higher levels of depression were correlated with longer immobility times and fewer dives.
Myocardial enzymes
LDH, CK, and CK-MB levels were measured using kits from Nanjing Jiancheng Bioengineering Institute, China. The absorbance of each well was measured using a microplate reader to determine LDH level. CK level was determined using absorbance measurements from an ultraviolet-visible spectrophotometer and a standard curve provided with the kit. CK-MB level was determined based on absorbance measurements before and after a 3-min 37 °C incubation.
Serum lipid analysis
Serum levels of total cholesterol (TC), triglycerides (TGs), high-density lipoprotein (HDL), and low-density lipoprotein (LDL) were quantified using kits from the same institute, and absorbance was measured to calculate the respective levels.
Hematoxylin and eosin (H&E) staining
Heart tissues were fixed, sectioned, and stained with H&E to evaluate myocardial cell structure.
Fecal sample collection
Feces from eight CHDWD model rats and eight healthy rats were collected, mixed, and placed in sterile tubes. The feces were diluted with sterile saline (feces: saline = 1:10), homogenized for 5 min, vortexed for 1 min, and centrifuged at 800–1200 revolutions per minute at 4 °C for 3 min. The supernatant was collected, and the bacterial content (expressed as AVS abundance) was 56,282. The supernatant was stored at − 20 °C.
Microbiota transplantation
Fecal microbiota transplantation (FMT) was performed according to the methods described by García-Lezana et al. [16] and Zhang et al. [17]. To facilitate the successful recolonization of the transplanted gut microbiota, the rats were administered omeprazole (50 mg/kg/day) by gavage for 3 d prior to transplantation to clear the gut. Then, 24 and 12 h before FMT, the rats were administered 1 mL and 2 mL of CitraFleet and 1 mL of pure water, respectively, to empty the intestines (specific composition according to Zhang et al.) [17]. As it has been reported that a single microbiota transplantation could last for at least 1–3 months, with evident effects after 1 month [18], we gavaged for 6 weeks to ensure repeated recolonization (10 mL/kg/day). Rats receiving autologous fecal gavage were used as controls (FMT-Normal group), A total of 10 rats were used, and 7 were included in the statistical analysis after excluding outliers). Rats receiving CHDWD rat feces (AVS abundance of 57361) were used as the experimental animals (FMT-Disease group). A total of 10 rats were used, of which 7 were included in the statistical analysis after excluding outliers. To investigate the association between the TLR4/MYD88/NF-κB pathway and CHDWD, CHDWD rats that had received fecal gavage and TAK-242 injection (3 mg/kg/day for 4 weeks) were included (FMT-Disease-TAK-242 group). A total of 10 rats were used, of which 7 were included in the statistical analysis after excluding outliers. In another group, diseased rats that received TAK-242 injection only (3 mg/kg/day for 4 weeks) were include (designated as the Disease + TAK-242 group). A total of 10 rats were used, of which 7 were included in the statistical analysis after excluding outliers; animals in the FMT-Disease and Disease groups served as controls. To study the therapeutic effects of long-term FMT in healthy rats, feces were collected from eight healthy rats and recolonization was repeated by gavage for 6 weeks. Animals in the Disease + Disease FMT group (control group; a total of 10 rats were used, of which 7 were included in the statistical analysis after excluding outliers) received autologous fecal microbiota (AVS abundance, 55686) transplantation, whereas animals in the Disease + Normal FMT group (a total of 10 rats were used, of which 7 were included in the statistical analysis after excluding outliers) received fecal microbiota from healthy rats (AVS abundance, 57361).
Enzyme-linked immunosorbent assay detection
Enzyme-linked immunosorbent assay kits (Wuhan Boster Biological Technology, China) were used for detecting the molecules. The standards were diluted to six concentrations and added to the plates, with each concentration in duplicates. The serum samples were added to duplicate wells. The corresponding reagents were added to each well, gently mixed, incubated, washed, and developed. Following this, the stop solution was added to wells, and absorbance was measured using a multifunctional microplate reader (UV-1100 from the Manufacturer Shanghai Meipuda Co., Ltd.)to estimate the concentration.
Quantitative reverse transcription polymerase chain reaction (PCR)
Heart and hippocampal tissues were minced and lysed to extract the RNA. Then, RNA concentration and purity were evaluated, and the RNA was reverse-transcribed into cDNA. Real-time quantitative PCR was performed using glyceraldehyde 3-phosphate dehydrogenase as the reference gene. Primers for TLR4, MYD88, NF-κBp65, inhibitory kappa B kinase (IKK)-β, tumor necrosis factor (TNF)-α, and nuclear factor of kappa light polypeptide gene enhancer in B-cells inhibitor alpha (IκB-α) were designed and synthesized by Tianyi Huayu Gene Technology Co., Ltd. (Wuhan, China). Each sample was tested in triplicate, and the average value was used for relative quantification analysis using the 2−△△Ct method.
Western blotting
Heart and hippocampal tissues were minced and lysed to extract proteins. The proteins were quantified using a microplate reader (Batch No.: PC0020, Manufacturer: Solarbio). The proteins were separated using sodium dodecyl sulfate-polyacrylamide gel electrophoresis and transferred onto polyvinylidene fluoride membranes (Batch No.: IPVH00010, Manufacturer: millipore). The membranes were blocked with non-fat milk and probed overnight with primary antibodies (TLR4, MYD88, NF-κBp65, IKKβ, TNF-α, and IκB-α) at 4 °C. The membranes were then incubated with secondary antibodies for 2 h at 22 °C (± 2 °C). Protein bands were visualized using ECL chemiluminescence reagents (Biosharp, Hefei, Anhui Province, China) and imaged. Band intensity was analyzed using the TANONGIS software (Tanon Life Science, Shanghai, China) to assess target gene expression.
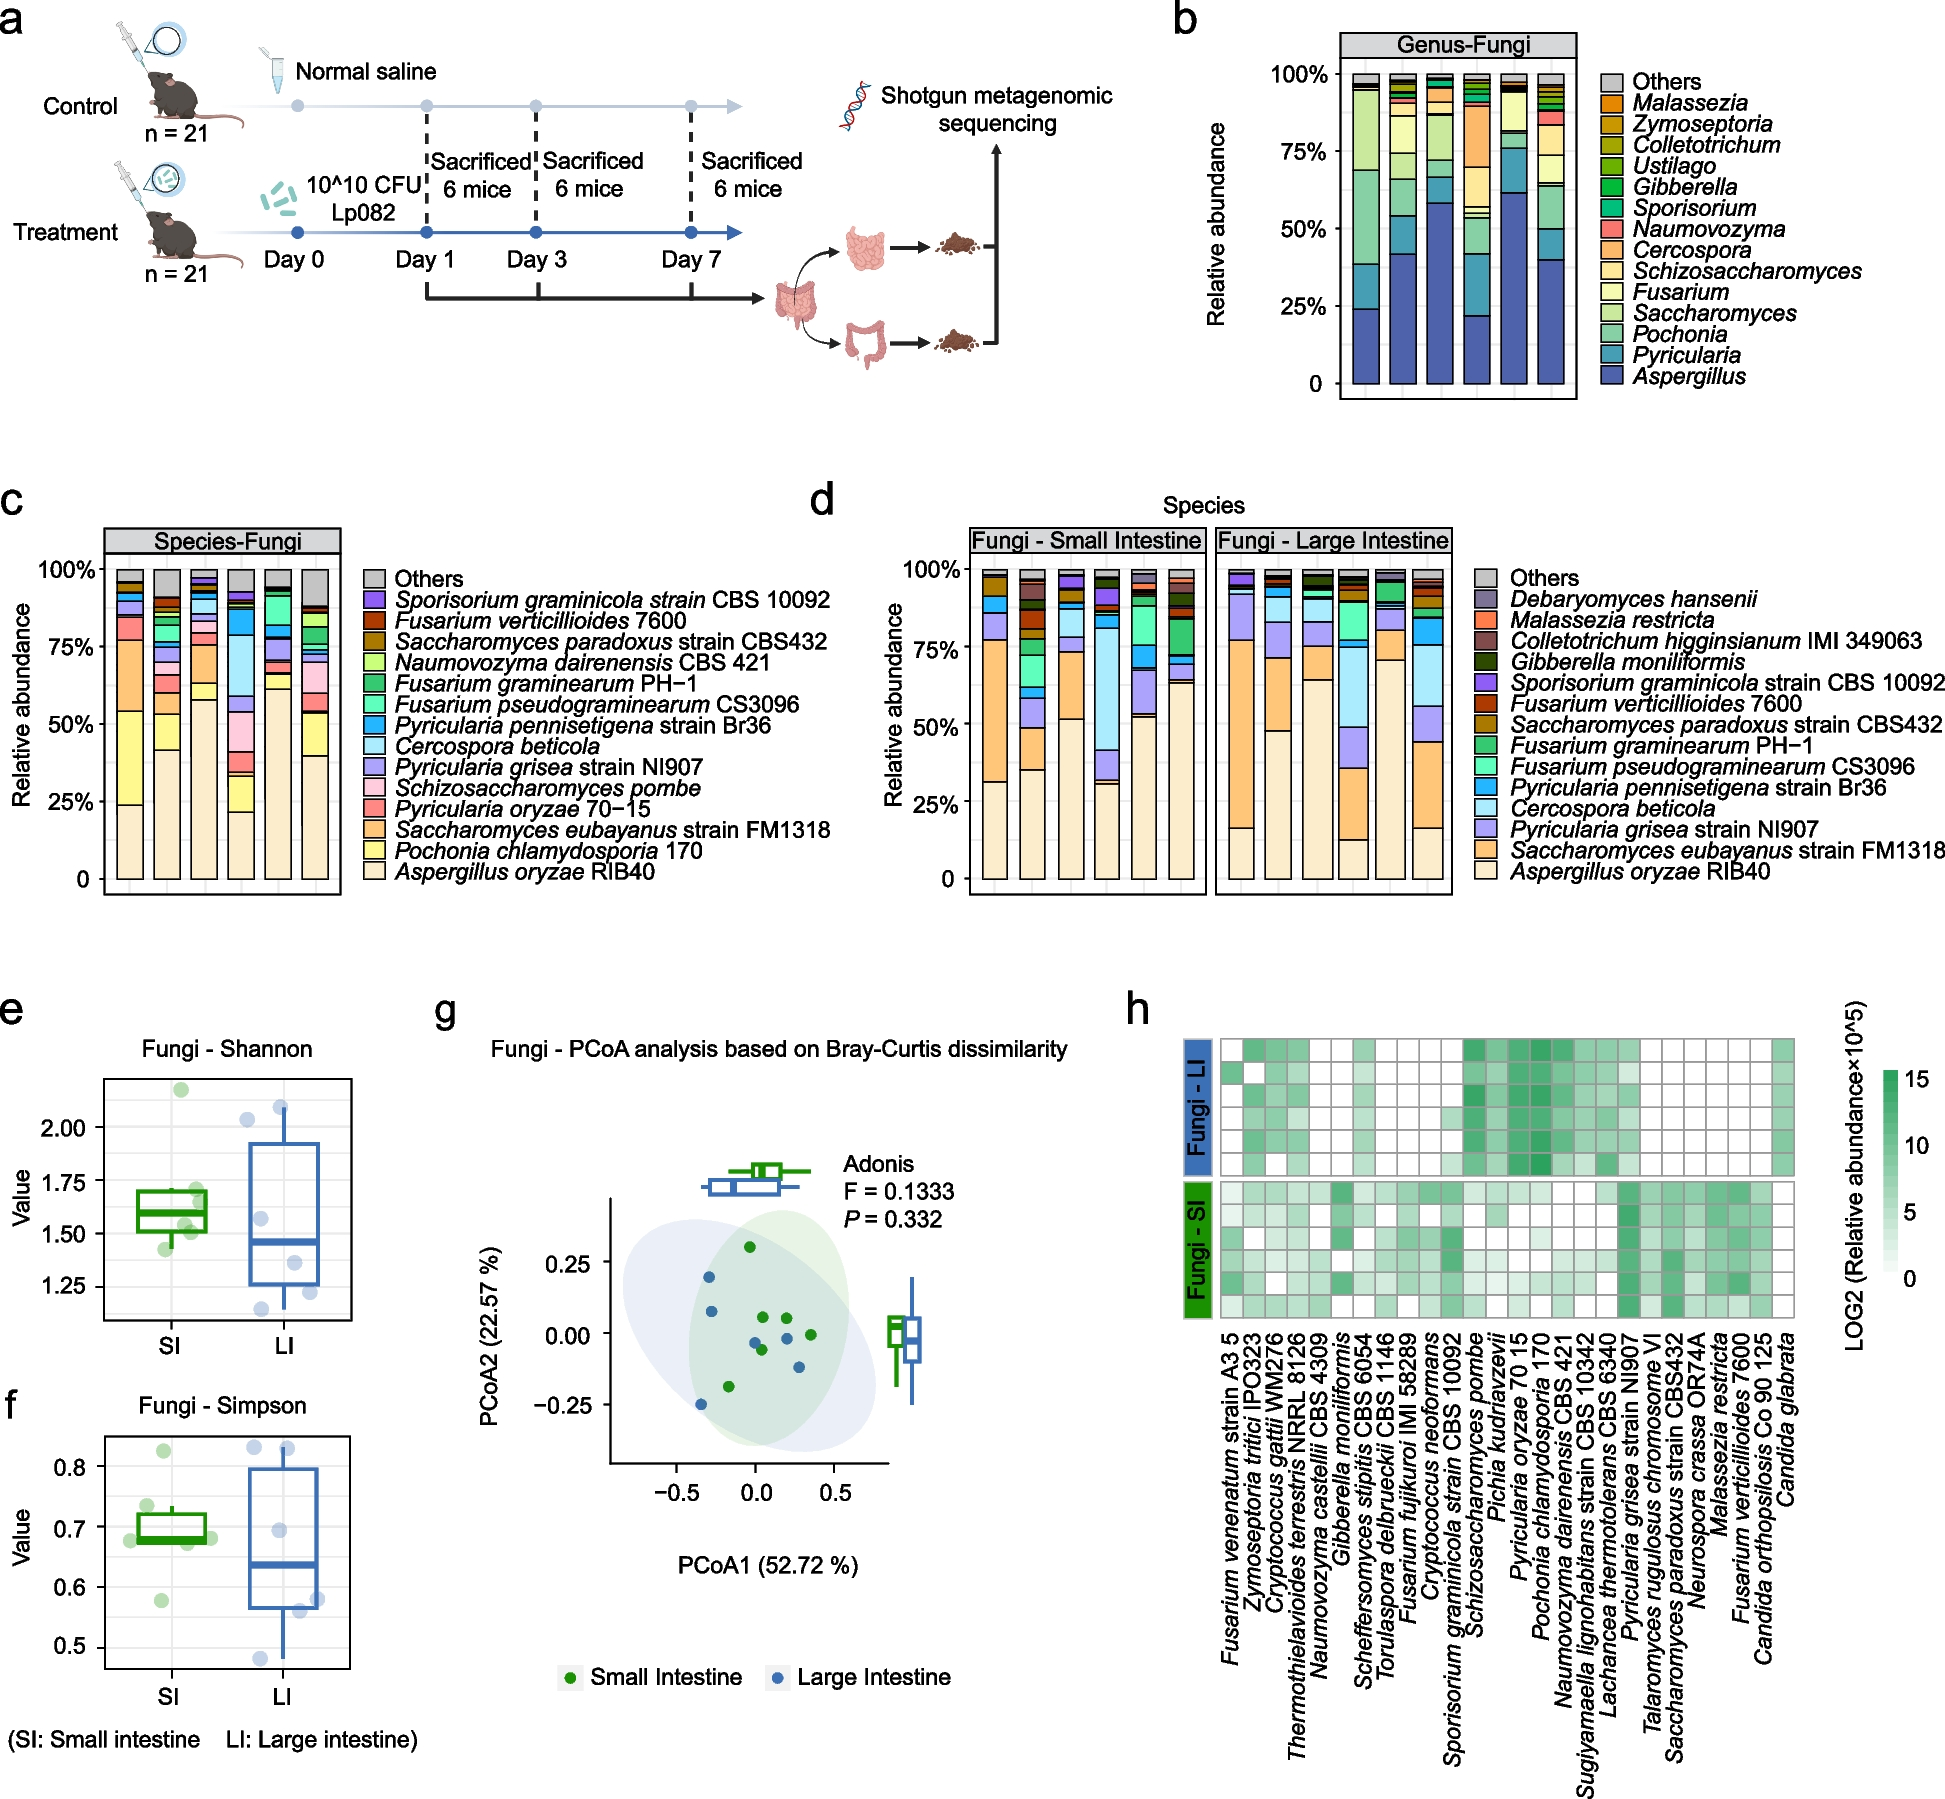
16 S ribosomal ribonucleic acid high-throughput sequencing
Genomic DNA was extracted from rat feces using a MagPure Soil DNA KF Kit (Magen, China). The extracted DNA was analyzed using agarose gel electrophoresis. The V3–V4 region of the 16 S ribosomal ribonucleic acid (rRNA) gene was amplified using specific primers (343 F, 798R) and barcoding tags. The first round of PCR was performed using the Tks Gflex DNA polymerase (Takara, Japan). The amplicons were purified using magnetic beads, and the purified products were used as templates for the second round of PCR. The second PCR product was identified by electrophoresis and purified using magnetic beads. The purified products were quantified using Qubit. Sequencing was performed using an Illumina NovaSeq 6000 platform (OE Biotech Co., Ltd., Shanghai, China). Sequencing data were stored in the FASTQ format.
Bioinformatic analysis
Cutadapt was used to import FASTQ files; denoise, merge, and remove chimeric sequences; and perform quality control analysis to generate the ASV abundance tables. R was used with the QIIME 2 package for microbiota composition analysis at the phylum and genus levels and identification of dominant bacterial groups. The Silva database (version 138) was used for taxonomic classification using the q2-feature-classifier software. Alpha diversity differences between samples were compared using QIIME 2, and beta diversity was assessed using principal coordinates analysis (PCoA) based on unweighted UniFrac distance matrices calculated using R 4.0.4 (R Foundation for Statistical Computing, Vienna, Austria). Differential analysis was performed using analysis of variance (ANOVA), Kruskal–Wallis test, t-test, and Wilcoxon test based on R packages.
Statistical analyses
IBM SPSS Statistics for Windows version 20.0 (IBM Corp., Armonk, NY, USA) was used for the analysis, and the Origin 2021 software was used for plotting graphs. Data are presented as mean ± standard deviation for normally distributed data with homogeneity of variance, and comparisons between two groups were made using t-tests. A one-way ANOVA was used for multiple group comparisons. Data that were not normally distributed or had heterogeneity of variance are presented as medians (interquartile ranges) and analyzed using the Wilcoxon signed-rank test for two-group comparisons and the Kruskal–Wallis test for multiple group comparisons. Statistical significance was set at p < 0.05, with p < 0.01 indicating significant statistical differences.


Comments (0)