
Remember me


Out of nineteen isolated samples, 15 samples gave identification on MRS selective media as white-smooth-mucoid rod-shaped colonies, small-white-smooth long chains of cocci and circular-white-smooth opaque colonies with entire margins and convex elevation existing in pairs respectively and gram-positive staining when has been applied for microscopic examination. Biochemical confirmation by the VITEK® 2C automated platform revealed five isolates as lactobacillus delbrueckii, Streptococcus thermophilus and Pediococcus acidilactici with excellent identification and was screened for the following probiotic criteria.
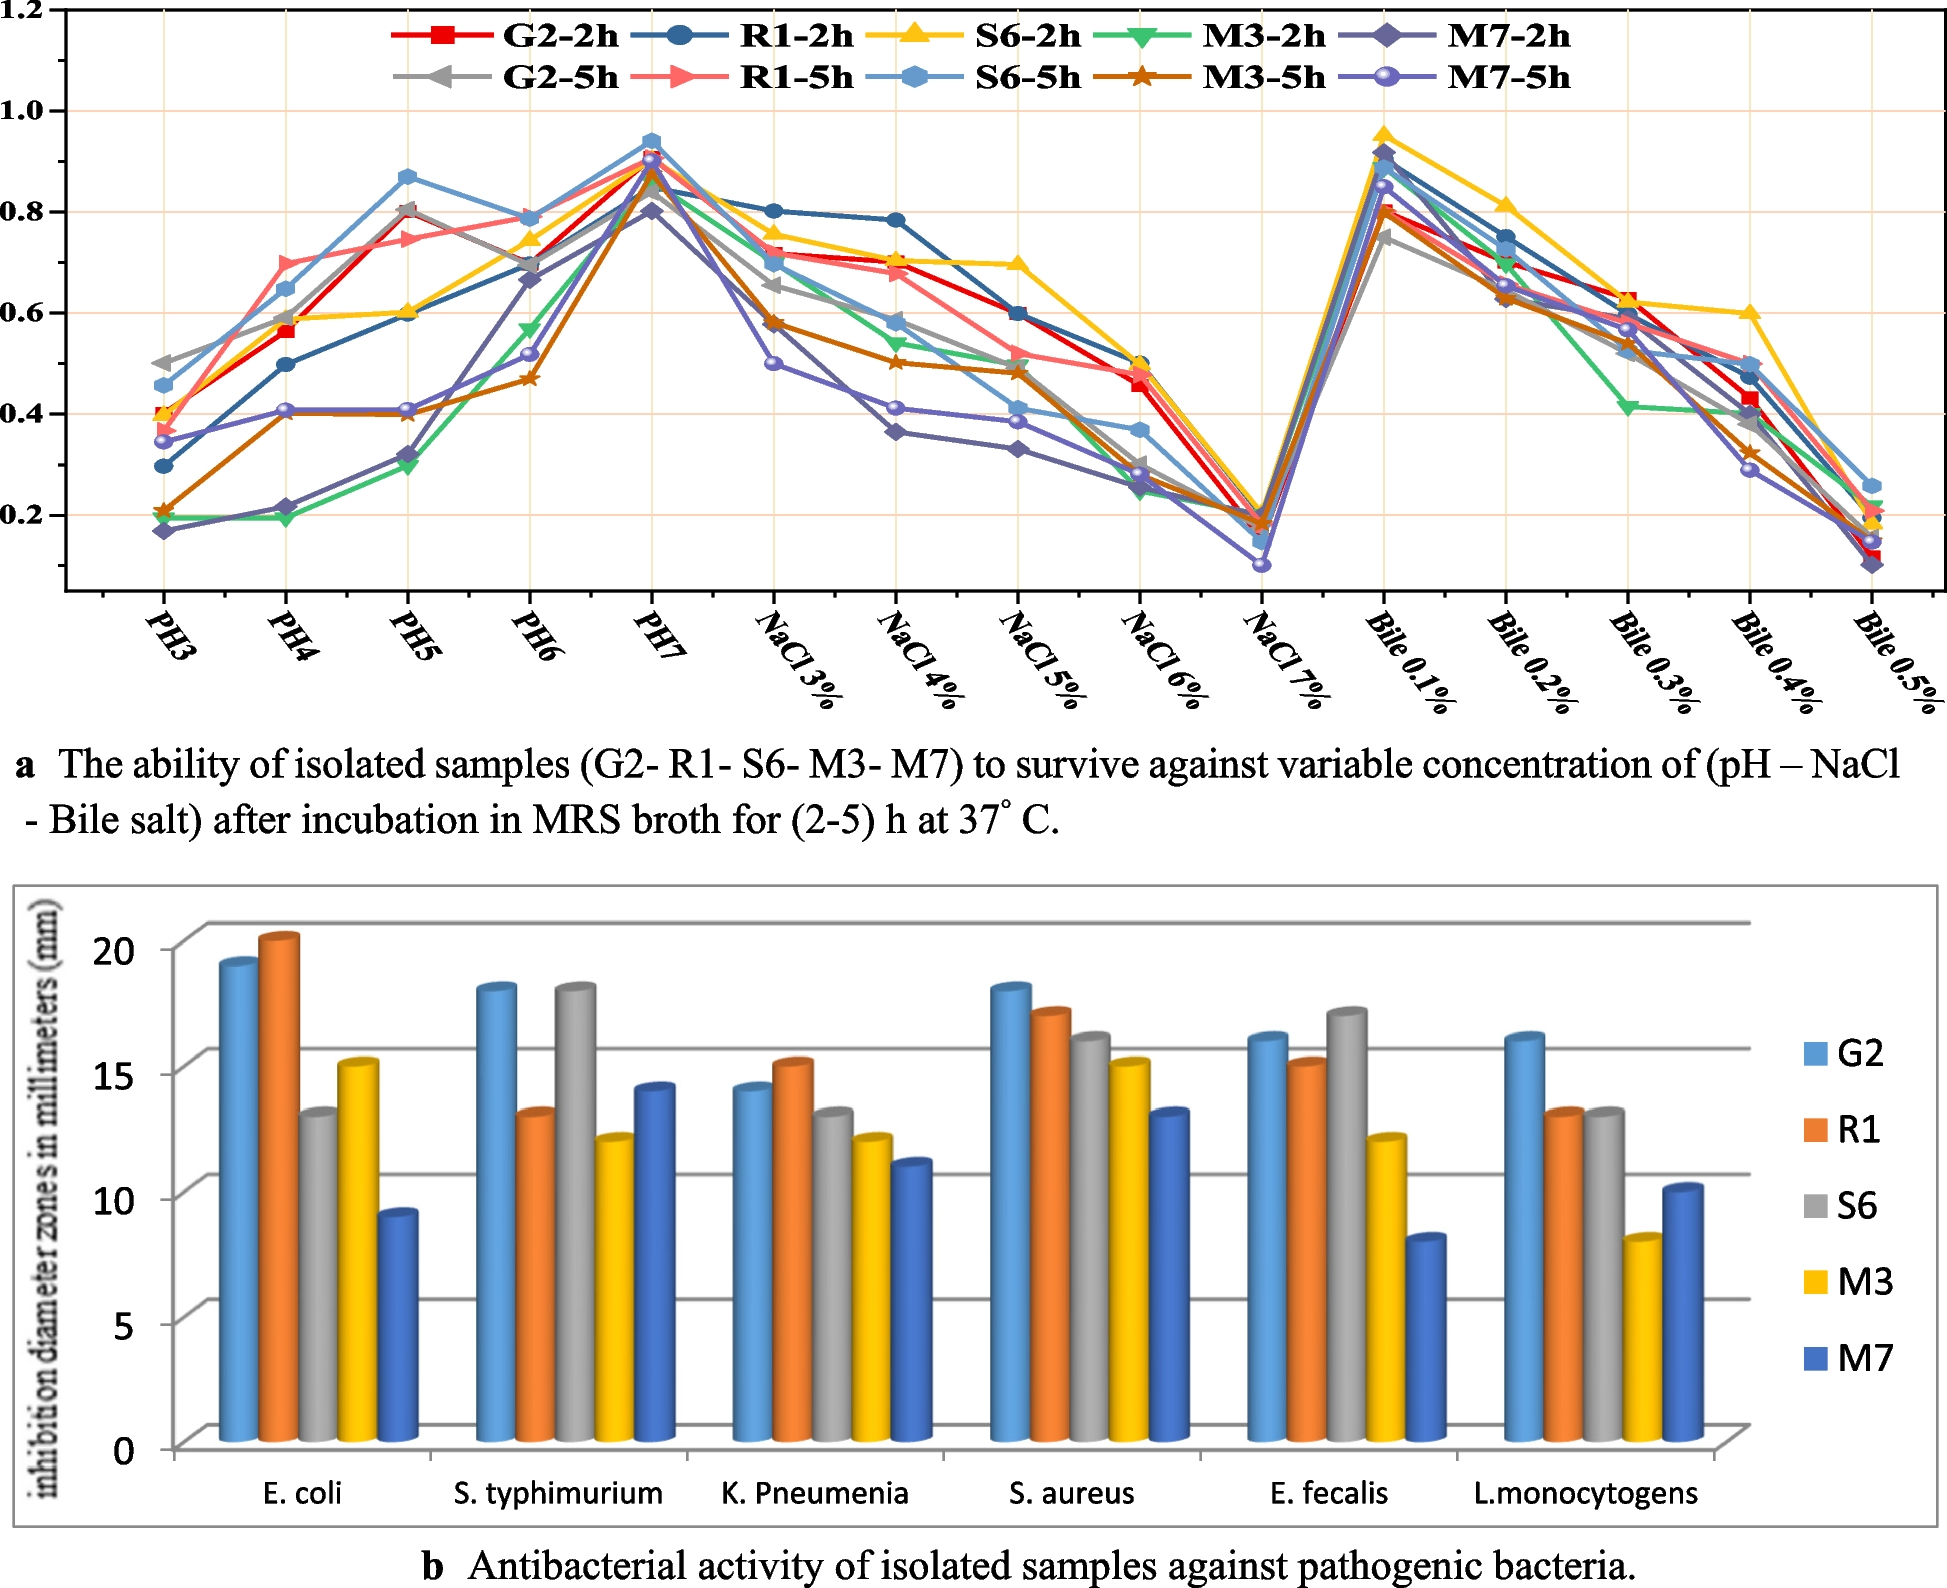
Tolerance to sodium chloride (NaCl)Five LAB isolates were tested for their tolerance to different NaCl concentrations, out of which three tolerants only developed properly at doses of 3%, 4%, and 5%, while slow growth was noticed at concentrations of 6% and 7% NaCl. At 7% NaCl dose, the growth slowed greatly after both 2 and 5h of incubation (Table 1).
Table 1 Tolerance of isolated samples for NaCl concentrations at 2h and 5hAcid toleranceThe three isolates that grew well at 5% NaCl concentration survived at low pH and showed resistance to acid stress. The resistant strains could survive at pH 4 (tolerance > 50%). After 5 h at pH 4, R1 had the highest tolerance (76.96%) and S6 had the lowest tolerance (68.86%) (Table 2). At pH 3, no tolerant strains were detected (resistance percentage < 50%).
Table 2 Acid tolerance of isolated samples at 2h and 5hBile toleranceInhibition was observed by increasing bile salt concentrations, but the three isolates tested continued to grow with increasing incubation time (resistance > 50%) but could not withstand bile salt concentrations of 0.5%. The highest resistance was reported for R1 (62.34%) and the lowest for G2 (50.66%), with 0.4% at 5h (Table 3). However, no isolates were resistant (percent resistance < 50%) in the 0.5% range. The challenges promising isolates face to survive these stressful conditions, which resemble those of the stomach and human intestine, are shown in Fig. 1a.
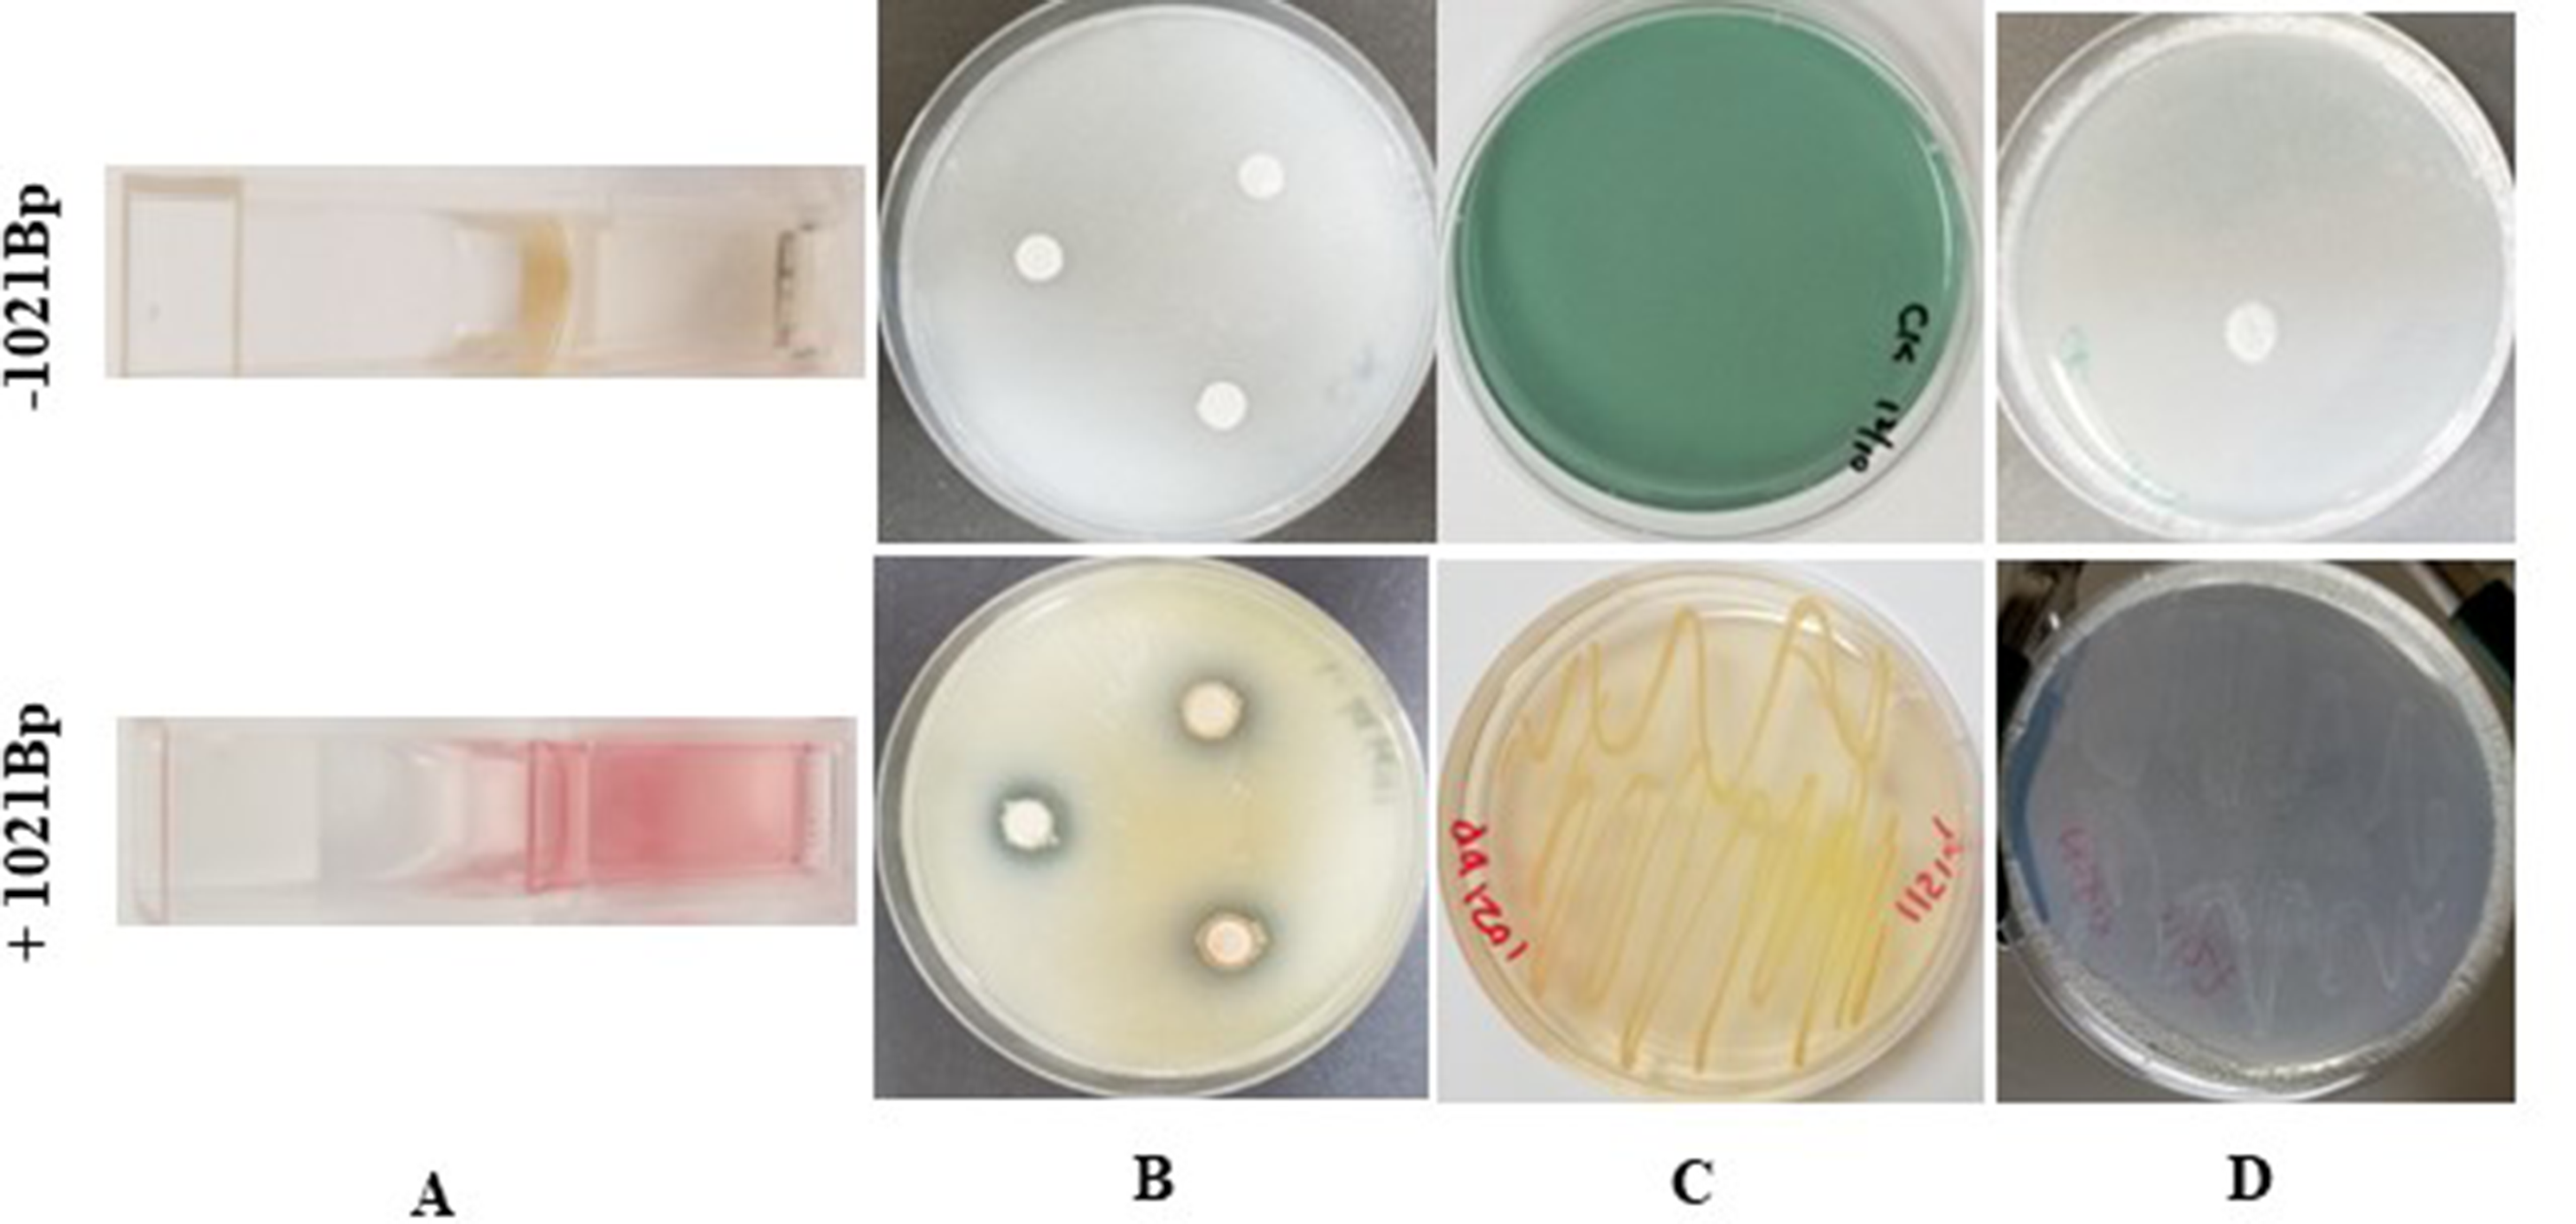
Table 3 Bile tolerance of isolated samples at 2h and 5hFig. 1
a The ability of isolated samples (G2- R1- S6- M3- M7) to survive against variable concentration of (pH – NaCl - Bile salt) after incubation in MRS broth for (2–5) h at 37° C. b Antibacterial activity of isolated samples against pathogenic bacteria
Antibiotics susceptibilityWe investigated our trials for antibiotic resistance on MHA plates by disc diffusing technique and the results are presented in Table 4. Three isolates showed resistance to stress factors, and were highly sensitive to azithromycin, chloramphenicol, ciprofloxacin, erythromycin, clarithromycin, nalidixic acid and neomycin while sensitive to ampicillin, tetracycline, streptomycin, and gentamicin. Interestingly, these isolates share less sensitivity towards penicillin, trimethoprim, sulfamethizole and ceftriaxone. It would be advantageous if probiotic microorganisms could possess antibiotic resistance to survive antibiotic treatment in the gastrointestinal tract.
Table 4 Antibiotic susceptibility profile of isolated samples with MHA after 24 hAntibacterial activitySix pathogens were investigated to determine the antibacterial effects of the evaluated isolates (Fig. 1b). The bacterial cell-free fluids tested showed inhibition against the pathogenic strains examined. S. aureus was an extremely sensitive pathogen to all the tested isolates. Isolate G2 was the most potent isolate as in (Table 5).
Table 5 Zone of inhibition of Antibacterial activity against pathogenic bacteriaAntiviral activitySince G2, S6, and R1 isolates demonstrated promising probiotic potential, further investigations were focused on these strains. The cytotoxicity of different concentrations of tested isolates (G2-R1-S6) on the viability of the Vero E6 cell line for 24 h, showed that 10−4, 10−5, 10−6 and 10−7 were safe. These concentrations were subsequently tested for their antiviral effects against SARS-CoV-2.". The findings revealed an inhibition percentage as shown in Table 6. Isolate G2 was the active inhibitory one.
Table 6 Antiviral activity of effective antibacterial isolates against SARS-CoV-2Genome sequencingWe obtained a complete genome sequence of three promising strains. A sequencing run was carried out on the Miseq platform for samples tested and identified during the study by the Nextera XT library preparation kit. The obtained data underwent a system analysis that resulted in 1350 k/mm2 total clusters, 90.8% a cluster PF, 96.5% Q30 (Read 1) and 97.5% Q30 (Read 2).
Genome features, assembly, annotationThe raw reads gave a good quality score on FastQC quality control checks on raw sequence data. According to the obtained data, sample no.1 coded by (G2) was assembled and resulting in 422 contigs with a genome length of 2,036,424 bp, With a typical G + C composition of 49.37%. The smallest sequence segment at 50% of the genome, which is known as N50 length, is 16,897 bp. The shortest number of contigs whose length sum produces N50 which defines the L50 count, is 33. Sample (G2) had been annotated with RASTtk (RAST tool kit) and given a distinct taxonomic classification as: cellular organisms > Bacteria > Terrabacteria > Firmicutes > Bacilli > Lactobacillales > Lactobacillaceae. This genome has 2,381 CDS (protein coding sequences), 61 tRNA (transfer RNA) genes, and 4 rRNA (ribosomal RNA) genes. The annotation involved 729 hypothetical proteins and 1,652 proteins having functional assignments out of which 559 EC numbers (proteins have Enzyme Commission), 463 GO assignments (proteins have Gene Ontology), and 388 proteins that were mapped to KEGG pathways and 2,232 proteins that belong to the PGFams (cross-genus protein families).
All these genomic features of our sequenced samples coded by (G2, R1 and S6) are listed in (Table 7). Samples coded by (G2 and S6) were assembled and resulted (1,016 and 19) contigs having (3,945,522 and 1,998,717) bp of genomic length of, with atypical GC content of (44.27 and 42.01) % respectively. The N50 length is (15,882 and 313,402) bp and the L50 count is (49 and 3) in the same respect. The annotation of sample (R1) revealed the taxonomy belongs to the family Streptococcaceae, while sample (S6) belongs to Lactobacillaceae. Both genomes have in order (4,902 and 1,963) CDS, (8 and 3) rRNA genes, and (89 and 15) tRNA genes. The annotation comprises (1,414 and 456) hypothetical proteins and (3,488 and 1,507) proteins have functional assignments divided into (1,225 and 547) EC proteins, (1,034 and 456) with GO assignments, and (866 and 387) proteins that had been mapped to KEGG pathways and (4,591 and 1,922) PGFams proteins.
Table 7 Assembly and annotation genomic features of the sequenced isolatesThe distribution of the genome annotations is shown in a circular graph (Fig. 2a). From outer to inner rings, this comprises the contigs, CDS on the forward strand, CDS on the reverse strand, RNA genes, CDS with homology to known antimicrobial resistance genes, CDS with homology to known virulence factors, GC content and GC skew. The subsystem to which these genes belong is indicated by the colors of the CDS on the forward and reverse strands (Fig. 2a).
Fig. 2
a A circular graphical display of the contigs distribution through the genome map annotations. b A circular chart display of the subsystem (subsystems, genes). c A phylogenetic tree shows the most common strain our isolates belong to in the neighboring classification. d A graphical diagram showing the distribution of the secondary metabolites along the genome of R1 isolate
Subsystems are collections of proteins that work together to carry out a particular biological function or structure complex. Examination of subsystems unique to each genome is part of the PATRIC annotation process. (Fig. 2b) gives a summary of the subsystem values for these genomes. The most represented subsystem features are metabolism, protein processing, defense, stress response, energy, virulence, cellular processes, DNA processing, RNA processing, cell envelope, membrane transport, miscellaneous, regulation and cell signaling.
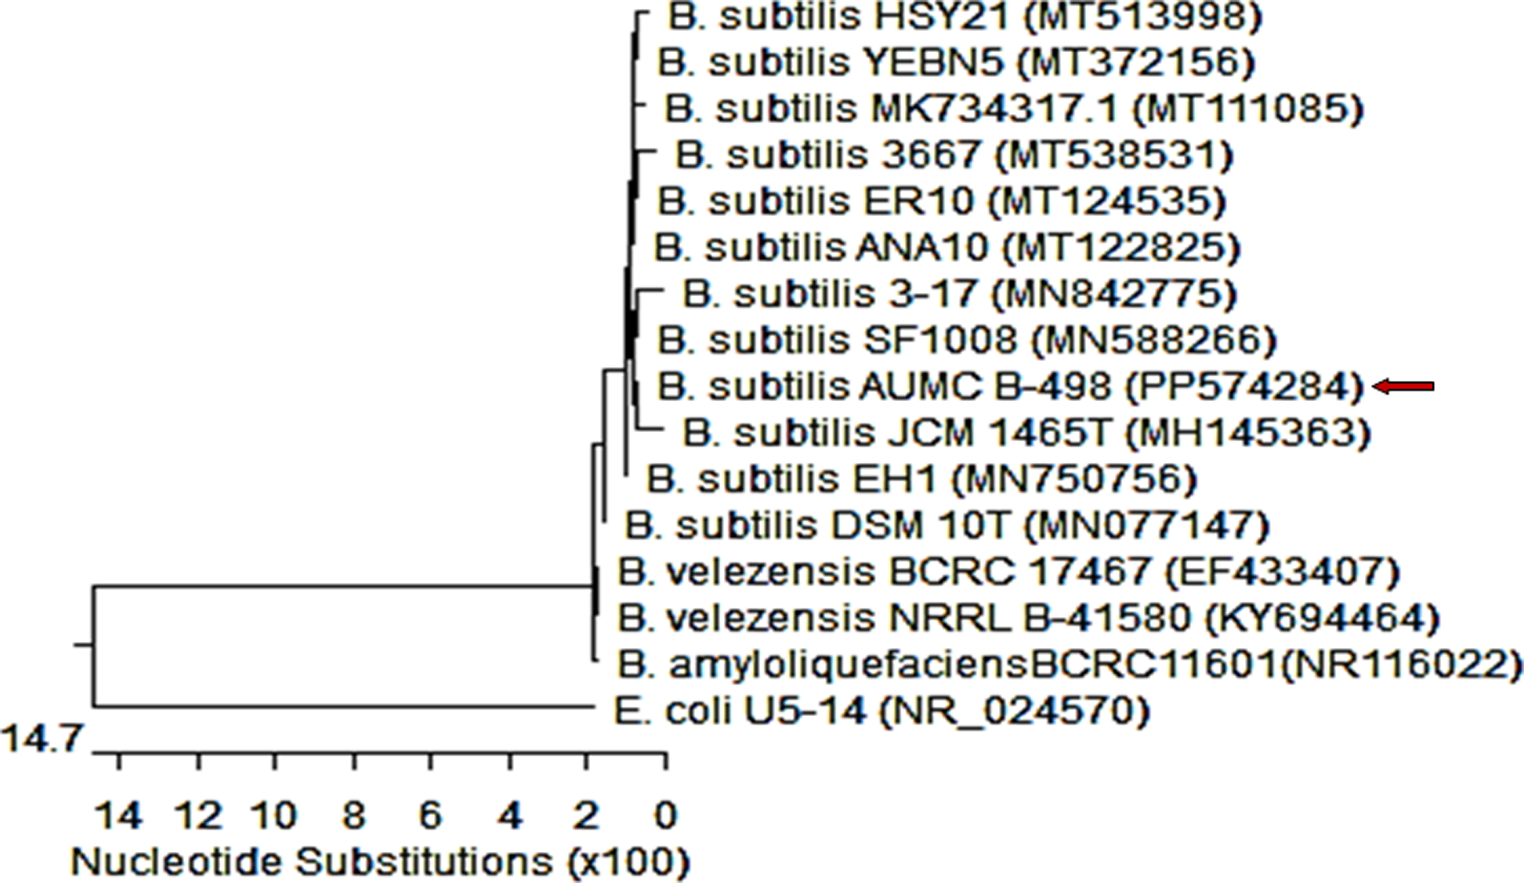
Phylogenetic tree analysisOur strains G2, R1 and S6 showed maximum sequence similarity with Lactobacillus delbrueckii subsp. bulgaricus, Streptococcus thermophiles, and Pediococcus acidilactici, respectively. Based on the complete genomic sequence, a phylogenetic tree was created after concatenating the combined set of nucleotide and amino acid alignments into a data matrix, and RaxML was utilized to resolve this matrix to understand the phylogenetic relationship among LAB strains as shown in (Fig. 2c).
Bioinformatics analysisNumerous annotated genes are homologous to known drug targets, transporters, and antibiotic-resistant genes. Antibiotic resistance phenotype is not always implied by the existence of AMR-related genes, even full ones, in a particular genome. This was confirmed through the ResFinder software (version 4.5.0), which proved that the samples were free of any resistant phenotypes. It is crucial to consider certain AMR pathways, particularly the existence or lack of SNP mutations that indicate resistance. Table 8 provides an overview of the AMR genes identified in this genome as the relevant AMR pathway.
Table 8 Specialty and AMR genes of the sequenced isolatesAntiSMASH enables quick discovery, annotation, and investigation of gene clusters involved in secondary metabolite production throughout the whole genome of bacteria. It identified the secondary metabolite regions (especially biosynthetic genes) that exist on different contigs along the genome of the analyzed isolates as shown in (Table 9).
Table 9 Biosynthetic secondary metabolites tracked by AntiSMASH softwareThe ARTS software confirmed all the resulting analyses obtained from AntiSMASH related to core/essential genes. Bacteriocin database BAGEL4 revealed the arrangement of the bacteriocin-encoding genes for G2 and R1 isolate as listed in Table 10, while no hits were found for S6 isolate.
Table 10 Bacteriocin-encoding genes localized on assembly contigs tracked by BAGEL4 softwareProphages and other insertion sequences which are named mobile genetic elements, were identified in the tested isolates by PhaBOX online tool. Two isolates were found to have phage sequences either virulent or temperate. Isolate G2 has six phage sequences out of which, one phage belongs to Peduoviridae family that matched Prevotella nigrescens as a suitable host. Isolate R1 showed thirteen phages, two of which belong to (Peduoviridae as isolate G2 and Ackermannviridae that matched Clostridioides difficile as suitable host). In Fig. 3a and b we found that the rest of the found phages have unknown families but matched a suitable host as shown in Tables 11 and 12. Isolate S6 doesn’t have any phage sequences.
Fig. 3
a A bar chart illustrating the abundance ratio of different phages among the tested samples G2 and R1. b An alignment of some phage sequences of G2 isolate to predict the suitable host
Table 11 Phage detected contigs in G2 isolate by PhaBOXTable 12 Phage detected contigs in R1 isolate by PhaBOXAll isolates were searched for presumed CRISPR-Cas coding sequences. All three isolates showed these repeated sequences that contain one or more associated Cas-gene or consensus repeats and the spacer genes as shown in the following tables. They have (5, 11, 2) CRISPR sequences respectively, associated with (2, 7, 3) Cas in the same order and differentiated to (8, 25, 7) clusters in the arrange (G2, R1, S6) as in Tables 13, 14, and 15.
Table 13 CRISPR/Cas clusters detected in G2 isolate by CRISPRCasFinder softwareTable 14 CRISPR/Cas clusters detected in R1 isolate by CRISPRCasFinder softwareTable 15 CRISPR/Cas clusters detected in S6 isolate by CRISPRCasFinder software
Comments (0)