
Remember me

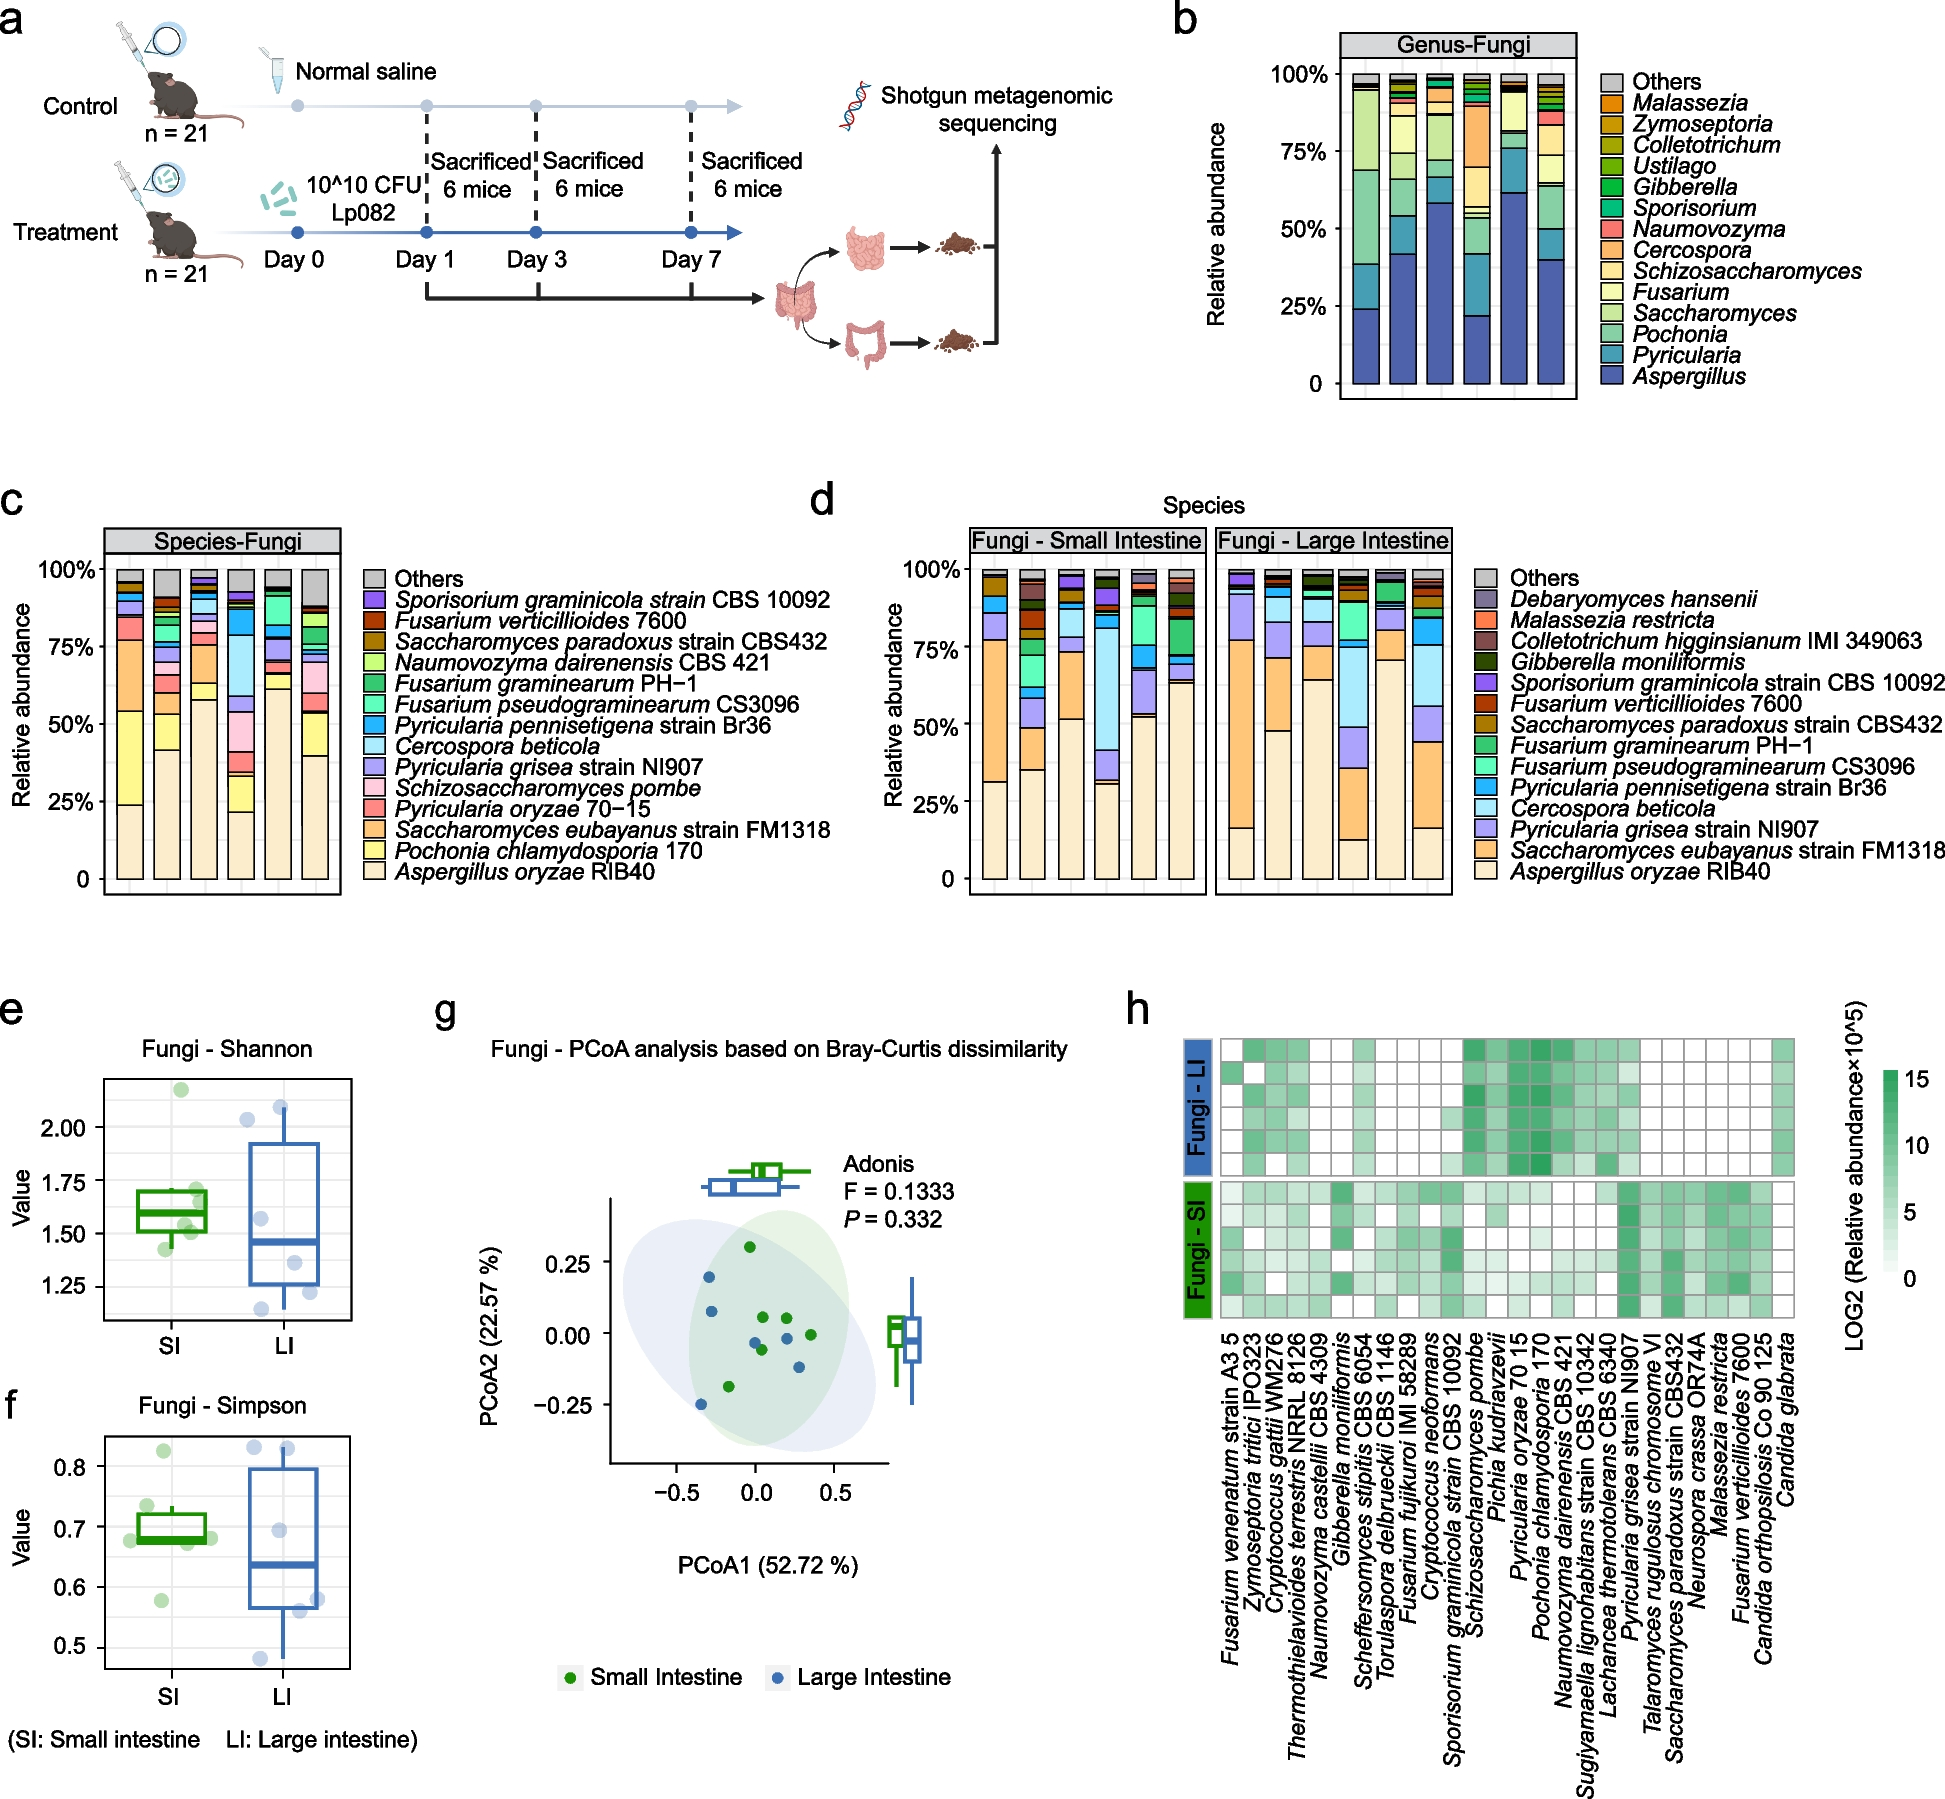


To investigate the structural changes in gut fungi and gut bacteriophages following the gavage of Lp082, shotgun metagenomic sequencing of intestinal contents on Days 1, 3, and 7 was performed. The relative abundance of fungi in the intestinal contents of the Con group on D1 was analyzed to establish the initial distribution of gut fungi. First, the relative abundance of fungal genera in the gut was calculated, and the composition and distribution of the gut fungi at the genus level was visualized (Fig. 1b). The gut fungi mainly consisted of Aspergillus, Pyricularia, Pochonia, and Saccharomyces. This predominance of Aspergillus may be associated with the mice's diet, which is primarily composed of corn and other plant-based materials [51]. The relative abundance of fungal species in the gut was counted (Fig. 1c). At the species level, the four fungal species with higher relative abundance were Aspergillus oryzae RIB40, Pochonia chlamydosporia 170, Saccharomyces eubayanus strain FM1318, and Pyricularia oryzae 70–15. These species, respectively, belonged to Aspergillus, Pochonia, Saccharomyces, and Pyricularia, which were consistent with the identification of the four dominant fungal genera. The distribution of fungal species in the small intestine and the large intestine was separately analyzed (Fig. 1d). The fungal communities in both the small intestine and the large intestine were mainly composed of Aspergillus oryzae RIB40, Pyricularia grisea strain NI907, and Saccharomyces eubayanus strain FM1318. However, the relative abundance of Saccharomyces eubayanus strain FM1318 in the large intestine was significantly higher than that in the small intestine.
The Shannon index and Simpson index of gut fungi in the small intestine and the large intestine were calculated (Fig. 1e and f), and Principal Coordinates Analysis (PCoA) based on Bray–Curtis dissimilarity was conducted (Fig. 1g). The differences in diversity between gut fungi in the small intestine and the large intestine were not significant. Fungal species with significantly different relative abundance between the small intestine and the large intestine were identified (P < 0.05) (Fig. 1h). A total of 26 fungal species showed significant differences in their relative abundance. The relative abundance of fungi such as Sporisorium graminicola strain CBS 10092 and Pyricularia grisea strain NI907 in the small intestine was significantly higher than the relative abundance in the large intestine. The relative abundance of fungi such as Candida orthopsilosis Co 90 125 and Fusarium verticillioides 7600 in the large intestine was significantly higher than the relative abundance in the small intestine. In summary, the composition of gut fungi in the small intestine and the large intestine was inconsistent.
Changes in the relative abundance of fungi in the small intestine after the intake of Lp082The intestinal contents of D1, D3, and D7 in the small intestine were collected, and the shotgun metagenomic sequencing was performed. The results of the shotgun metagenomic sequencing were annotated to identify the species and relative abundance of fungi. The changes in the relative abundance of fungi in the small intestine after the gavage of Lp082 were analyzed. The relative abundance of Lp082 in the small intestine was quantified (Fig. 2a). The relative abundance of Lp082 was higher on D1 and significantly decreased on D3 (P = 0.0179). The relative abundance of different fungal species was annotated, and the Shannon index and the Simpson index for each small intestinal sample were calculated to assess the α-diversity of the fungal communities (Fig. 2b and c). After Lp082 entered the small intestine, the fungal community changed on the first day, and α-diversity increased. On D3, the Shannon index had significantly decreased (P = 0.0103), and the Simpson index also showed a significant reduction (P = 0.0103). Bray–Curtis dissimilarity was calculated between each time point in the Con group and the Tre group (Fig. 2d) to assess the differences in gut microbiota composition between different time points. While the Con group showed no significant differences in composition among the three-time points, the Tre group exhibited significant differences. Specifically, the composition of the fungal community in the Tre group on D1 was significantly different from those on D3 (F = 12.4273, P = 0.009), and the composition on D1 was also significantly different from those on D7 (F = 5.8698, P = 0.01). These results indicated that after the intake of Lp082, the composition of the fungal community in the small intestine significantly changed. PCoA was then performed, and the explained variance for each PCoA axis was calculated (Fig. 2e and f). The PCoA1 values for the Tre group on D1 were significantly different from those on D3 (P = 0.0260), and the PCoA2 values for the Tre group on D1 were significantly different from those for the Con group on D7 (P = 0.0061). These demonstrated that the Tre group on D1 was different from the other groups.
Fig. 2
Changes in the Relative Abundance of Fungi in the Small Intestine After the Intake of Lp082. a Changes in the relative abundance of Lp082 in the small intestine on D1, D3, and D7. b,c α-diversity of gut fungi in the small intestine at different time points. The (b) panel shows the Shannon index, and the (c) panel shows the Simpson index. d Bray–Curtis dissimilarity of the small intestine fungal community between the three-time points in the Con group and the Tre group. Green represents the Con group, and brown represents the Tre group. There is no significant difference among the three-time points in the Con group, while there is a significant difference between D1 and the other two time points in the Tre group. e, f PCoA1 and PCoA2 of small intestine fungal community structure based on Bray–Curtis dissimilarity. g Heatmap showing the changes in the relative abundance of fungi with significant differences (P < 0.05) between the Con group and the Tre group in the small intestine on D1, D3, and D7. An asterisk (*) indicates fungi species with significant differences on the respective day. h Venn diagram showing the number of fungal species with significantly different (P < 0.05) in the small intestine on D1, D3, and D7. Two strains overlap between D3 and D7. i Co-occurrence network of fungi and Lp082 in the small intestine based on Spearman correlation (P < 0.05, |R|> 0.4). In the network, the green nodes represent Lp082, the red nodes represent fungi positively correlated with Lp082, the blue nodes represent fungi negatively correlated with Lp082, the orange lines represent direct associations with Lp082, the gray lines represent indirect associations with Lp082, the solid lines represent positive correlations, and the dashed lines represent negative correlations. The thickness of the lines represents the strength of the correlation
Subsequently, fungi with significant differences in relative abundance between the treatment and the Con group on D1, D3, and D7 were identified (P < 0.05) (Fig. 2g). Notably, the relative abundance of Candida albicans in the small intestine was significantly reduced in the Tre group compared to the Con group (P = 0.0345). The number of fungal species with significant differences at each time point was counted (P < 0.05) (Fig. 2h). A total of 14 fungal species showed significant differences in relative abundance between the Tre group and the Con group. It was observed that on D1, a larger number of fungal species, specifically 8, exhibited significant changes in relative abundance. Among those, two fungal species also showed significant differences on day 7. Spearman's rank correlation coefficients were calculated using the relative abundance of gut fungi and Lp082 at different time points. Four fungal species were found to be significantly correlated with Lp082 (P < 0.05, |R|> 0.4) and used to construct an interaction co-occurrence network (Fig. 2i). Among the identified interactions, it was observed that Brettanomyces nanus, Pyricularia grisea strain NI907, and Pyricularia pennisetigena strain Br36 showed a positive correlation with Lp082 (R = 0.4352, 0.4700, and 0.4701). Aspergillus oryzae RIB40 showed a negative correlation with Lp082 (R = -0.6284). After the intake of Lp082, there was a notable change in the fungal community of the small intestine, particularly evident on the first day. The relative abundance of related fungi, such as Candida albicans, decreased, while the relative abundance of Brettanomyces nanus and other associated fungi increased.
Changes in the relative abundance of fungi in the large intestine after the intake of Lp082The intestinal contents of D1, D3, and D7 in the large intestine were collected. Then, the shotgun metagenomic sequencing was performed, and the results were used to annotate the species and relative abundance of fungi. The relative abundance of Lp082 in the large intestine was quantified (Fig. 3a). The relative abundance of Lp082 was higher on D1 and significantly decreased on D3 (P = 0.0031). The relative abundance of different fungal species was then calculated, and the Shannon index and the Simpson index for each large intestinal sample were analyzed to assess the α-diversity of the fungal communities (Fig. 3b and c). There was no significant difference in the α-diversity across the different time points. Bray–Curtis dissimilarity between each time point in the Con group and the Tre group was calculated (Fig. 3d). There were no significant differences in fungal composition between the different time points in the Con group, but the Tre group exhibited significant differences. Specifically, the composition of the fungal community in the Tre group on D3 was significantly different from that on D7 (F = 7.0083, P = 0.012), and the composition on D1 was also significantly different from that on D7 (F = 4.0680, P = 0.008). After the intake of Lp082, the composition of the fungal community in the large intestine significantly changed. PCoA was then performed, and the explained variance for each PCoA axis was calculated (Fig. 3e and f). The PCoA2 values for the Tre group on D7 were significantly different from those on D1 (P = 0.0322), while there were no significant differences among the three-time points in the Con group. It demonstrated that there were greater differences in the fungal composition in the Tre group than in the Con group, and the Tre group on D7 was different from the other groups.
Fig. 3
Changes in the Relative Abundance of Fungi in the Large Intestine After the Intake of Lp082. a Changes in the relative abundance of Lp082 in the large intestine on D1, D3, and D7. b,c α-diversity of gut fungi in the large intestine at different time points. The left panel shows the Shannon index, and the right panel shows the Simpson index. d Bray–Curtis dissimilarity of the large intestine fungal community between the three-time points in the Con group and the Tre group. Blue represents the Con group, and red represents the Tre group. There is no significant difference among the three-time points in the Con group, while there is a significant difference between D7 and the other two time points in the Tre group. e, f PCoA1 and PCoA2 of large intestine fungal community structure based on Bray–Curtis dissimilarity. g The fitted curve of the relative abundance changes of the single strain in the large intestine showed significant differences in relative abundance between the Con group and the Tre group. This strain exhibited a significant difference on D7. h Venn diagram showing the number of fungal species with significantly different (P < 0.05) in the large intestine and the small intestine. There is no overlap between the fungi with significant differences in the small intestine and the large intestine (i) Co-occurrence network of fungi and Lp082 in the large intestine based on Spearman correlation (P < 0.05, |R|> 0.4). In the network, the green nodes represent Lp082, the red nodes represent fungi positively correlated with Lp082, the blue nodes represent fungi negatively correlated with Lp082, the orange lines represent direct associations with Lp082, the solid lines represent positive correlations, and the dashed lines represent negative correlations. The thickness of the lines represents the strength of the correlation
Subsequently, fungi with significant differences in relative abundance between the Tre group and the Con group on D1, D3, and D7 were identified (P < 0.05), and only Pochonia chlamydosporia 170 showed a significant difference on D7(P = 0.0210) between the Tre group and the Con group (Fig. 3g). The number of fungi with significant differences between the small and the large intestines was calculated (Fig. 3h). There was only one fungus with significant differences in the large intestine, while the number in the small intestine was 14, with no overlap between the small intestine and the large intestine. Spearman's rank correlation coefficients (P < 0.05, |R|> 0.4) were calculated using the relative abundance of gut fungi and Lp082 at different samples (Fig. 3i). There were only two fungal species were significantly correlated with Lp082. Specifically, Botrytis cinerea B05 10 was positively correlated with Lp082 (R = 0.4363), Zygotorulaspora mrakii was negatively correlated with Lp082 (R = -0.4241). The changes caused by Lp082 in the large intestine were less than those in the small intestine.
Initial distribution of the gut bacteriophages in the small intestine and the large intestine of the miceThe relative abundance of gut bacteriophages in the intestinal contents of the Con group on D1 was calculated, aiming to analyze the initial distribution of the gut bacteriophages. First, the composition and distribution of the gut bacteriophages at the genus level was visualized (Fig. 4a). The gut bacteriophages mainly consisted of Aspergillus, Pyricularia, Pochonia, and Saccharomyces. The relative abundance of bacteriophage species in the gut was counted (Fig. 2b). At the species level, the four bacteriophage species with higher relative abundance were bacteriophages that infect bacteria Lactiplantibacillus B murinus, Limosilactobacillus B animalis, and Agathobacter rectalis. The distribution of bacteriophage species in the small intestine and the large intestine was separately analyzed (Fig. 4c). The top 14 bacteriophages in the small intestine and the large intestine were consistent with the top 14 bacteriophages ranked by their overall relative abundance in the gut. In both the small and the large intestines, the predominant bacteriophages were those infecting Lactiplantibacillus B murinus. The relative abundance of Lactiplantibacillus B murinus bacteriophages was higher in the large intestine compared to the small intestine. Conversely, the relative abundance of Limosilactobacillus B animalis bacteriophages was higher in the small intestine than in the large intestine.
Fig. 4
Initial Distribution of the Gut Bacteriophages. a The relative abundance of bacteriophages at the genus level in the gut, displaying only the top 14 genera in terms of relative abundance. b Relative abundance of bacteriophages in the gut, showing only the top 14 species in terms of relative abundance. The names here refer to the hosts of the bacteriophages. c Distribution of bacteriophages at the species level in the small intestine and the large intestine. The left panel shows the distribution in the small intestine, and the right panel shows the distribution in the large intestine, displaying only the top 14 species in terms of relative abundance. The names here refer to hosts of the bacteriophages. d, e α-diversity of bacteriophages in the small intestine and the large intestine. The (d) panel shows the Shannon index, and the (e) panel shows the Simpson index. The green box represents the Shannon index in the small intestine, and the blue box represents the Simpson index in the large intestine. Both the Shannon index and Simpson index revealed significant differences between the small intestine and the large intestine. f PCoA of large intestine and small intestine bacteriophage community structure based on Bray–Curtis dissimilarity. g Heatmap showing the relative abundance changes of bacteriophages with significant differences (P < 0.05) between the small intestine and the large intestine. The darker colors indicate higher relative abundance. A total of 51 bacteriophage species showed significant differences
The Shannon index and Simpson index of gut bacteriophages in the small intestine and the large intestine were calculated (Fig. 4d and e). In the large intestine, the Shannon and Simpson index were significantly higher than in the small intestine (P = 0.0022). PCoA based on Bray–Curtis distances (Fig. 4f) showed that the compositions of the small intestine and the large intestine were largely separated (P = 0.004). The number of bacteriophage species with significantly different relative abundance between the small intestine and the large intestine was 51. (P < 0.05) (Fig. 4g). Bacteriophages such as those infecting Roseburia intestinalis and Parabacteroides distasonis had significantly lower relative abundance in the small intestine compared to the large intestine. In contrast, bacteriophages such as those infecting Enterococcus faecium and Limosilactobacillus salivarius had significantly higher relative abundance in the small intestine compared to the large intestine. At the initial state, there was a significant difference in the composition of gut bacteriophages between the large intestine and the small intestine.
Changes in the relative abundance of bacteriophages in the small intestine after the intake of Lp082The species and relative abundance of bacteriophages in the small intestine on D1, D3, and D7 were annotated. The Shannon and Simpson index for each time point were calculated (Fig. 5a and b). After Lp082 entered the small intestine, the Shannon and Simpson index of the bacteriophages in the small intestine increased on the first day, but the increase was not statistically significant. Bray–Curtis dissimilarity between each time point in the Con group and the Tre group was calculated (Fig. 5c). It was found that the Con group showed no significant differences in composition among the three-time points, but there was a significant difference in the composition between D1 and D3 in the Tre group (P = 0.045). After the gavage of Lp082, the composition of the bacteriophages in the small intestine significantly changed. The explained variance for each PCoA axis showed that the PCoA1 value for the Tre group on D1 was significantly different from that for the Con group on D1 (P = 0.0394), and the PCoA2 value for the Tre group on D1 was significantly different from that for the Con group on D7 (P = 0.0101) (Fig. 5d and e). It was evident that the composition in the Tre group on D1 differed significantly from those in the other samples.
Fig. 5
Changes in the Relative Abundance of Bacteriophages in the Small Intestine After the Intake of Lp082. a, b α-diversity of gut bacteriophages in the small intestine at different time points. The (a) panel shows the Shannon index, and the (b) panel shows the Simpson index. c Bray–Curtis dissimilarity of the small intestine bacteriophage community between the three-time points in the Con group and the Tre group. Green represents the Con group, and brown represents the Tre group. There is no significant difference among the three-time points in the Con group, while there is a significant difference between D1 and D7 in the Tre group. d, e PCoA1 and PCoA2 of small intestine bacteriophage community structure based on Bray–Curtis dissimilarity. f, g Venn diagram showing the number of bacteriophage species with significant differences in the small intestine on D1, D3, and D7. The (f) panel is the Venn diagram of bacteriophage species with significantly different relative abundance at P < 0.01, and the (g) panel is the Venn diagram of bacteriophage species with significantly different relative abundance at P < 0.05. h Heatmap showing the changes in the relative abundance of bacteriophages with significant differences (P < 0.01) between the Con group and the Tre group in the small intestine on D1, D3, and D7. An asterisk (*) indicates bacteriophage species with significant differences on the respective day. i A line plot and linear regression of the relative abundance changes of Lp082 and its bacteriophages, R = 0.55, indicating a positive correlation between the relative abundance of Lp082 and its bacteriophages. j, k The host bacteria corresponding to the bacteriophage with significantly different relative abundance were identified, and TWO strains with significantly different relative abundance were found, including Anaerostipes hadrus and Blautia hansenii. Line plots showing the relative abundance at three-time points were constructed, and linear regression analysis was performed. Each group of bacteria and their bacteriophages exhibited a highly positive correlation
Bacteriophages with significant differences in relative abundance between the Tre group and the Con group were identified. The number of bacteriophage species with significant differences at each time point was counted (Fig. 5f and g). There was a notable overlap in the bacteriophage species between D1 and D7, with 20 different bacteriophage species showing significant differences (P < 0.05) among these, Clostridium Q symbiosum and Coprococcus eutactus were highly significant (P < 0.01). Bacteriophages with significantly different relative abundance at each time point were collected (P < 0.01) (Fig. 5h). It was found that the hosts of all the bacteriophages with significantly different relative abundance belonged to the class Clostridia. To investigate the abundance correlation between host bacteria and their bacteriophages, the relative abundance of the host bacteria in the small intestine was analyzed. First, the relative abundance of Lp082 and its bacteriophages was used to perform a linear regression analysis (Fig. 5i). The analysis showed that the trends in the relative abundance of Lp082 and its bacteriophages were similar, with a positive correlation (R = 0.55). Additionally, two bacterial strains corresponding to the bacteriophages with significantly different relative abundance were identified. These strains were Anaerostipes hadrus and Blautia hansenii. The relative abundance of the host bacteria and their bacteriophages was also used to perform a linear regression analysis (Fig. 5j and k). The analysis revealed that the relative abundance trends of the host bacteria and their bacteriophages were consistent, and the relative abundance showed high positive correlations (R = 0.81 and 0.85). Lp082 caused a significant change in the gut bacteriophages in the small intestine, which was primarily characterized by an increase in the relative abundance of both Clostridia bacteria and their bacteriophages.
Changes in the relative abundance of bacteriophages in the large intestine after the intake of Lp082The species and relative abundance of bacteriophages in the large intestine on D1, D3, and D7 were annotated. The Shannon and Simpson index for each time point were calculated (Fig. 6a and b), and the differences in α-diversity between each sample were not statistically significant. The Bray-Curtis dissimilarity between each time point in the Con group and the Tre group was calculated (Fig. 6c). In the Con group, no significant differences were observed between D1 and D3 or between D3 and D7. There was only a significant difference between D1 and D7 (P =0.017). However, in the Tre group, significant differences were observed between all the time points. Specifically, the P-value between D1 and D3 was 0.049 (F = 2.2925), the P-value between D3 and D7 was 0.017 (F = 2.9155), and the P-value between D1 and D7 was 0.031 (F = 3.4328). These results proved that the intake of Lp082 influenced the bacteriophage community in the large intestine. Then, PCoA was performed, and the explained variance for each PCoA axis was calculated (Fig. 6d and e). In the Tre group, the PCoA2 value on D3 was significantly different than that on D7 (P = 0.0137). The compositional differences in the large intestine between different time points in the Tre group were greater than those in the Con group.
Fig. 6
Changes in the Relative Abundance of Bacteriophages in the Large Intestine After the Intake of Lp082. a, b α-diversity of gut bacteriophages in the large intestine at different time points. The left panel shows the Shannon index, and the right panel shows the Simpson index. c Bray–Curtis dissimilarity of the large intestine bacteriophage community between the three-time points in the Con group and the Tre group. Blue represents the Con group, and red represents the Tre group. There is only a significant difference between D3 and D7 in the Con group. However, in the Tre group, significant differences were observed between all the time points. d, e PCoA1 and PCoA2 of large intestine bacteriophage community structure based on Bray–Curtis dissimilarity. f, g Venn diagram showing the number of bacteriophage species with significant differences in the large intestine on D1, D3, and D7. The (f) panel is the Venn diagram of bacteriophage species with significantly different relative abundance at P < 0.01, and the (g) panel is the Venn diagram of bacteriophage species with significantly different relative abundance at P < 0.05. h Venn diagram showing the number of bacteriophage species with significantly different (P < 0.01) in the large intestine and the small intestine. There were four overlaps between the bacteriophage species with significantly different relative abundance in the small intestine and the large intestine. i Heatmap showing the changes in the relative abundance of bacteriophages with significant differences (P < 0.01) between the Con group and the Tre group in the large intestine on D1, D3, and D7. An asterisk (*) indicates bacteriophage species with significant differences on the respective day. j, k, l The host bacteria corresponding to the bacteriophage with significantly different relative abundance were identified, and three strains with significantly different relative abundance were found, including Lactiplantibacillus plantarum, Achromobacter xylosoxidans, and Blautia hansenii. Line plots showing the relative abundance at three-time points were constructed, and linear regression analysis was performed. Each group of bacteria and their bacteriophages exhibited a positive correlation
Then, we identified bacteriophages with significant differences in relative abundance between the Tre group and the Con group and counted the number of bacteriophage species at each time point (Fig. 6f and g). Among the bacteriophages with significantly different relative abundance (P < 0.05), there were two overlapping bacteriophage species between D3 and D7, and 11 overlapping bacteriophage species between D1 and D7. Bacteriophage species with significantly different relative abundance at each time point were collected (P < 0.01) (Fig. 6i). Notably, the relative abundance of bacteriophage that infected Lactiplantibacillus plantarum significantly increased (P = 0.0033). The number of bacteriophage species with significantly different relative abundance was calculated between the small intestine and the large intestine (Fig. 6h). In the large intestine, a total of 19 bacteriophage species with significantly different relative abundance were identified, which is fewer than the number of bacteriophage species with significantly different relative abundance in the small intestine. The number of bacteriophage species with significantly different relative abundance between the small intestine and the large intestine was 4. Then, three bacterial strains corresponding to the bacteriophages with significantly different relative abundance were identified. These strains were Lactiplantibacillus plantarum, Achromobacter xylosoxidans, and Blautia hansenii. The relative abundance of the host bacteria and its bacteriophages was also used to perform a linear regression analysis (Fig. 6j, k, and l). It was found that the relative abundance trends of the host bacteria and their bacteriophages were consistent, and the relative abundance showed positive correlations (R = 0.65, 0.57, and 0.7). The gavage of Lp082 influenced the gut bacteriophages of the large intestine, though this change was less pronounced compared to that in the small intestine.
Comments (0)