
Remember me

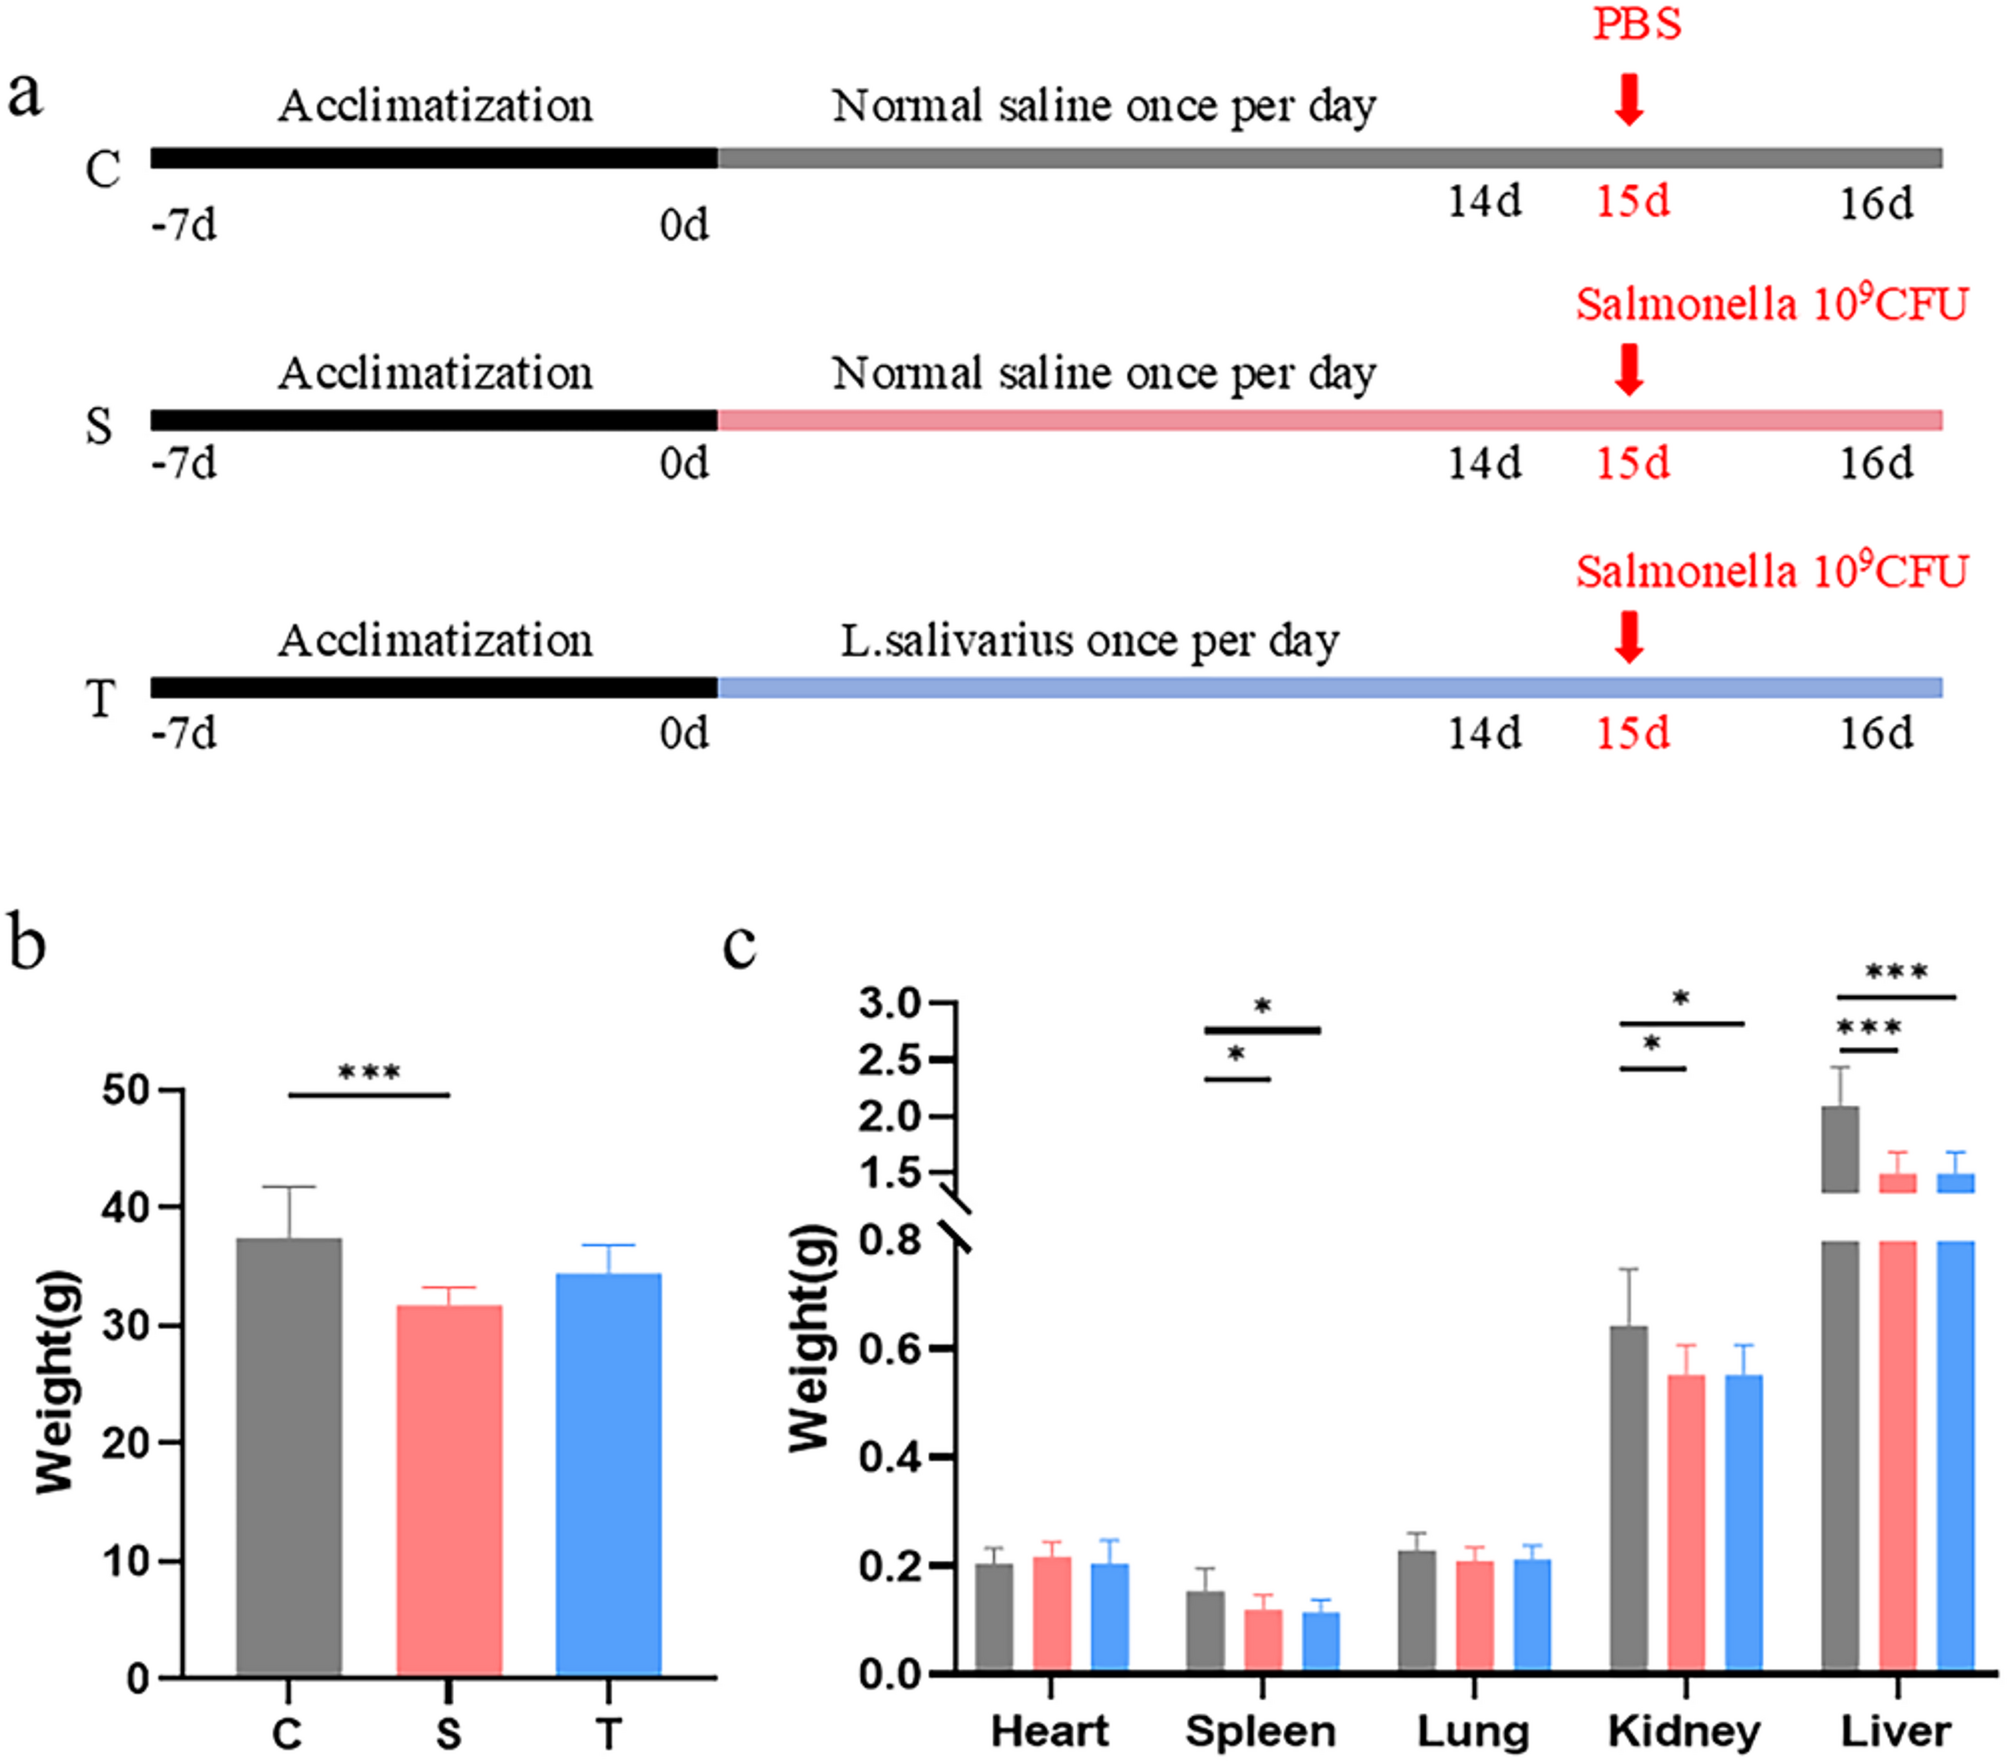


Compared to the control group, mice in both the model and treatment groups exhibited varying degrees of weight loss. Specifically, the model group showed a significant reduction in body weight (p < 0.001), while the treatment group demonstrated a lesser degree of weight loss compared to the control group but a notable increase relative to the model group (Fig. 1b). In terms of organ weights, significant reductions were observed in the spleen (p < 0.05), kidney (p < 0.05), and liver (p < 0.001) in both the model and treatment groups compared to the control group. Although the differences in organ weights between the model and treatment groups were not statistically significant, the treatment group exhibited slightly higher organ weights than the model group (Fig. 1c).
Bacterial load in intestinal organsCompared to the control group, the bacterial load in all intestinal segments was elevated in both the model and treatment groups. Notably, the bacterial load in the duodenum, ileum, and colon of the model group was significantly higher (p < 0.01). However, following treatment with L. salivarius, the bacterial load in the duodenum (p < 0.001) and colon of the treatment group was significantly reduced (Fig S1).
Intestinal histopathological changesFollowing colonization in the intestinal tracts of mice, Salmonella disrupts the inflammatory regulation mechanism, leading to damage to intestinal epithelial cells and subsequent structural deterioration of the intestinal tract [34]. H&E staining of each intestinal segment revealed that the villi structure in the normal control group remained intact, with no significant damage observed. In contrast, the infected model group exhibited severe swelling and damage and damage in the duodenal and ileal villi, characterized by disorganized villous epithelial cells, swollen lamina propria cells, and signs of degeneration and necrosis. Additionally, numerous damaged and shed villous fragments and exudates accumulated in the center of the intestinal lumen, along with infiltration of inflammatory cells. In the L. salivarius treatment group, although the villi were slightly swollen and damaged compared to the normal control group, the overall structure was more intact than in the infection model group. Only minor damage was observed at the tips of the villi, and inflammatory cell infiltration was noticeably reduced. These findings suggest that pretreatment with L. salivarius can mitigate intestinal epithelial damage caused by Salmonella infection in mice to some extent (Fig. 2). After Salmonella challenge, the villus height and V/C in the duodenum, jejunum and ileum of mice were significantly reduced, while the crypt depth was significantly increased. In contrast, the villus height and V/C in the Lactobacillus salivary group were significantly increased, and the crypt depth was significantly reduced (p < 0.05), this suggests that Lactobacillus salivary treatment can significantly alleviate the damage to the small intestinal villi structure caused by Salmonella (Fig. 3).
Fig. 2
Representative images of H&E staining of intestinal segments. a: Control group (C); b: Infection model group (Salmonella-infected, S); c: L. salivarius treatment group (T)
Fig. 3
The height of intestinal villi in each segment of the small intestine, the depth of crypts, and the ratio of the height of intestinal villi to the depth of crypts. C: Control group, S: Infection model group (Salmonella-infected), T: L. salivarius treatment group. ***p < 0.001, **p < 0.01, *p < 0.05
Analysis of intestinal bacterial diversityHigh-throughput sequencingA total of 2,162,583 raw reads were generated through high-throughput sequencing of 16 S rRNA and ITS regions. After rigorous quality control measures, including denoising, splicing, and chimera removal using DADA2’s denoise-paired function, 1,701,811 high-quality sequences were retained. Once denoising was completed for all libraries, the Amplicon Sequence Variant (ASV) feature sequences and ASV tables were integrated, with singleton ASVs being excluded. Ultimately, a total of 1,701,520 ASVs were obtained. (C = 577819, S = 559509, T = 564192) (Table 1).
Table 1 Microflora sequencing results for each sampleThe rarefaction curve, with the Chao1 diversity index on the vertical axis, stabilizes as sequencing depth increases, indicating that the sequencing depth ranges from 99.98 to 100%, effectively covering all species present (Fig S2 a, c). This confirms that the sequencing results accurately reflect the true microbial composition of the test samples. Additionally, the abundance rank curve exhibits a smooth gradient, indicating a uniform distribution of species within each sample (Fig S2 b, d).
Analysis of intestinal flora diversityIn this research, the diversity of intestinal microbiota was evaluated employing various indices: richness was quantified using the Chao1 and Observed Species indices, diversity was assessed by the Shannon and Simpson indices, phylogenetic diversity was gauged by Faith’s PD index, and evenness was determined by Pielou’s Evenness index. Additionally, the Good’s Coverage index was utilized to assess the sequencing depth. The bacterial diversity analysis revealed a significant increase in the Chao1 (p = 0.013) and the Observed_species (p = 0.014) indices in the control group and treatment groups, indicating enhanced richness of intestinal flora, while the other indices showed no significant differences (Fig S3 a). However, compared with model group, the control and treatment groups exhibited significantly lower values for the Chao1 (p = 0.031), Observed_species (p = 0.031), Pielou_e (p = 0.016) and Shannon (p = 0.0074) indexes, suggesting that Salmonella infection led to significant changes in the diversity of intestinal flora of mice (Fig S3 b).
Beta diversity among groups was evaluated using Principal Coordinate Analysis (PCoA), employing the Bray-Curtis distance metric, and Non-metric Multidimensional Scaling (NMDS), based on the Jaccard similarity index. The PCoA results demonstrated a clear separation between the Salmonella-induced model group and the control and treatment groups, indicating significant alterations in intestinal microbial structure due to Salmonella infection. Similarly, NMDS analysis showed a stress value of < 0.2, confirming that the beta diversity analysis was accurate and reliable in reflecting differences between samples (Fig. 4 a, b). These findings suggest that Salmonella infection profoundly impacts the composition and structure of the intestinal microbiota in mice.
Fig. 4
β-diversity analysis of gut microbiota. a: Bacterial β-diversity; b: Fungal β-diversity. C: Control group; S: Infection model group (Salmonella-infected); T: L. salivarius treatment group
Intestinal bacterial composition analysisTo analyze the bacterial composition at different taxonomic levels, the top 10 species with the highest relative abundance in each sample were selected, and a group average species distribution map was used to visualize the species composition across groups. At the phylum level, Bacteroidota was the predominant phylum in all groups (C = 48.48%, S = 52.61%, T = 40.26%), followed by Firmicutes_A (C = 13.72%, S = 11.73%, T = 13.72%), Firmicutes_D (C = 10.76%, S = 14.48%, T = 14.06%), and Proteobacteria (C = 11.39%, S = 8.37%, T = 12.48%) (Fig. 5 a). At the class level, Bacteroidia remained dominant across all groups (C = 48.41%, S = 52.60%, T = 40.14%), along with Clostridia_258483 (C = 13.74%, S = 11.65%, T = 13.73%), Bacilli (C = 10.77%, S = 14.49%, T = 14.08%), and Gammaproteobacteria (C = 7.41%, S = 6.68%, T = 8.46%) (Fig. 5 b).
Fig. 5
Relative abundance of bacterial species at different taxonomic levels. a: Phylum; b: Class; c: Order; d: Family; e: Genus. C: Control group, S: Infection model group (Salmonella-infected), T: L. salivarius treatment group
At the order level, Bacteroidales (C = 46.80%, S = 51.94%, T = 38.78%) and Oscillospirales (C = 4.47%, S = 5.93%, T = 6.13%) were the dominant orders in all groups. Lachnospirales was shared as a dominant order between the control and treatment groups (C = 7.06%, T = 5.34%). Erysipelotrichales was shared as a dominant order between the model and treatment groups (S = 8.23%, T = 5.17%). Notably, Campylobacterales was uniquely dominant in the model group (4.23%) (Fig. 5 c). At the family level, Muribaculaceae (C = 21.01%, S = 30.92%, T = 17.50%) and Bacteroidaceae (C = 15.82%, S = 13.63%, T = 14.00%) were the dominant families across all groups (Fig. 5 d). At the genus level, the dominant genera in the control group were Paramuribaculum (5.40%), Bacteroides_H (8.46%), Duncaniella (6.13%), Prevotella (6.18%), and Bacteroides_H (8.46%). In the model group, the dominant genera were Paramuribaculum (12.20%), Alloprevotella (7.05%), UBA3263 (5.31%), and Faecalibaculum (5.62%). In the treatment group, the dominant genera were Paramuribaculum (8.28%), Alloprevotella (7.33%), Bacteroides_H (4.23%), and Dubosiella (4.80%) (Fig. 5 e).
To further analyze differences in bacterial composition at the genus level, multiple t-tests were employed. Specifically, in comparison to the control group, the model group exhibited a significant increase in the relative abundance of UBA3263 (p < 0.01) and Parasutterella (p < 0.05), while COE1 significantly decreased (p < 0.05). Additionally, within the treatment group, a significant decrease was observed in the relative abundance of CAG-269. When comparing the model group to the treatment group, the relative abundances of Coprocola and Acutalibacter were markedly decreased in the model group (p < 0.05), whereas the relative abundance of CAG-605 and Angelakisella were significantly increased (p < 0.05) (Fig S4).
Linear Discriminant Analysis (LDA) histograms were used to visualize the labeled species and their relationships within each group. Conversely, taxonomic lineage maps illustrated their hierarchical distribution. Notably, significant compositional differences were observed exclusively in the model group, particularly at the genus level, highlighting Faecalibaculum, UBA3263, UBA737, and Blautia_A_141781 as distinct markers (Fig. 6 ).
Fig. 6
Linear discriminant analysis effect size (LEfSe) and LDA scores for intestinal bacterial microbiota. C: Control group; S: Infection model group (Salmonella-infected); T: L. salivarius treatment group
Intestinal fungal composition analysisAt the phylum level, Ascomycota (C = 78.75%, S = 75.38%, T = 81.41%) and Basidiomycota (C = 12.66%, S = 13.46%, T = 12.34%) were the predominant fungal phyla across all groups (Fig. 7 a). At the class level, the most abundant fungal classes included Saccharomycetes (C = 30.64%, S = 22.71%, T = 44.39%), Sordariomycetes (C = 22.08%, S = 24.19%, T = 12.99%), and Dothideomycetes (C = 15.37%, S = 11.81%, T = 9.39%) (Fig. 7 b). Shifting focus to the order level, Saccharomycetales (C = 31.12%, S = 23.15%, T = 45.27%) and Hypocreales (C = 11.29%, S = 11.95%, T = 5.64%) exhibited high relative abundances across all groups (Fig. 7 c). At the family level, Saccharomycetales_fam_Incertae_sedis (C = 20.89%, S = 12.15%, T = 34.15%) was the most dominant family in all groups (Fig. 7 d). Lastly, at the genus level, Candida (C = 22.52%, S = 11.37%, T = 35.08%) emerged as the predominant strain in all groups (Fig. 7 e).
Fig. 7
Relative abundance of fungal species at different taxonomic levels. a: Phylum; b: Class; c: Order; d: Family; e: Genus. C: Control group, S: Infection model group (Salmonella-infected), T: L. salivarius treatment group
To analyze differences in fungal composition between groups at the phylum and genus levels, multiple t-tests were performed. At the phylum level, statistical significance was observed in the relative abundances of Glomeromycota (p < 0.01) and Kickxellomycota (p < 0.05), with both being notably more abundant in the model group compared to the treatment group (Fig S5 a). At the genus level, compared to the control group, the model group exhibited a significant increase in Pseudeurotium, Ramicandelaber, Botryderma, Thermomyces, Acremonium, and Coniochaeta (p < 0.05). Similarly, compared to the treatment group, the model group showed a significant increase in Fusarium, Xenodidymella, Wallemia, Ramicandelaber, Botryoderma, Thermomyces, Acremonium, and Nigrospora (p < 0.05). Notably, the model group exhibited a statistically significant decrease in the relative abundance of Candida compared to the treatment group (p < 0.01) (Fig S5 a).
LEfSe analysis revealed the most abundant taxa distinguishing the three groups. At the genus level, the control group was characterized by Cercospora as the key differentiating species. In contrast, the model group was distinguished by Thermomyces, Botryoderma, and Acremonium, which were particularly notable genera. For the treatment group, Rhodotorula emerged as the unique species at the genus level (Fig. 8 ).
Fig. 8
Linear discriminant analysis effect size (LEfSe) and LDA scores for intestinal fungal microbiota. C: Control group, S: Infection model group (Salmonella-infected), T: L. salivarius treatment group
Comments (0)