
Remember me
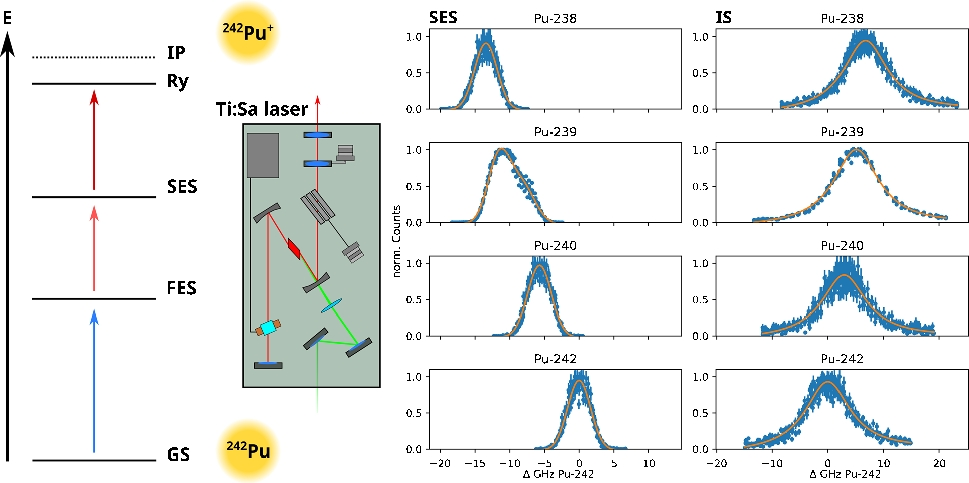
To scan the resonances for the transitions of each Pu isotope, two of three lasers were kept at a constant wavenumber while the third one was varied. Each resonance was scanned six times: three times from lower to higher wavenumbers and three times vice versa. The power of each step was reduced if necessary so little to no saturation broadening was observed. To retrieve the centroids of the resonances for the first and second excitation steps, the data was fitted with a single Gaussian curve plus a linear component for even isotopes and two Gaussian curves and a linear component for \(^\)Pu to account for the hyperfine structure. \(^\)Pu is the only Pu isotope in this study with a nuclear spin of \(I=1/2\). All the other isotopes have a nuclear spin \(I=0\). The centroid of the \(^\)Pu resonances was calculated by the sum of the centroids of the two Gaussian curves, weighted by the respective total area fraction. The ionization steps were modeled with a single Lorentzian curve and a linear component.
Table 1 shows the resonances observed for each excitation step. The results for \(^\)Pu as well as for the first excitation step of the other Pu isotopes are in excellent agreement with the literature [18, 20]. Furthermore, in some cases, we were able to improve the uncertainty. These resonances were then used in the subsequent saturation power and efficiency measurements. The optical isotope shifts of the different Pu isotopes in reference to \(^\)Pu are displayed in Fig. 3 and Table 2. Also included are the isotope shifts for the FES calculated from the resonances described in literature [20], which are in excellent agreement with the results from the measurements presented here as well.
Table 2 Isotope shifts for the first and second excitation (FES, SES) as well as ionizing step (IS) of \(^\)Pu in reference to \(^\)Pu observed in this work. Literature values for the FES were calculated from wavenumbers given in [20]Fig. 4
Measured saturation curves for the first excitation step (FES), the second excitation step (SES), and the ionizing step (IS) for the excitation schemes by Galindo-Uribarri et al. (blue) and Grüning et al. (orange) as well as the respective fit (dashed line). No saturation was reached for either scheme in the IS. Errors are calculated from the number of ions detected N via \(\sigma = \sqrt\). For the measurements of the Grüning et al. scheme, the error bars are small compared to the data point symbol
As both schemes compared in this work share the same first excitation step and as it was already known from literature [20], it is clear that it needs to be adjusted for each isotope to ensure maximum photoionization. For the newly measured isotope shifts of the second excitation step for the scheme proposed by Galindo-Uribarri et al., the difference between the resonance for \(^\)Pu and \(^\)Pu for the second excitation step is up to \(\approx \)20 GHz and for the ionizing step \(\approx \)10 GHz. That means even using Ti:Sa lasers with a linewidth of 6–8 GHz, it is not possible to photoionize all isotopes equally at the same time. By comparing the resonance positions shown in Fig. 3, it is evident that already for isotopes with overlapping resonances for the FES and SES and a relatively similar ionizing step, such as \(^\)Pu and \(^\)Pu, the excitation wavelengths need to be adjusted. Lasers tuned to the FES and SES of \(^\)Pu would not cover the whole resonances of \(^\)Pu, and therefore, the amount of \(^\)Pu would be underestimated. In the same scenario, all the other isotopes are not excited and would be lost in the analysis. Therefore, in a measurement of the isotopic ratio using the scheme by Galindo-Uribarri et al., the optical isotope shift cannot be omitted and all three lasers need to be adjusted to the respective isotope to ensure correct results. In case of the scheme by Grüning et al., the second excitation step needs also to be retuned for each isotope as well, but the ionizing step does not display a significant optical isotope shift and it is not necessary to adjust the laser for each isotope, therefore simplifying the measurement.
SaturationThe saturation curves for the FES, SES, and IS of the excitation schemes by Galindo-Uribarri et al. and Grüning et al. displayed in Fig. 4 were recorded by varying the laser power (P) of the excitation step in question via a neutral density filter while keeping the other two constant. Since the measurement of the IS required more datapoints in order to avoid influences caused by changes of the emittance from the sample over time, the measurement procedure was slightly adopted: Here, after every two data points, a reference measurement without attenuation of the laser beam was included to normalize the data. As mentioned in the setup section, after initial results indicated insufficient laser power for the IS, the measurements presented here were repeated with a new generation Ti:Sa laser driving the SES-Ry transition that was able to provide more power for the IS compared to the efficiency measurements. The FES and SES were still driven by the older generation Ti:Sa. The laser powers were measured (FES: PowerMax© model PM3 with Fieldmate powermeter, Coherent GmbH, Göttingen, Germany; SES, IS: PM-160T-HP, Thorlabs GmbH, Bergkirchen, Germany) directly in front of the entrance window of the source region. The intensity I was then modeled using Eq. 1 where \(I_0\) is the non-resonant contribution by the other excitation steps, A the maximum theoretically saturation amplitude, \(P_s\) the saturation power, and the term \(m\cdot P\) accounts for non-resonant ionization as well as the volume increase of the laser beam with the increase in power [19].
$$\begin I = I_0 + A\cdot \frac + m\cdot P. \end$$
(1)
Table 3 Resulting saturation powers \(P_s\) for the different excitation stepsTable 3 displays the resulting saturation powers \(P_s\).
For both schemes, the FES and SES reach saturation. Both schemes are using the same FES and only minimal laser power is required to saturate the transition. For the two different SES, more laser power is required, but also here a plateau is reached. In contrast, both schemes do not reach saturation in the IS. Here, an increase in laser power leads to a continuous increase in signal intensity and the fit, although converging, does not yield credible results. The foci of the laser beams had previously been adjusted for maximum signal intensity. To further investigate the unsaturated IS, the beam profile of the IS laser was measured to ensure a sufficient focus. Since measuring the beam profile directly inside the source region is not possible, the beam was diverted using a mirror and the beam profile camera (CinCam CMOS-1202-OM, CINOGY Technologies GmbH, Duderstadt, Germany) was placed at the same distance compared to the ionization volume. Analysis of the beam profile with a Gaussian fit using the software provided with the camera (RayCi-lite, CINOGY Technologies GmbH, Duderstadt, Germany) showed a circular distribution over an area of ca. 0.16 mm\(^\), resulting in an energy density of approximately 1 mJ mm\(^\) at 1.6 W and 10 kHz operation. That despite this high energy density no saturation was reached indicates that the laser interaction volume is too small. With the SES-Ry driving laser beam focused so strongly, it can no longer be assumed that the whole atom plume emitted from the sandwich type filament in the source region is sufficiently illuminated by this laser beam. If the beam diameter is only slightly increasing with the increasing power during the saturation curve measurement, a larger area of the atom plume is covered and more atoms are photoionized. Due to the perpendicular geometry of the laser interaction volume used in this work, the effect of a lack of energy density might be more pronounced compared to a co-linear setup, since there is less probability for an atom to interact with the photons. By applying such a co-linear laser beam geometry to illuminate a hot-cavity atom source, Galindo-Uribarri et al. determined a saturation power of 325(67) mW for the IS [18]. In addition to being more efficient for atomization, such a source provides a confined atom plume and therefore additionally increased atom-photon interaction probability. What also needs to be considered when comparing the saturation behaviors between the two setups is the actual ionization process from the Rydberg state. While in the source region used in this work most likely the only contributing ionization path is the electric field caused by the extraction electrode, in the hot-cavity-type source, other pathways, such as black-body radiation and collision, play a more dominant role [25].
Efficiency measurementsFor efficiency measurements, the samples were characterized via \(\alpha \) spectroscopy (detector: Ortec, Germany, model CR-SNA-450-100) to yield the exact amount of \(^\)Pu deposited. Figure 5 displays an exemplary spectrum recorded for one of the samples used in this study. Each sample was measured 3600 s. The detector was energy calibrated using \(^\)Gd and \(^\)Am. The detector efficiency of 0.146(15) was determined using a certified \(^\)Am standard (Amersham Büchler GmbH & Co KG, Braunschweig, Germany, reference no. 9454).
Fig. 5
\(\alpha \) spectrum of a \(^\)Pu sample used in this work to quantify the RIMS efficiency. The red dashed lines indicate the range for which the signal was summed up. All six samples used in this work were measured 3600 s using the same Si detector. Errors are calculated from the number of events detected N via \(\sigma = \sqrt\)
Fig. 6
Excerpt of the mass spectrum of a \(^\)Pu efficiency sample with lasers tuned to the optical transitions for \(^\)Pu using the scheme by Grüning et al. A strong signal for \(^\)Pu is observed which is near-resonantly ionized due to the width of the lasers and the broadness of its transitions. The origin of the \(^\)Pu is most likely from a contamination of the electrolysis cell or the \(^\)Pu stock solution and was not observed via \(\alpha \) spectroscopy. Errors are calculated from the number of ions detected N via \(\sigma = \sqrt\). However, the error bars are too small compared to the data point symbol
Table 4 Measured efficiencies using the three-step excitation schemes by Grüning et al. and Galindo-Uribarri et al. The amount of electrodeposited \(^\)Pu was quantified via \(\alpha \) spectroscopy. Errors for RIMS measurement are \(3\cdot \sqrt+3\cdot \sqrt}}\). No difference in efficiency was observed between the two excitation schemesFor the efficiency measurements by RIMS, the samples were heated until a first signal for \(^\)Pu at around 650 \( ^\text \) was observed. Afterwards, a sequence was programmed in which all lasers were tuned to the resonances observed for \(^\)Pu for 120 s before the first excitation step was detuned for 5 s to record the background. The sample was heated further up during the recording of the background whenever a drop in the count rate was observed. This process was continued until the sample was no longer emitting \(^\)Pu, up to around 1200 \( ^\text \). Before each measurement, the laser power and beam overlap were checked to ensure comparability and consistency. Laser powers during the efficiency measurements for the FES were 80 to 85 mW, the SES 400 to 600 mW, and the IS 1.1 to 1.2 W.
As displayed in Fig. 6, a strong signal of \(^\)Pu was observed in addition to \(^\)Pu indicating a contamination of either the electrolysis setup or the \(^\)Pu stock solution. \(^\)Pu was not observed via \(\alpha \) spectroscopy of the filaments due to the lower specific activity. Due to the small isotope shift between \(^\)Pu and \(^\)Pu and the width of the Ti:Sa laser light of up to 8 GHz, \(^\)Pu is partly ionized even when the lasers are tuned to the resonances of \(^\)Pu. This was observed for both excitation schemes by Grüning et al. as well as by Galindo-Uribarri et al. Nevertheless, the mass signals are sufficiently separated in the mass analyzer, and the detection efficiency of \(^\)Pu could be determined.
As shown in Table 4, no difference in efficiency was observed between the two excitation schemes using the same setup. Variations in the absolute value for a single measurement can be attributed to slight variations in the laser power during the measurements. Here, it becomes evident that a different excitation scheme alone does not necessarily result in an increased efficiency on different RIMS setups. As already discussed for the saturation curves, due to the co-linear layout and the hot-cavity source used in [18], the total ionizing volume, as well as the atom-photon interaction and subsequent ionization probability from the Rydberg state, are much larger compared to the perpendicular laser beam geometry and sandwich type filament applied in this work. Additional factors contributing to the overall measurement efficiency are the atomization in the source as well as the total ion transmission of the MS. However, an increase of the efficiency using the scheme by Grüning et al. by a factor of \(\approx \)2-3 compared to the original measurements that were performed on the same setup in 2004 [20] was observed. This can be attributed to the higher laser powers possible by introducing the laser light directly into the source region of the mass spectrometer and not via an optical fiber, as well as the increased repetition rate of the lasers from 6.6 to 10 kHz. Another factor might be that the amount of Pu deposited on the filaments was directly quantified via \(\alpha \) spectroscopy.
Comments (0)