
Remember me
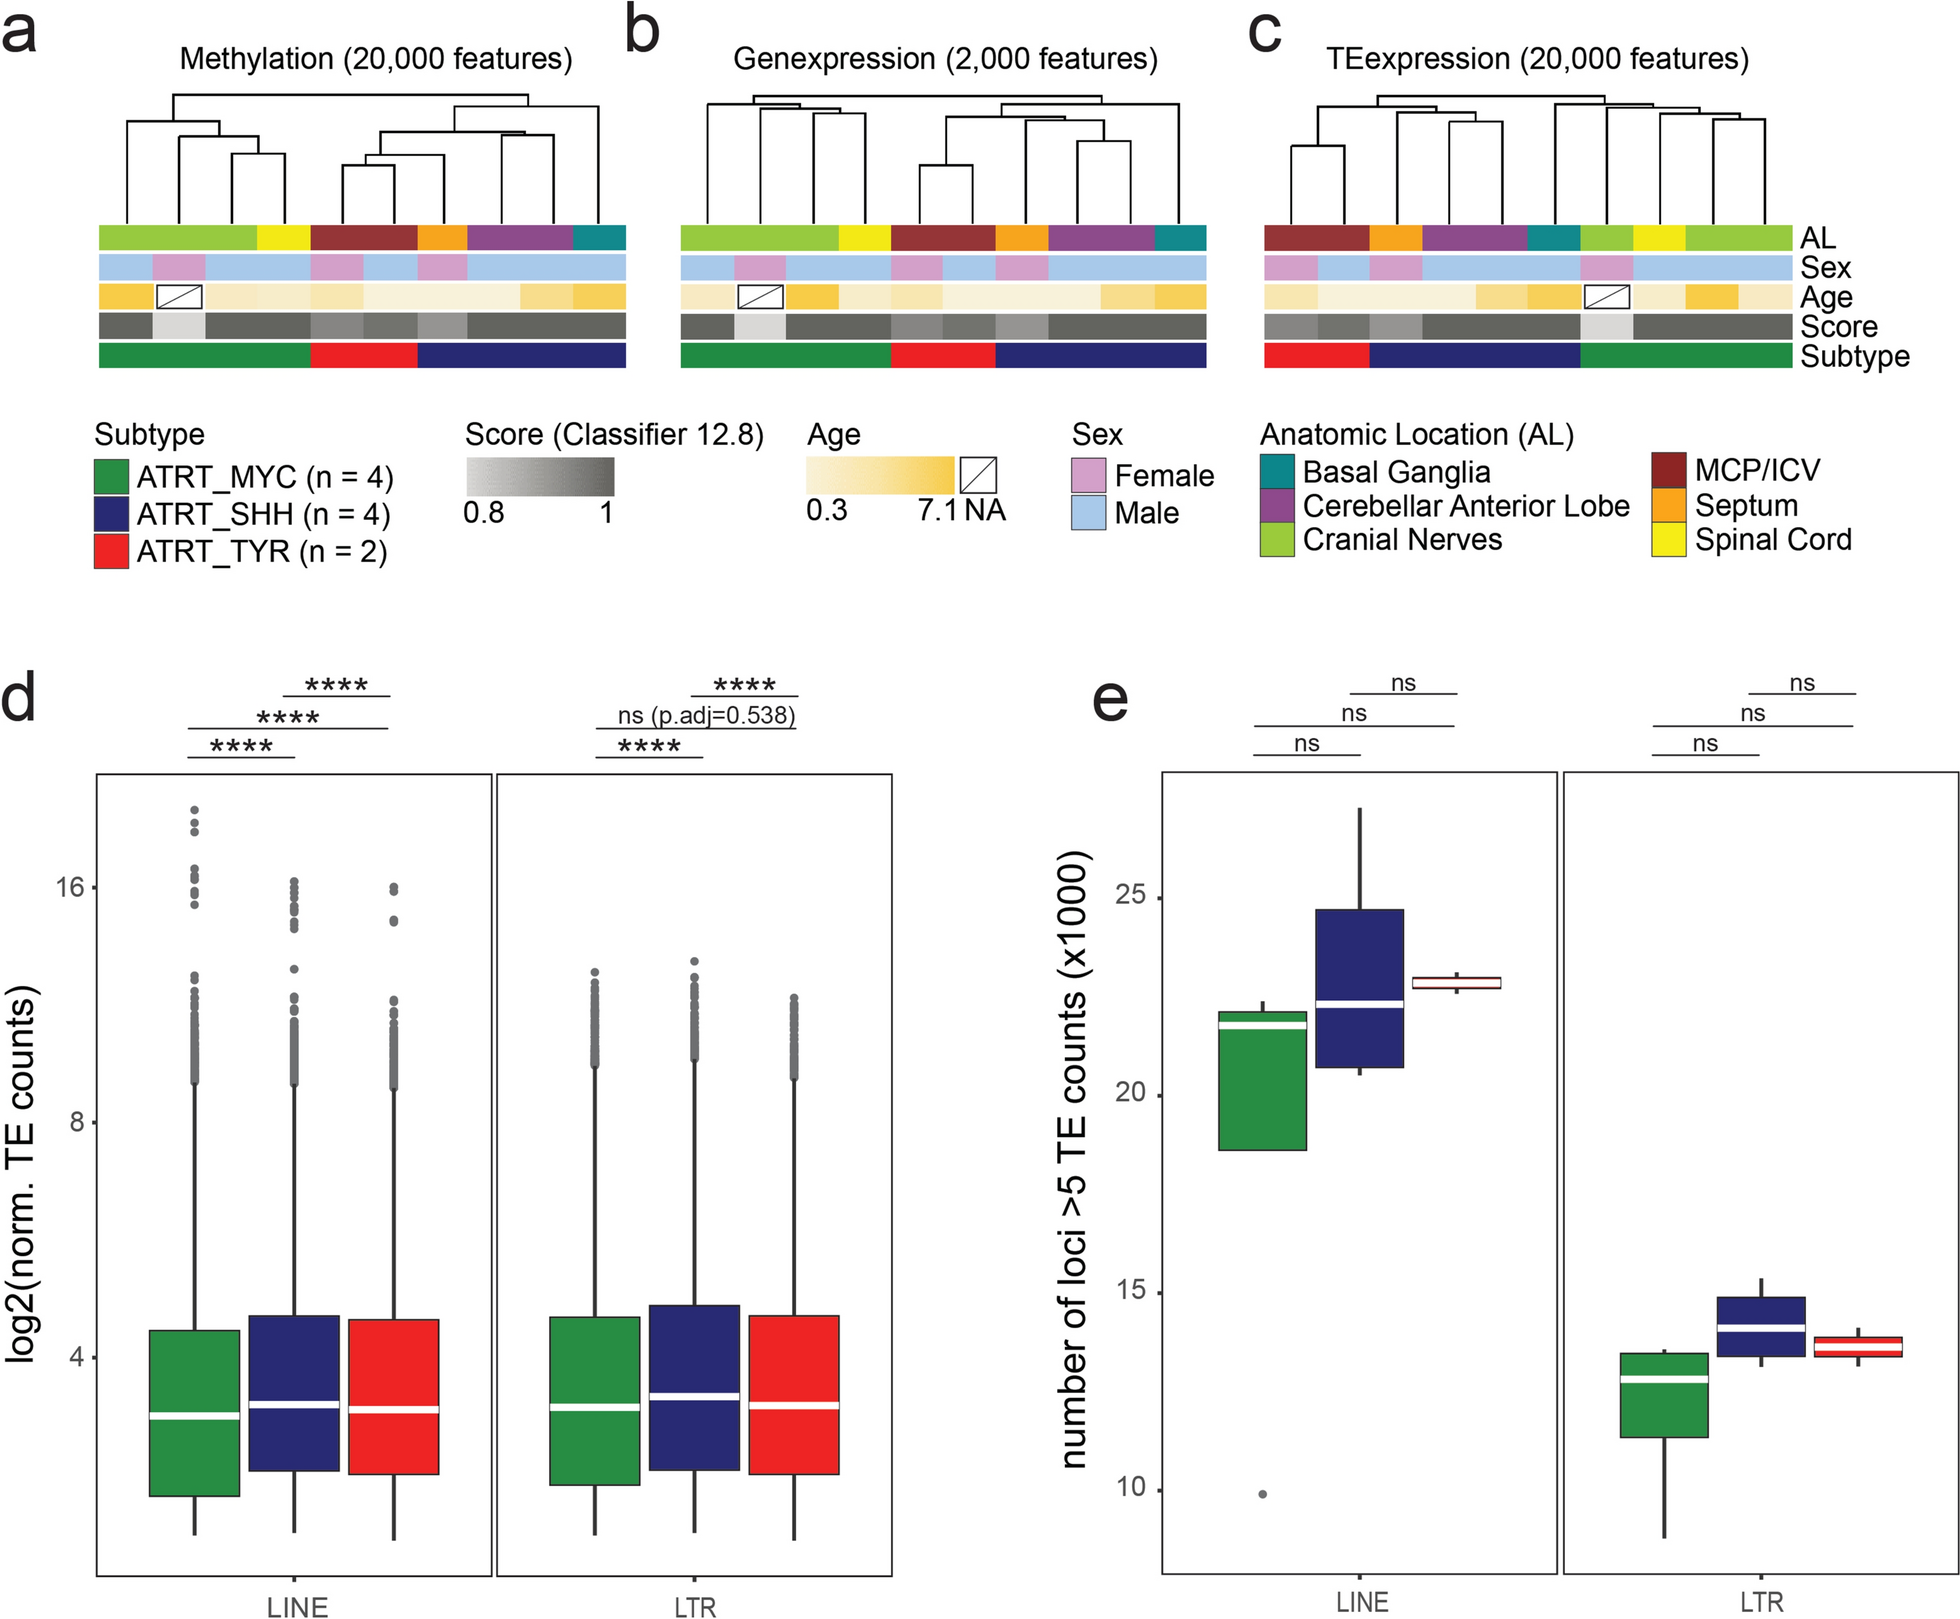


We set out to determine the TE transcription profiles in ATRT-MYC, -TYR and -SHH tumors at subfamily and locus-level resolution. Our analysis is based on a set of primary human ATRT samples [9, 41], that had been stratified for tumor subtype by their DNA methylation pattern using the DKFZ brain tumor methylation-based classification [56]. In Fig. 1a–c we present the clinical information about the CNS anatomic location of the primary tumor diagnosis based on magnetic resonance imaging (MRI), sex and age along with additional meta-data of the classifier score (Classifier version 12.8) and ATRT subtype. We have obtained samples with matching transcriptome and DNA methylation data (n = 10) for further analysis [9, 41]. RNAseq samples were processed for locus-specific analysis of TE transcripts. This sample subset comprised all three ATRT subtypes (2 × TYR, 4 × MYC, 4 × SHH). We used the RepeatMasker (hg38) annotation of TEs, and focused our analysis on LINE1 and LTR entities as the main source of TE-derived transcripts. LTR elements are further classified into ERV1, ERVL, ERVK and ERVL-MaLR families. In addition, LTR and LINE1s, comprise several hundred subfamilies, which are summarized in Supplementary Table 1. Overall, our annotation includes 792,000 LTR and 1.19M LINE1 genomic elements.
Fig. 1
Primary samples show ATRT subtype clustering based on TE transcription profiles. Unsupervised hierarchical clustering of a DNA methylome beta values (20,000 most variable CpGs), b gene transcription (2,000 most variable genes) and c TE transcription (20,000 most variable transcripts). ATRT subtype classification based on DNA methylome analysis by Capper et al., 2018 [56]. d Normalized read counts from loci with at least 5 mapped reads. Median read count is indicated as white bar. e Number of expressed TE loci with at least 5 mapped reads. Statistical analysis one-way ANOVA with post-hoc Tukey’s Honest Significant Differences (HSD) test. **** p < 0.00001
As a first step, we validated the datasets based on DNA methylation array and gene transcriptome analysis. Unsupervised hierarchical clustering based on DNA methylome data confirmed grouping of the samples into the established ATRT subtypes (Fig. 1a). Regarding their overall gene transcriptome profile, the samples showed clustering into ATRT subtypes analogous to their methylome profile (Fig. 1b).
To investigate gene transcriptomic signature in further detail, we undertook differential gene expression (DEG) analysis between the established ATRT subtypes. This yielded ATRT subtype-specific gene expression (Suppl. Figure 1a), with 223 differentially expressed genes across all three ATRT subtypes (MYCDEG = 69, SHHDEG = 65, TYRDEG = 89). We particularly observed a set of subtype-specific genes (MYC/TYR/SHH-cluster-genes) that were transcriptionally active specifically in one ATRT subtype (Suppl. Figure 1a). We cross-referenced the results to 42 previously-described ATRT subtype transcriptional active signature genes and observed that the transcriptomic datasets reliably reflected these differences (Suppl. Figure 1b) [5, 6, 8, 57,58,59,60,61].
In summary, these results show validity of described transcriptomic datasets for our analysis. We therefore proceeded to assess genome-wide transcriptional activity of TEs. Regarding overall TE transcriptome profiles, we observed ATRT subtype-specific clustering that mirrored DNA methylation and gene transcription-based analysis (Fig. 1c). ATRT subtypes can thus be defined by the genome-wide signature of TE transcriptional activity analogous to profiling by DNA methylation or gene transcription data (Fig. 1a–c).
TEs are distributed across the entire genome, with 43% of elements positioned within gene bodies and around 25% positioned at over 50kb distance of the next gene transcriptional start site (TSS). We asked if positioning of TEs relative to genes could affect the observed TE-transcriptome based ATRT subtype specific signature. We therefore grouped all elements into TE subsets with a) TE within in genes (43.6%), b) TEs up to 10 kb upstream of an annotated transcriptional start site (TSS) (7.1%), c) TEs between 10 to 50 kb upstream of a TSS (24.2%) and d) TEs > 50 kb upstream of a TSS (25.2%) (Suppl. Figure 2a). Principal component analysis (PCA) based on any of our defined TE subsets showed a consistent separation of the ATRT subtypes along the first two principal component vectors, reflecting PCA based on all TEs or gene transcripts (Suppl. Figure 2a). The ATRT TE transcriptome thus reflects the tumor subtype-specific functional genome faithfully independent of the genomic position of the TE entities.
We next went on to analyze the ATRT TE transcriptome in further detail, focusing on differences in total TE-derived transcript counts and number of transcribed TE loci between ATRT subtypes. Notably, the SalmonTE pipeline aligns reads to TE coding strand and thus is not skewed by anti-sense read mapping. To minimize the impact of loci with low number of mapped reads in our analysis we considered TE loci with a normalized read count of at least 5 (Fig. 1d, e) [62]. Results were stratified by TE class, namely LINE1s and LTRs. ATRT-MYC subtype showed the lowest transcriptional activity on average both for LINE1s (log2(median ± SD): MYC 3.37 ± 1.3, SHH 3.48 ± 1.35, TYR 3.43 ± 1.34) and LTR elements (log2(median ± SD): MYC 3.45 ± 1.38, SHH 3.56 ± 1.38, TYR 3.47 ± 1.35) (Fig. 1d). Similarly, ATRT-MYC tumors showed a trend towards the least amount of actively expressed loci again both for LINEs (median ± SD: MYC 21,778 ± 6,047; SHH 22,316 ± 3,170; TYR 22,855 ± 384) and LTR elements (median ± SD: MYC 12,821 ± 2,229; SHH 14,113 ± 1,048; TYR 13,636 ± 689) (Fig. 1e). Taken together, ATRT-MYC subtypes are characterized by significantly less LINE1 and LTR transcripts that tend to be derived from fewer TE loci.
We next went on to define expression of LTR and LINE1 elements at subfamily level in the three ATRT subtypes (Fig. 2) Our analysis focused on TE subfamilies with at least 5 aligned reads on average in at least one ATRT subtype and we plotted data according to expression level (relative mean of all expressed elements per subfamily; Fig. 2) and percentage of expressed TE loci per subfamily (occurrence score: Suppl. Figure 3 and Suppl. Figure 4). Our analysis revealed that ATRT subtypes differ considerably in LTR and LINE1 subfamily expression. We see consistently lower expression of most LINE1 subfamilies in ATRT-MYC tumors compared to ATRT-SHH and -TYR subtypes. We also observe that ATRT-MYC tumors show an expression pattern that somewhat opposes the pattern observed in ATRT-SHH and -TYR subtypes: LTR and LINE1 families that show higher expression levels in the MYC subtype are expressed at lower levels in ATRT-SHH and -TYR and vice versa (Fig. 2, Suppl. Figure 3 and Suppl. Figure 4). Occurrence scores of TE loci ranged from 0.3 to 6% across all subfamilies, indicating that individual elements are transcriptionally active rather than entire subfamilies (Suppl. Figure 3 and Suppl. Figure 4).
Fig. 2
Differences in TE transcription at subfamily level. Relative normalized TE counts were summarized at TE subfamily level, including elements with at least 5 mapped reads on average in at least one ATRT subtype. TE subfamilies were ordered from low to high for their expression level in ATRT-MYC. Subfamily names and occurrence scores are provided in Suppl. Figure 3 and Suppl. Figure 4
In summary, our analyses demonstrate that ATRTs show a characteristic TE transcription signature that likely reflects tumor subtype-specific transcriptional regulation of TEs. Overall, ATRT-MYC tumors show the lowest counts of TE-derived transcripts and the lowest number of transcribed TE loci. At TE subfamily level, ATRT-MYC stand out from ATRT-SHH and -TYR subtypes demonstrating a contrary expression pattern. Thus, ATRT identity is defined not only by a characteristic gene transcriptional program, but also by characteristic activity of LTR and LINE1 genomic elements.
ATRT subtypes are marked by specifically transcribed TE lociWe next focused our analysis to locus-level resolution comparing ATRT subtypes. We identified 383 differentially expressed (DE) LTR and 466 DE LINE1 loci (Fig. 3a, b, cutoffs log2FC >|0.5|, padj < 0.05). Each ATRT subtype showed transcription of a characteristic cluster of LTR elements (MYCLTR 34; SHHLTR 175, TYRLTR 174) and LINE1 elements (MYCLINE1; SHH LINE1 190, TYR LINE1 212), which we termed MYC-, SHH- and TYR-cluster. TEs (Fig. 3a, b). These subtype-specific cluster elements showed a significantly different composition with regard to LTR families (Suppl. Figure 5a) and LTR/LINE1 subfamilies (Suppl. Figure 5c, d, χ2 = 17.533, Fisher p value = 0.0075). In particular, ERVL-MaLR elements were overrepresented in MYC and SHH clusters, and ERV1 elements were overrepresented in the TYR cluster.
Fig. 3
Differential TE transcription analysis. Differential LTR (a) and LINE1s (b) with cutoff log2FC >|1| and p adj < 0.05. Unsupervised hierarchical clustering of samples and elements reveals ATRT subtype-specific differentially transcribed LTRs and LINE1s, respectively (termed ‘cluster.TEs’)
In order to assess whether cluster.TEs represent selected TEs regarding their genomic position in relation to human genes, we grouped TEs in bins with increasing genomic distance to the closest gene transcriptional start sites (bins identical as presented in Suppl. Figure 2a). We compared the frequency of cluster.TEs to the number of all transcribed elements (including non-differentially expressed loci). We observed for all subtype clusters that LTR elements residing within genes were over-represented in ‘cluster.TEs’ compared to their frequency in all transcribed TEs (Fig. 4a). In contrast, differential transcribed LTRs elements residing > 50 kb upstream of a TSS were consistently under-represented in all three ATRT clusters (Fig. 4a). Differentially expressed LINE1s showed a different profile in the context of genomic location (Fig. 4b). Gene- and proximal-to-gene residing LINE1 elements of the MYC-cluster were consistently under-represented. In contrast, distal LINE1 elements (> 50 kb distance to TSS) were over-represented in MYC-cluster.LINE1s, reflecting a marked distinction of TE transcription profiles of ATRT-MYCs compared to ATRT-SHH and –TYR. Taken together, each ATRT subtype is defined by an individual transcriptional signature of TE loci (‘cluster.TEs’).
Fig. 4
Active TEs in context of genomic distance to gene transcriptional start sites. Active clusterTEs in relation to their genomic distance to gene transcriptional start sites for LTRs (a) and LINE1s (b), respectively. Actively transcribed elements = “yes” (turquoise), not transcribed = “no” (red). “E” indicates the observed frequency taking all transcribed LTR/LINE1s into account. c Correlation analysis of gene and TE transcription for ATRT.clusterTEs residing within gene bodies. Normalized counts, excluding TEs and genes with zero counts. Pearson correlation and p value indicated
As about half of the transposable elements reside within genes (in introns) and 85–90% of all human genes contain TEs [63], elevated TE transcription could be a consequence of increased gene expression. To investigate this, we correlated the transcription level of ‘cluster.TEs’ with the transcription level of the genes they reside in. We find statistically significant correlation for all three ATRT subtypes and their respective cluster TEs (Fig. 4c), indicating that gene transcription can influence TE transcription and vice versa.
ATRT cell line models partially reflect the TE transcription signature of primary ATRTsMechanistic studies on ATRTs often rely on ATRT-derived cell line models. These cell lines have been associated to ATRT subtypes based on DNA methylome and transcriptome data, which show good correlation when compared to each other [8]. We therefore asked whether observed TE transcript signatures in primary ATRT samples are reflected in ATRT cell lines. Since ATRT-TYR generally lacks established cell line models, we focused on BT12, BT16 and CHLA06 cell lines for ATRT-MYC-type and CHLA02 cells as an ATRT-SHH-type model (cell line association with tumor subtype based on literature [8, 64]). PCA based on all gene transcripts showed high diversity between cell lines and no clear grouping according to tumor subtype (Fig. 5a upper panel). PCA based on TE transcripts mirrored this result (Fig. 5a lower panel). Notably, as seen for primary ATRT samples, TE transcriptome profiles in PCA resemble gene transcriptome profiles, supporting the notion that TE transcriptomes are tumor-type specific (refer to Fig. 1a–c, Suppl. Figure 2b). As for the quantity of TE transcripts, cell models show comparable levels to primary ATRT samples (average log2(median) transcripts 3.46 and 3.33 in primary and cell line data, respectively). However, TE transcripts in cell line samples are derived from fewer loci compared to primary data (average loci number 17,920 and 11,892 in primary and cell line datasets, respectively). Among cell line datasets, ATRT-MYC shows significantly lower LINE1 transcript levels compared to ATRT-SHH (log2(median ± SD): MYC 3.25 ± 1.23; SHH 3.27 ± 1.13), consistent with our analysis in primary samples (Fig. 5b). Interestingly the opposite trend applies for LTR transcripts. Here, ATRT-MYC cell line samples show more transcripts compared to ATRT-SHH (log2(median ± SD): MYC 3.40 ± 1.39; SHH 3.39 ± 1.22), which is reflected across the three LTR families ERV1, ERVL and ERVL-MaLR (Fig. 5b). Regarding the number of expressed TE loci, cell lines are consistent with primary data in that ATRT-MYC shows a trend in expressing fewer LINE1 and LTR loci compared to ATRT-SHH (median ± SD; LINE1: MYC 13,599 ± 2,102; SHH 15,506 ± 2,507; LTR: MYC 9,026 ± 1,141; SHH 9,437 ± 944) (Fig. 5c).
Fig. 5
TE transcriptional profiles in established cell models of ATRT-MYC and –SHH. Comprehensive LTR and LINE1 transcriptional profiling for three ATRT-MYC cell lines (BT12, BT16, CHLA.06; n = 3 each) and ATRT-SHH cell line CHLA.02 (n = 3). Cell line assignment to ATRT tumor subtype based on literature consensus. a Principal component plot for 500 most variable gene and TE transcripts, respectively. b Overall transcript abundance for TE classes LINE1 and LTRs, as well as LTR families ERV1, ERVK, ERVL and ERVL-MaLR. Elements with at least 5 transcript counts included. Median transcript level indicated by white bar. c Number of active LINE1 and LTR loci, respectively. Loci with at least 5 transcript counts included. Median indicated by white bar. Statistical analysis in b and c one-way ANOVA with post-hoc Tukey’s Honest Significant Differences (HSD) test. ****p < 0.001, ***p < 0.01, *p < 0.05. d Differentially expressed genes contrasting ATRT-MYC versus ATRT-SHH. Cutoff thresholds log2FC >|2|, padj < 1 × 10E-06. e Number of differentially expressed genes and differentially transcribed TEs in cell lines vs primary samples and their respective overlap. Thresholds log2FC >|2|, padj < 1 × 10E-06 for DEGs and log2FC >|1|, padj < 0.05 for DE TEs
Differential gene expression analysis between MYC and SHH cell line models revealed 219 up- and 564 downregulated genes (log2FC >|2|, p < 10E-06) (Fig. 5d) and 103/107 up- and downregulated TEs, respectively (Supplementary Table 2). Compared to data from primary ATRTs, cell line datasets yielded a fractional overlap of differentially expressed genes in MYC versus SHH (23 shared DEGs and 51 shared TEs between cell lines and primary samples, Fig. 5e, Supplementary Table 3 and 4). Taken together, these results show that ATRT cell line models, in particular for ATRT-MYC subtype are heterogenous regarding their overall gene and TE transcriptome. Furthermore, they only partly reflect transcriptomic subtype differences of primary ATRT samples.
We next asked, to what extent ATRT-MYC and -SHH cell lines reflect the subtype-specific ‘cluster.TE’ signature, as defined by our analysis of primary ATRT sample datasets (refer to Fig. 3a, b). PCA combining both primary and cell line datasets revealed co-clustering of both dataset entities according to their ATRT subtype when considering the “sample type” parameter as a co-variate in batch correction of the data (Fig. 6a, b). This indicates that distinct differences in gene and TE transcription profiles exist, allowing differentiation into ATRT subtypes. Next, we focused on all MYC and SHH defining ‘cluster.TEs’ from primary ATRT samples (see Fig. 3). We found 20 LTR and 43 LINE1 elements from the MYC.TE cluster and 157 LTR and 140 LINE1 elements from the SHH.TE cluster to be expressed in the ATRT-MYC and –SHH cell line datasets analyzed before (refer to Fig. 5). We then plotted their cell line expression values using unsupervised hierarchical clustering (Fig. 6c, d). This showed a clear clustering of cell line samples according to tumor subtype. In detail, we found that 70% of SHH-defining cluster.LTRs (53% of cluster.LINE1) show consistent transcription in the SHH cell line, and 65% of MYC-defining cluster.LTRs (70% of cluster.LINE1s) are consistently transcribed in the MYC cell lines (χ2 test: LTRs χ2 = 8.632, P = 0.003; LINEs χ2 = 5.875, P = 0.015). Taken together, these data demonstrate that the subtype-defining TE expression signatures of primary ATRT samples are partially reflected in ATRT cell line models, allowing for use of these models in future studies that focus on TE activity in ATRT biology.
Fig. 6
Combined analysis of primary and cell model transcriptome data. a and b Principal component plot for 500 most variable gene and TE transcripts integrating data with co-variate correction for “sample type”. Unsupervised hierarchical clustering of MYC- and SHH- ‘clusterTEs’ (based on primary ATRT data) found transcribed in the cell line data for LTRs (c) and LINE1s (d)
TE transcription in ATRT subtypes as potential driver for tumor immunogenicityExpression of TEs has been associated with tumor immunogenicity through TE-derived promoter activity, TE peptide expression or activation of innate immune responses through TE transcripts [65,66,67]. In ATRTs, bidirectional transcription of LTR elements has been suggested to drive interferon responses through double-stranded RNA-mediated sensing in MYC subtypes [20]. We therefore set out to investigate whether TE transcriptome-associated immunogenicity features differ across ATRT subtypes. We first studied bidirectional expression levels of LTRs and LINE1s in primary ATRT samples. To do so, we processed transcriptomics datasets for TE transcript counts in the sense and antisense direction at locus-level resolution (see Material and Methods). We observed significant differences in bidirectionally transcribed TE loci between ATRT subtypes: As already observed for sense transcription (see Fig. 1e), ATRT-MYC tumors showed the lowest number of active LINE1s and LTR loci with bidirectional activity, while ATRT-TYR samples show the highest number (Fig. 7a, b). The overall levels of bidirectional TE-derived transcripts were similar between all three ATRT subtypes. However, ATRT-MYC tumors showed a tendency for increased levels of LTR and decreased levels of LINE1s bidirectional transcripts compared to ATRT-SHH and -TYR cases (Fig. 7c, d). Thus, while tumors of the ATRT-MYC subtype have fewer active LTR loci that show bidirectional transcription, these loci appear to have higher transcriptional activity compared to other subtypes.
Fig. 7
Bidirectional transcription from LTRs and LINE1s in ATRT subtypes and protein-coding potential. a and b number of LTR and LINE1 loci in ATRT subtypes with bidirectional transcriptional activity. c and d transcript levels of LTR and LINE1 loci with bidirectional transcription. Statistical test one-way ANOVA. Active clusterTEs with protein-coding potential according to literature for LTRs (e) and LINE1s (f), respectively [68]. Actively transcribed elements = “yes” (turquoise), not transcribed = “no” (red). “E” indicates the observed frequency taking all transcribed LTR/LINE1s into account
Since TE-derived peptides, as tumor-specific antigens, have also been associated with tumor immunogenicity, we secondly investigated the expression levels of potentially protein-coding TEs in the primary ATRT samples. LTR and LINE1 loci with putative open reading frames for peptide or protein expression were selected based on a published dataset and cross-referenced to the TE annotation that was used for transcriptome analysis [68]. We observe a prominent over-representation of potentially protein-coding LTR elements in ATRT-SHH and -TYR subtypes (Fig. 7e) and a minimal over-representation of potentially protein-coding LINE1 elements in ATRT-MYC (Fig. 7f) in relation to all expressed TEs, indicating another differential characteristic between ATRT subtypes with potential implications for effective immunotherapy.
Comments (0)