
Remember me


Brain cortical tissues from the superior, middle or inferior temporal gyrus were collected from 18 SD patients with confirmed FTLD-TDP type C pathology and 25 NDCs (Additional File 1). NDC and SD groups did not differ significantly based on their age at death, sex, and CSF pH (data not shown). As expected in neurodegenerative disorders, the post-mortem brain weight was lower in SD patients (median = 945 g) than in NDCs (median = 1,231 g) (p-value = 2.59e-07). In addition, post-mortem duration (PMD) of SD patients (median = 325 min) was shorter than of NDCs (median = 475 min) (p-value = 0.0112).
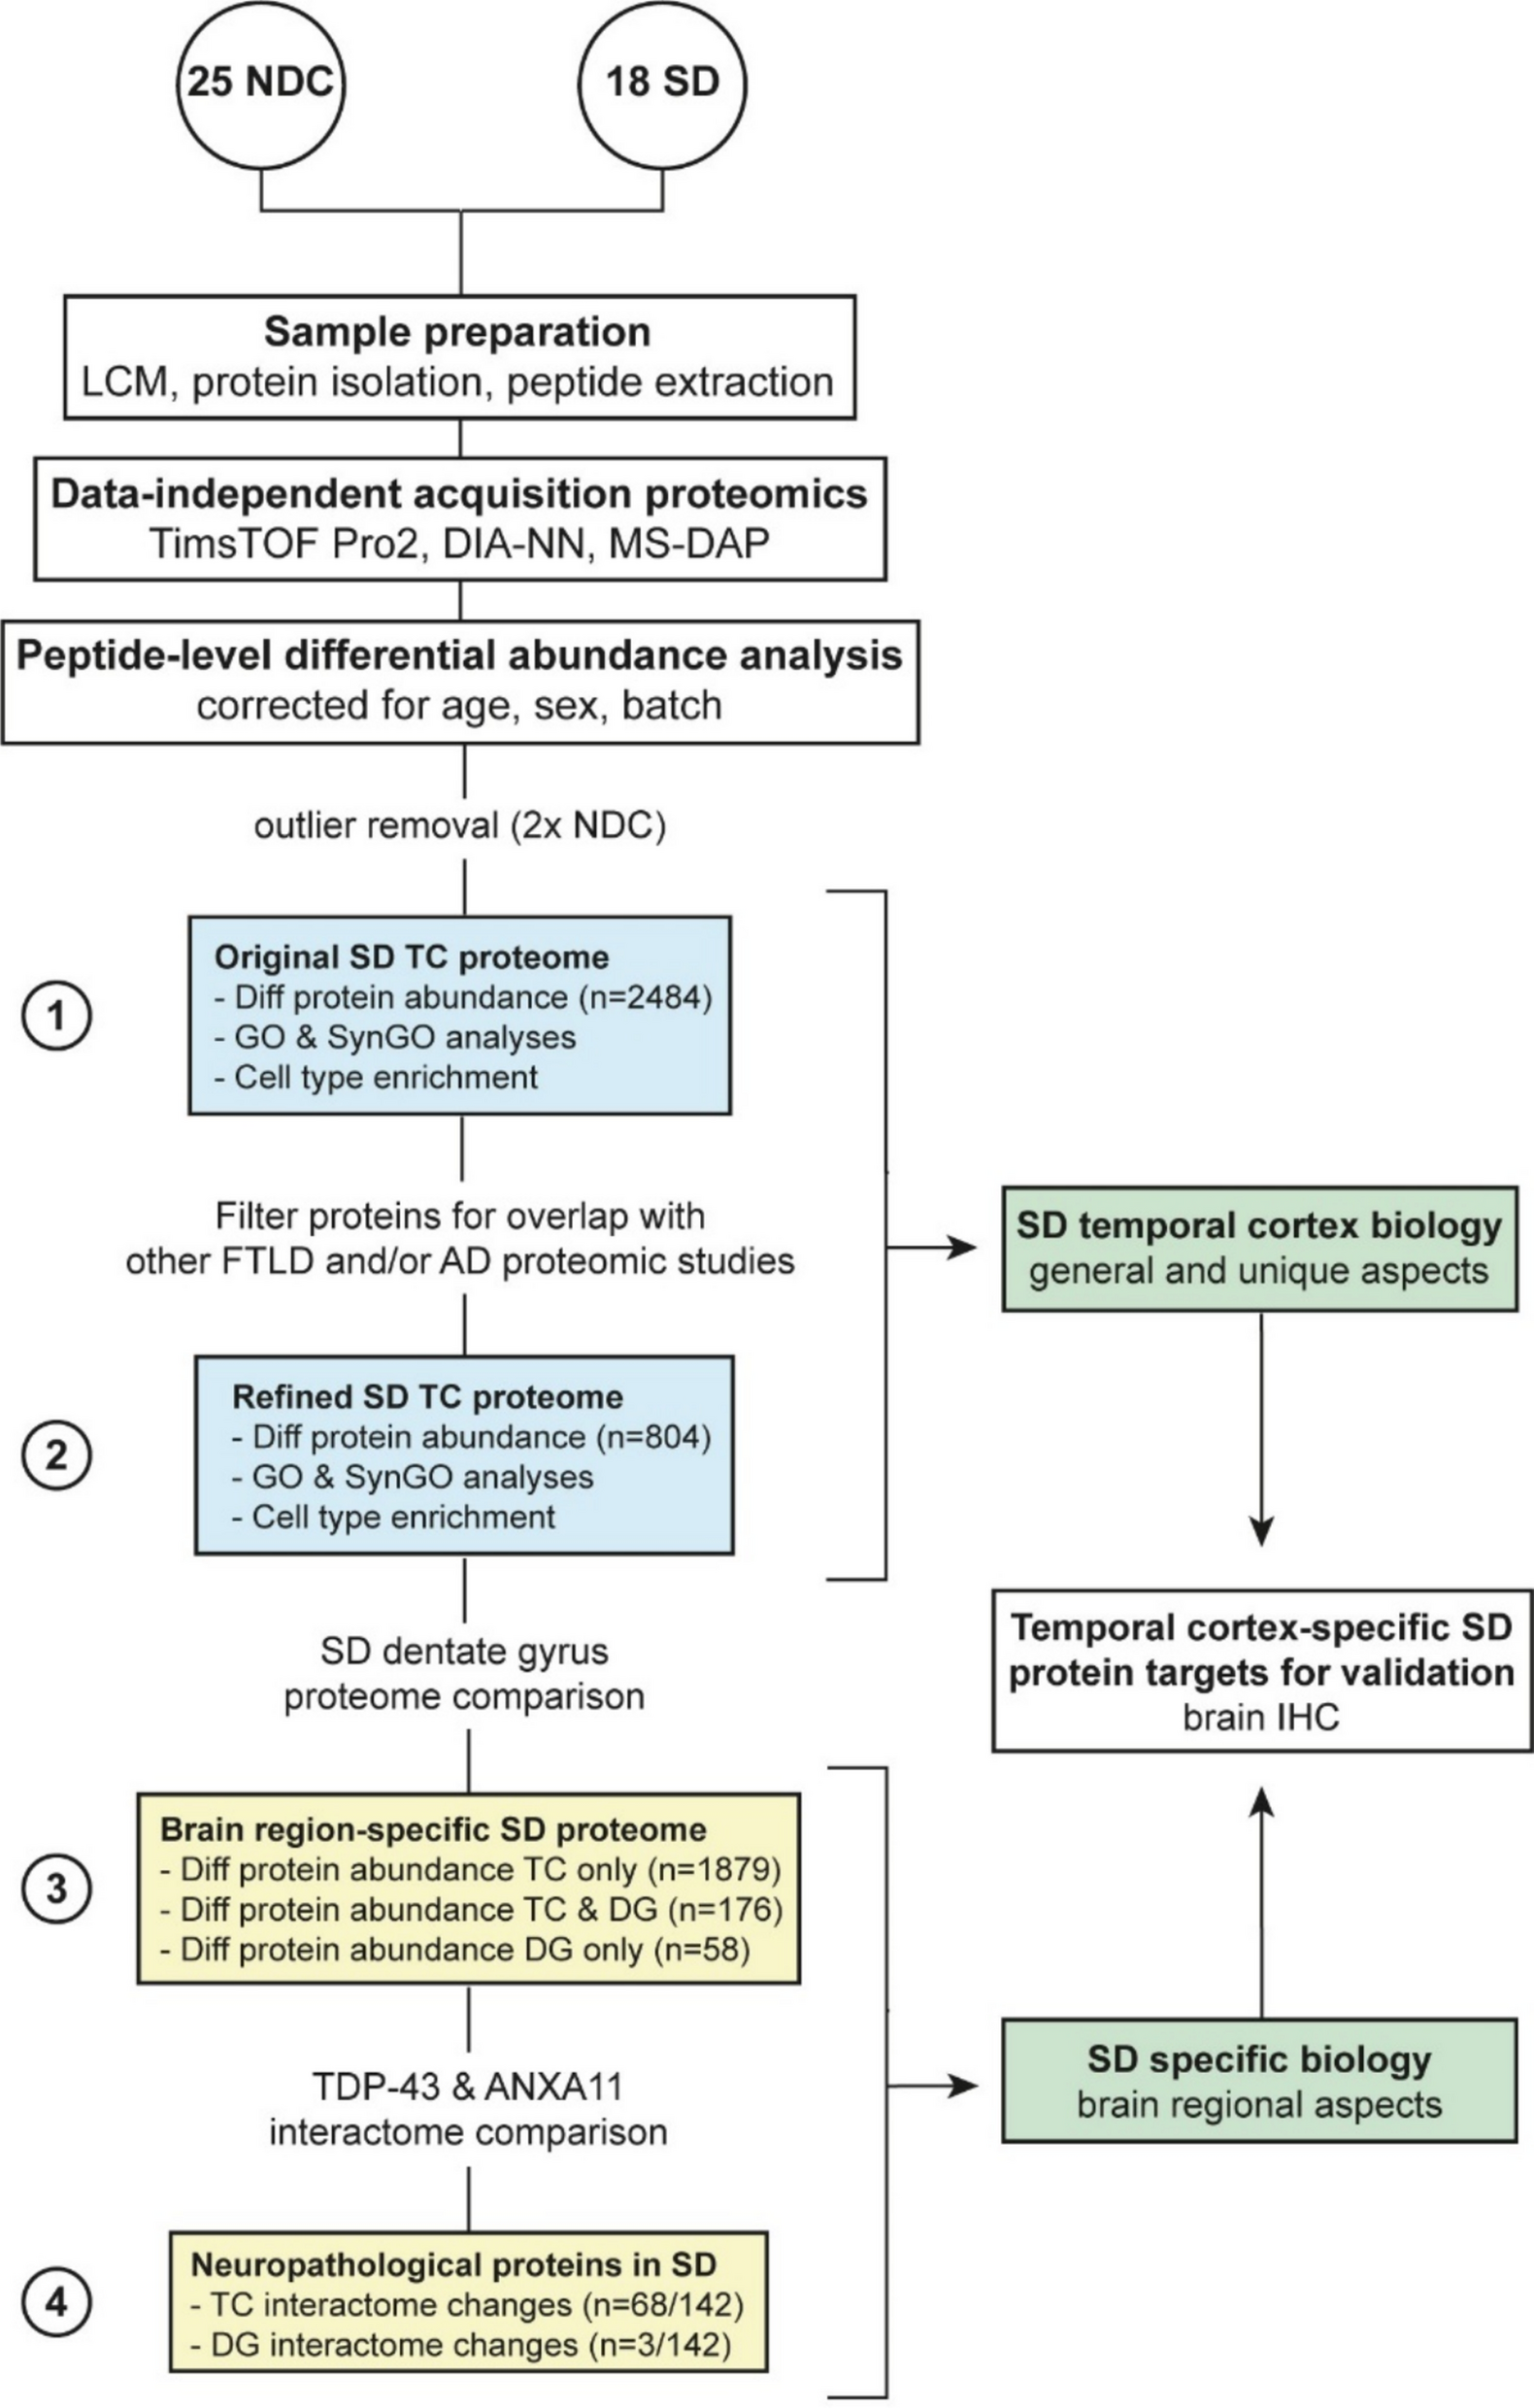
Proteomic signature of SD temporal cortex shows abundant differencesTo investigate quantitative proteomic changes, we used DIA LC–MS/MS proteomics on temporal cortical grey matter brain tissue. A schematic overview of the workflow and data analysis steps in this paper is presented in Fig. 1. In short, (1) we first assessed the proteomic signature of the temporal cortex in SD. To focus on protein change aspects specific to SD, (2) we refined the proteome by filtering out proteins that were shared with other FTLD subtypes and/or AD. To investigate brain region-specific protein changes in SD, (3) we compared the SD temporal cortex proteome to our previously generated SD dentate gyrus proteome. Lastly, (4) we specifically focussed on the role of neuropathological proteins TDP-43 and ANXA11 in both brain regions in SD. From these different detailed assessments, we selected several protein targets that appeared to be unique to the SD disease process in the temporal cortex region for validation study in a post-mortem neurodegenerative brain cohort.
Fig. 1
Schematic of the workflow and protein selection steps. Using published FTLD and AD proteomic literature we were able to refine our SD temporal cortex proteome towards SD unique aspects: proteins involved in common neurodegenerative processes or other FTLD disease subtypes were filtered out to enable focus on the SD disease process. Comparison to our recent SD dentate gyrus proteome enabled the study of brain-region specific aspects of the SD disease process, in which we also put additional emphasis on the role of neuropathological proteins TDP-43 and ANXA11. From these bioinformatic analysis we selected several SD temporal cortex-specific targets of interest for further validation using immunohistochemical analysis of post-mortem brain tissue. AD, Alzheimer’s disease; DG, dentate gyrus; Diff, differential; FTLD, frontotemporal lobar degeneration; GO, gene ontology; IHC, immunohistochemistry; LCM, laser capture microdissection; NDC, non-demented control; SD, semantic dementia; SynGO, synaptic gene ontology; TC, temporal cortex
In the temporal cortex SD proteome we detected abundances of 50,350 unique peptides. Quality analysis showed that two NDC samples were clear technical outliers with low peptide elution levels. After removal of these samples, filtering yielded 30,417 unique peptides, mapping to 4978 unique protein groups that were consistently measured across the 41 samples. We observed a median coefficient of variation of ~ 0.35 and ~ 0.25 in peptide and protein abundances, respectively, indicating high reproducibility between samples (Supplementary Fig. 1). The differential proteomic signature comprised 2484 unique protein groups in SD patients compared to NDCs (q-value < 0.01), of which 1376 were more abundant and 1108 were less abundant in SD versus NDC (Fig. 2a; Additional File 4). Proteins with the highest significance and/or largest differential abundance were labelled. This group of proteins (N = 51) indicates a variety of affected (neuronal) structures, i.e. the cytoskeleton, plasma membrane, dendrite, axon, and (post)synapse, and affected functions, i.e. cell adhesion, T cell-related immune processes, neurotransmitter receptor regulation, synapse organization, and synaptic signalling.
Fig. 2
The temporal cortex in SD demonstrates major protein affecting all major brain cell types in the disease process. a Differential protein abundancy analysis in the temporal cortex demonstrated 2484 unique protein groups which are significantly different between SD and NDC (q < 0.01). Proteins with the highest significance and/or largest differential abundance are labelled. b GO term enrichment analysis on these 2484 proteins showed various DNA and mRNA-related terms, many synaptic processes, (synaptic) vesicles and vesicle transport, epithelial cell development, cell adhesion, and structural components of the ECM, the cytoskeleton, and mitochondria. c SynGO enrichment analysis on the 440 synaptic proteins with significantly lower abundance in the SD temporal cortex showed clear synaptic dysregulation across both pre- and postsynaptic compartments. d EWCE analysis on all significantly different proteins illustrated a role for almost all major brain cell types. BP, biological process; CC, cellular component; diff abund, differentially abundant; ECM, extracellular matrix; ExNeurons, excitatory neurons; FDR, false discovery rate; GO, gene ontology; InNeurons, inhibitory neurons; memb, membrane; mito, mitochondrial; NDCs, non-demented controls; NTR, neurotransmitter receptor; OPC, oligodendrocyte precursor cell; phosphotrans, phosphotransferase; prot, protein; PSD, postsynaptic density; reg, regulation; RNP, ribonucleoprotein; SD, semantic dementia; sign transd, signal transduction; Std. Devs., standard deviations; SV, synaptic vesicle; transmem, transmembrane; transp, transporter
GO analysis of the SD temporal cortex proteome highlights multiple biological processes involved in SD, including synaptic organizationGO overrepresentation analysis (Additional File 5) showed that proteins with higher abundance in SD are enriched for various DNA and mRNA processing GO terms, epithelial cell development, cell adhesion, and several terms related to the extracellular matrix (ECM). Proteins with lower abundance in SD are enriched for a large spectrum of synaptic processes, (synaptic) vesicles and vesicle transport, intracellular signalling, and structural components of the cytoskeleton and mitochondria. Significant driver GO terms (q-value < 0.05) are shown in Fig. 2b.
We zoomed in on synaptic biological processes by performing SynGO analysis (see Additional File 6). In total, 670 synaptic proteins were differentially abundant in SD temporal cortex compared to controls. Synaptic GO enrichment (q-value < 0.01) for synaptic proteins with lower abundance in SD (N = 440) pointed to involvement of both the pre- and post-synapse (Fig. 2c). In the presynapse, enriched terms were related to the endocytic zone and the regulation of its membrane potential, and to the priming and exo-/endocytosis of pre-synaptic vesicles. In the post-synapse, enriched terms highlighted the structural organization of the actin cytoskeleton and post-synaptic density membrane, and the regulation of membrane potential via neurotransmitter receptor localization.
Cell type analysis reveals involvement of almost all major brain cell types in the SD temporal cortex proteomeTo investigate which major brain cell type(s) are most involved and/or affected by the protein changes in SD, we performed EWCE analysis of significant differentially abundant proteins in the SD temporal cortex proteome (see Additional File 7). Cell type analysis (Fig. 2d) demonstrated significant enrichment (q-value < 0.05) for almost all major brain cell types. Protein with higher abundance in SD were enriched for astrocytes, endothelial cells, oligodendrocytes, and OPCs, whilst proteins with lower abundance in SD were enriched for both excitatory and inhibitory neuronal cell types.
Proteins involved in RNA processing and regulation of presynaptic calcium levels appear to be specific to the SD disease fingerprintTo elucidate SD-specific disease fingerprints, we compared the SD temporal cortex proteome with published proteomic literature on neurodegenerative disorders in order to filter out general and/or non-specific protein features (see Additional File 2). First, we filtered out 98 protein groups not measured in any of the proteomic AD and FTLD studies. Then, 1519 protein groups that shared a differential signature with AD proteomes were filtered out, as they expectedly represent more common neurodegenerative disease features. Next, we filtered out 86 protein groups that shared a differential signature with FTLD-TAU proteomes, as they probably represent common FTD neurodegenerative features that are less related to unique SD pathways. Lastly, we filtered out 37 protein groups that shared a differential signature with FTLD-TDP proteomes, except for FTLD TDP type C proteomes. Though FTLD-TDP and SD patients share general TDP-43 pathology, we aimed to zoom in closely on SD-specific disease features. After this last step, the resulting refined SD temporal cortex proteome consisted of 3238 unique proteins groups (Additional File 4).
The refined SD temporal cortex proteomic signature comprised 804 differentially abundant proteins groups, of which 567 were more abundant and 237 were less abundant in SD compared to NDCs (q-value < 0.01) (Fig. 3a; Additional File 4). Proteins with the highest significance and/or largest differential abundance (N = 34) portrayed several aforementioned cellular processes, but also highlighted new processes like cell growth and migration, blood vessel maintenance and development, endosomal transport and autophagy, ion transport, glucose homeostasis, mRNA processing, and DNA repair. Interestingly, FAM171A2, a key regulator of progranulin (PGRN) expression [53], was one of the most significantly differentially abundant proteins in the refined SD temporal cortex proteome. Deficiency in PGRN levels is associated with development of neurodegenerative disease, including FTD subtypes with a mutation in C9ORF72 (TDP type A/B) [6] and in GRN (TDP type B) [3], and is linked to lysosomal dysfunction and TDP-43 aggregation [42]. While the exact dynamics between FAM171A2, PGRN and TDP-43 in SD remain to be investigated, our data suggest PGRN regulation also plays a role in SD.
Fig. 3
Refined SD temporal cortex proteome with corresponding functional enrichment and cell type enrichment analyses. Bioinformatic analysis of the refined SD temporal cortex proteome indicated a protein signature in which mRNA processing and pre-synaptic calcium homeostasis were more specific to the SD disease process. a Differential protein abundancy analysis in the refined temporal cortex proteome yielded 804 significantly different protein groups (q < 0.01). Proteins with the highest significance and/or largest differential abundance are labelled. b GO enrichment analysis on these 804 proteins showed that enrichment remains for driver terms related to the RNP complex, as well as emergence of a new enriched term related to calcium channel activity. c SynGO enrichment analysis on 172 synaptic proteins in the refined SD temporal cortex proteome specified this calcium channel activity further with emergence of the significant term voltage-gated calcium channel activity involved in regulation of presynaptic cytosolic calcium levels. d EWCE analysis after refinement suggested that endothelial cells, oligodendrocytes, and OPCs are more generally involved in neurodegeneration, while excitatory neurons and microglia could be more specifically affected and/or involved in the SD disease process. BP, biological process; CC, cellular component; biosynth, biosynthetic; diff abund, differentially abundant; FDR, false discovery rate; GO, gene ontology; OPC, oligodendrocyte precursor cells; prot, protein; Std. Devs., standard deviations
The majority of previously enriched GO terms disappeared after re-analysis of the refined proteome, indicating that they represented shared features of neurodegenerative disease (Fig. 3b; Additional File 5). Two particular processes that appeared to be specific to the SD disease process point to the ribonucleoprotein (RNP) complex and the involvement of ion channel activity, the latter one being emphasized by emergence of novel enrichment for the term high voltage-gated calcium channel activity (q-value = 0.0498) in the GO analysis as well as voltage-gated calcium channel activity involved in regulation of presynaptic cytosolic calcium levels (q-value = 0.0013) in the SynGO analysis (Fig. 3c; Additional File 6). In the refined proteome, enrichment for endothelial cells, oligodendrocytes, and OPCs was lost (Fig. 3d; Additional File 7), indicating that most protein changes in these cells are depictive of a shared neurodegenerative disease process. Two cell types were enriched for proteins specific to the SD temporal cortex disease process: proteins with lower abundance in SD remained strongly enriched for excitatory neurons, even after filtering out shared neurodegenerative proteins, and microglia enrichment emerged for proteins with higher abundance in SD.
Existence of a partially shared protein profile between temporal cortex and dentate gyrus in SD, but also temporal cortex-specific disease aspectsRecently [34], we performed proteomic analysis of the dentate gyrus of largely the same cohort of SD patients compared to NDCs. As these two regions greatly differ in neuropathological features in SD, a comparison between their proteomes would provide us with insights into region-specific disease changes. To address the possibility that differing atrophy levels in both regions interfere with comparative analysis, we examined the presence of cell type-specific protein populations in our data (Supplementary Fig. 2). Absolute protein abundancy values indicated that despite atrophy of the SD temporal cortex there were enough neurons left to enable meaningful comparison to the dentate gyrus proteome. For 3888 unique protein groups we had measurements in both data sets (Additional File 4) to compare proteomic changes between both brain regions.
While a set of 176 unique protein groups was differentially abundant in both regions in SD, the temporal cortex also harboured a large group of 1879 unique protein groups that was differentially abundant only in that region (q < 0.01, no fold change cut-off; Additional File 4). To focus on disease aspects distinct to SD, we applied filtering for FTLD and AD shared proteins here as well, resulting in 576 protein groups likely representing distinct aspects of the SD disease process in the temporal cortex (Additional File 4). These proteins showed a role for the RNP complex and mRNA processing on one hand, and for the presynaptic regulation of cytosolic calcium levels via voltage-gated calcium channel activity on the other hand, recapitulating these aspects as possibly specific to the temporal cortex region in SD (Fig. 4, Additional File 5 and 6). Supplemental analysis on the 176 unique protein groups shared between temporal cortex and dentate gyrus or the 58 unique proteins groups only differentially abundant in the dentate gyrus can be found in (Supplementary Fig. 3, Additional File 4 and 5).
Fig. 4
Proteins involved in the RNP complex and the regulation of presynaptic calcium levels potentially play a role in the SD disease process in the temporal cortex. a GO analysis on the proteins with higher abundance in SD temporal cortex highlights the RNP complex. b SynGO analysis on the proteins with lower abundance in SD temporal cortex demonstrates enrichment for the regulation of presynaptic calcium and postsynaptic NTR levels, the endosome, and SVs. abund, abundance; BP, biological process; biosynth, biosynthetic; CC, cellular component; GO, gene ontology; NTR, neurotransmitter receptor; RNP, ribonucleoprotein; SV, synaptic vesicle
Striking regional differences in TDP-43 & ANXA11 interactome protein abundance in SDAs mentioned, the temporal cortex and dentate gyrus differ in neuropathological features in SD. We investigated how exactly protein abundance within the interactome of neuropathological proteins TDP-43 and ANXA11 was affected in both brain regions in SD (Additional File 8 and Fig. 5). In the temporal cortex, two-thirds of proteins (67.3%) within the TDP-43-ANXA11 interactome showed significant differential abundancy in SD versus NDC (Fig. 5a). In the dentate gyrus, the interactome was significantly less affected, as only 3 proteins (2.5%) showed significant differential abundancy in SD versus NDC (Fig. 5b) Interestingly, neuropathological proteins TDP-43 and ANXA11 themselves were higher abundant in SD versus NDC in the temporal cortex, but abundance remained stable in SD versus NDC in the dentate gyrus. Furthermore, irrespective of statistical significance, a large set of interactome proteins demonstrates an opposing fold change direction in SD versus NDC when both brain regions are compared (Fig. 5c); while the majority of interactome proteins in the temporal cortex indicate higher abundancy, most of the interactome proteins in the dentate gyrus indicate lower abundancy. To prevent overinterpretation of these results, we performed an analysis of relative fold change distribution for the proteome versus the interactome (Fig. 5d). The unique pattern of distribution for interactome proteins in the temporal cortex (peak shift to positive fold changes) compared to general proteome changes in this brain region (peak centred around zero) indicates that higher protein abundancies in the TDP-43-ANXA11 interactome represent a biological occurrence in SD. Further comparison to distribution patterns for the dentate gyrus strongly suggests the TDP-43-ANXA11 interactome to be strikingly more affected in the temporal cortex than in the dentate gyrus in SD.
Fig. 5
Protein–protein interaction network of the TDP-43-ANXA11 interactome demonstrated major changes in the temporal cortex, but little change in the dentate gyrus in SD. a Protein behaviour of the TDP-43 interactome (n = 131 interactor proteins) and ANXA11 interactome (n = 11 interactor proteins) in the SD temporal cortex. Here, 68 out of 101 measured interactome proteins (67.3%), including TDP-43 and ANXA11, were significantly differentially abundant in SD versus NDC, most of them showing higher abundance in SD. b Protein behaviour of the TDP-43-ANXA11 interactome in the SD dentate gyrus. In this brain region, only three out of 122 measured interactome proteins (2.5%) were differentially abundant. c Effect size plot of the log2 fold change of TDP-43-ANXA11 interactome proteins in the temporal cortex versus dentate gyrus in SD. The majority of proteins shows an opposite fold change direction between both regions (orange set). d Relative distribution of protein abundance changes in the entire proteome versus the TDP-43-ANXA11 proteome, for both the temporal cortex (red versus orange) and the dentate gyrus (dark green versus light green). Distribution of TDP-43-ANXA11 interactome protein fold changes in the temporal cortex clearly deviates from the other protein sets. Proteins marked with * were not measured in one or both SD datasets. Diff, differential; DG, dentate gyrus; FC, fold change; SD, semantic dementia; TC, temporal cortex
Target protein validation using immunohistochemical analysis of post-mortem cortical SD brain tissueFrom the different proteome assessments in this paper, we selected protein candidates that appeared to be unique to the SD disease process in the temporal cortex for validation in a post-mortem neurodegenerative brain cohort. We started with the set of 1879 unique proteins groups that had demonstrated significant differential abundance in the SD temporal cortex, but no significant difference in the SD dentate gyrus. From these, we focussed on proteins that were measured in the other FTLD and AD proteomes, but explicitly did not show any significant difference or did show a significant difference, but in opposite direction (n = 182). Next, we based candidate selection on their relation to the two possible SD-specific biological GO processes emerging from Fig. 4, e.g. the ‘RNP complex’ (GO) and ‘voltage-gated calcium channel activity involved in regulation of presynaptic cytosolic calcium levels’ (SynGO) (n = 104). In addition, candidates with well-measurable abundance differences (≥ ± 0.2 FC) were preferred (n = 97). From this pool of 97 candidate proteins, we decided to focus on targets with a proven synaptic expression (n = 35) and the commercial availability of a well-tested antibody (existence of either published immunoblotting data or enhanced manufacturer validation). The final three selected candidates for immunoblotting validation were CACNB4, HNRNPAB, and RPS12 (Table 2).
Table 2 Candidate selection for immunoblotting validationCandidates were selected for their apparent specificity for the SD disease process in the temporal cortex area, with no apparent role in the dentate gyrus. In addition, candidates showed an absence or different abundancy change in the published AD and FTLD proteomes. Furthermore, candidates were selected for their role in two possible SD-specific biological GO processes, relating to the RNP complex and calcium level regulation in the synapse. From the candidate pool, proteins with well-measurable abundance differences (≥ ± 0.2 FC) were preferred. Lastly, candidates were selected for their proven synaptic expression and depended on the availability of well-tested antibodies as well. AD, Alzheimer’s Disease; FC, fold change; FTLD-TAU, frontotemporal lobar degeneration with TAU pathology; FTLD-TDP, frontotemporal lobar degeneration with TDP-43 pathology; GO, gene ontology; n.s., not significant; SD, semantic dementia; SynGO, synaptic gene ontology; TC, temporal cortex.
Immunohistochemically, CACNB4 stained extracellular vesicles in the upper cortical layers, likely corpora amylacea (Fig. 6a). There was no evident cytoplasmic staining. While proteomic analysis found lower abundance for CACNB4 in SD versus NDC, visual assessment of IHC showed similar levels of CACNB4 positive staining across SD, NDC, AD and FTLD-TAU samples. HNRNPAB stained small blood vessel structures in the cortex of SD and FTLD-TAU, with staining intensity increasing with degree of cortical atrophy (Fig. 6b). There was no evident HNRNPAB positivity in NDCs, nor in AD. These IHC findings were similar to proteomic results, which showed that HNRNPAB was more abundant in SD than NDC. RPS12 stained neuronal cytoplasm in the cortical layers of NDCs and all three neurodegenerative subgroups. IHC showed equivalent-to-weaker RPS12 intensity in SD, AD and FTLD-TAU versus NDC (Fig. 6c). This is contrary to proteomic findings, in which RPS12 was found to be more abundant in SD than NDC. RPS12 positivity decreased with increasing cortical atrophy, irrespective of the neurodegenerative subgroup. Likewise, in specific cortical areas with less atrophy within neurodegenerative samples, more RPS12 positivity was observed (Fig. 6c, panel FTLD-TAU), stressing the inverted relationship between RPS12 positivity and degree of cortical atrophy.
Fig. 6
Immunohistochemical staining of CACNB4, HNRNPAB and RPS12 in a panel of neurodegenerative cases and NDCs. Protein expression was tested in temporal cortex tissue of NDC, SD, AD, and FTLD-TAU samples to validate the SD candidate targets. a CACNB4 staining is observed in extracellular vesicles in the upper cortical layers, especially on the surface, which are likely corpora amylacea. This staining is similar across all groups. b Anti-HNRNPAB antibody stains small blood vessel structures in the temporal cortex of SD and FTLD-TAU, but not in NDC or AD. c RPS12 positivity is seen across all cortical layers in NDC, SD, AD and FTLD-TAU, with more positivity in NDCs than in neurodegenerative subgroups. Upper panels are overview images, whilst bottom panels are magnified images taken from the inset location in the corresponding upper panel. Scale bar (overview) = 100 µm, scale bar (magnification) = 20 µm. AD, Alzheimer’s disease; FTLD-TAU, frontotemporal lobar degeneration with TAU pathology (here, two cases of Pick’s disease); NDC, non-demented control; SD, semantic dementia
Comments (0)