The work has been reported in line with the ARRIVE guidelines 2.0.
SVF cell isolation
All materials were purchased from Sigma-Aldrich (Merck Millipore, Burlington, USA) unless otherwise stated. The lipoaspirate was digested with equal parts 0.15% w/v collagenase type II (Worthington Biochemical Corporation, Lakewood, USA) and phosphate buffered saline (PBS) (Invitrogen, Waltham, USA) at 37 °C undergoing continuous shaking for 60 min [11, 12]. Following centrifugation at 1,500 rpm for 10 min, the supernatant and the floating lipid-rich layer was discarded and the cellular pellet was washed once with PBS. The resulting cell suspension was strained through a 100 μm and a 70 μm nylon-mesh. The resulting SVF was then re-suspended in cell culture medium consisting of 87% v/v high glucose DMEM, 10% v/v fetal bovine serum, 1% v/v penicillin/streptomycin, 1% v/v glutamine, and 1% v/v N-2-hydroxyethylpiperazine-N-2-ethane sulfonic acid (HEPES) buffer. Nucleated cells stained with crystal violet were counted in an improved Neubauer chamber. Freshly isolated SVF cells were used straight away or frozen in 10% v/v dimethyl sulfoxide and 90% v/v FBS and stored in liquid nitrogen. To thaw, the cells were quickly heated in a 37 °C water bath and slowly resuspended in cell culture medium.
Cell seeding and culture
Discs of 12 mm diameter and 3 mm thickness were cut from Ultrafoam® (BD, Franklin Lakes, USA) and hydrated for 24 h at 37 °C in culture medium. For both experimental groups, SVF cells were seeded at 2.2 million cells/scaffold suspended in 1 ml culture medium and cell culture was performed under standardized culture conditions at 37 °C, 97% humidity and 5% CO2.
For the static groups, the pre-hydrated Ultrafoam® discs were placed in the wells of a 6-well plate and cells were seeded on top of the discs using a pipette. After 30 min in incubator, 7 ml of culture medium was added to each well.
For the perfusion groups, the pre-hydrated Ultrafoam® discs were placed into a bioreactor (available from Cellec Biotek AG, Basel, Switzerland) [12] and held in place by two silicon O-rings (12 mm outer; 8 mm inner diameter), allowing for perfusion of the inner 8 mm of the Ultrafoam® discs. The cells were then introduced into the sealed bioreactor containing 7 ml of culture medium by means of the injection port and a bidirectional flow rate of 3 mL/min was started using a programmable syringe pump (PHD ULTRA 2000, Harvard Apparatus, Cambridge, USA). After 18 h culture time, the constructs were removed from the bioreactor aseptically [12]. A high seeding efficiency was achieved for all constructs, quantified by the counting the remaining cells in the cell culture medium.
In-vivo animal experiments
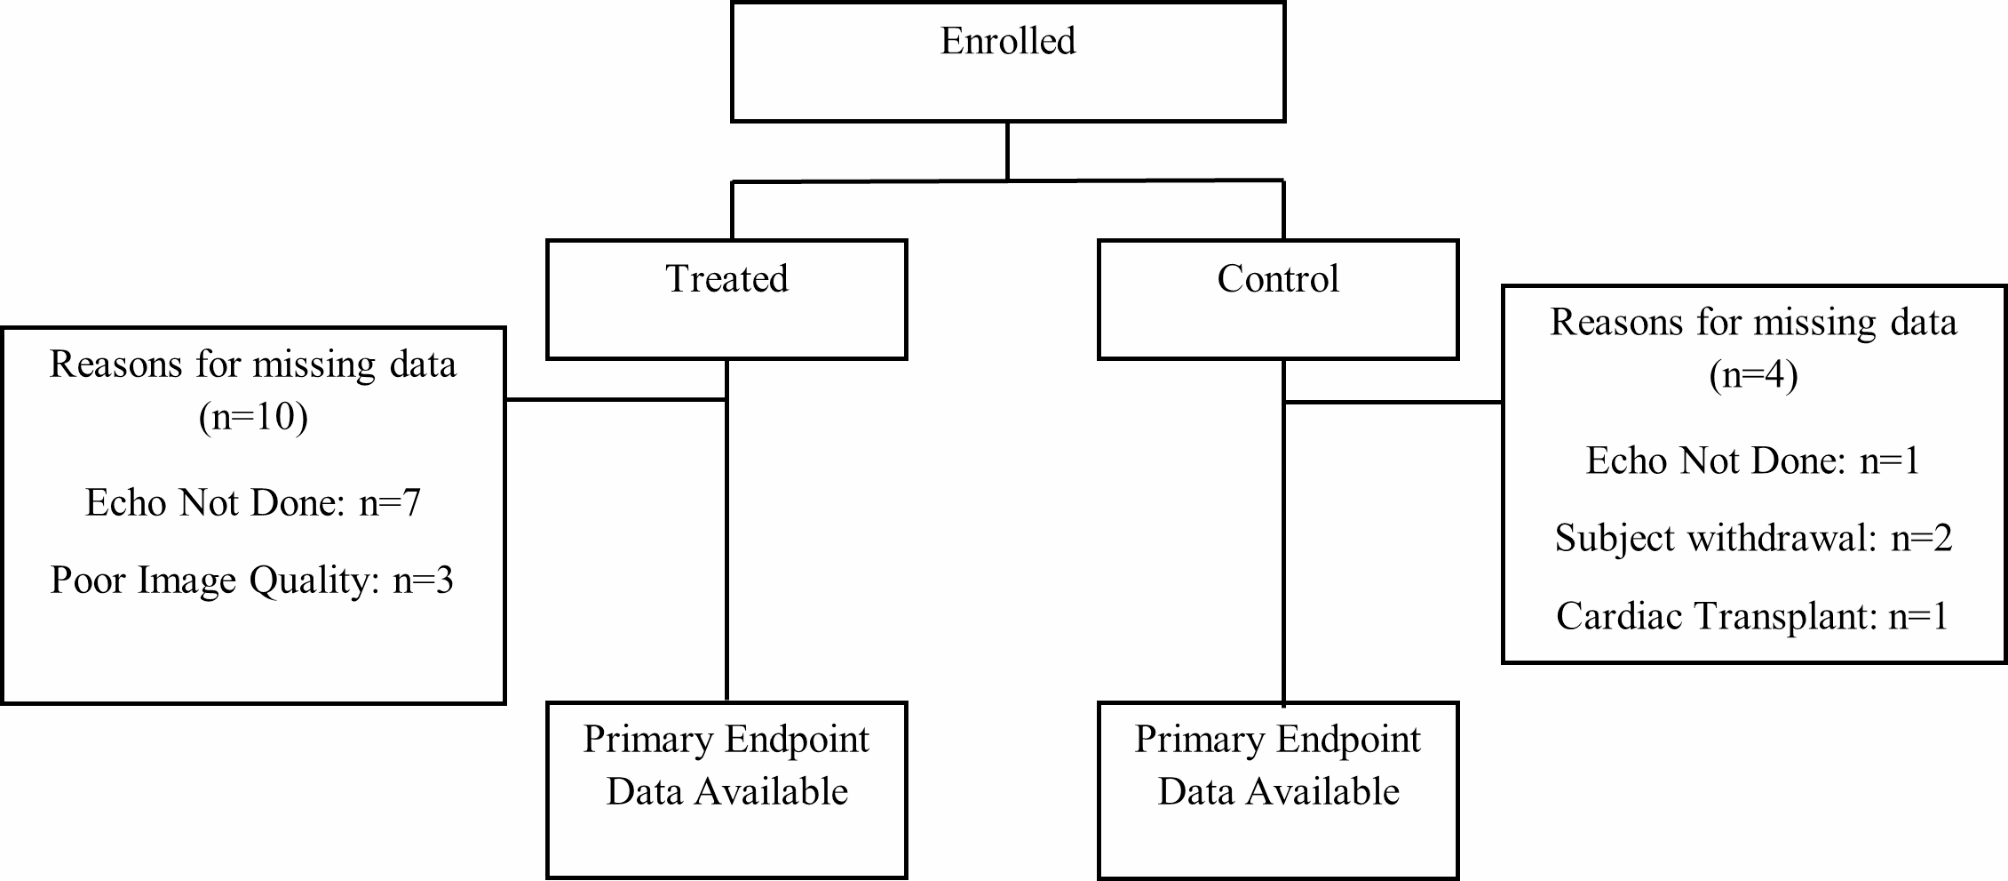
Eight-week-old male nude rats (weight range 250 ± 16 g; Hsd: RH-rnu/rnu, Envigo) were anaesthetized by inhalation using a mixture of oxygen (0.3–0.6 L/min) and isoflurane (1.5–3 vol %). Four constructs, either static or perfusion based, were implanted in subcutaneous pockets in the dorsum of each rat (4 samples per experimental group and per time point). In each animal, two perfusion-seeded constructs and two static-seeded constructs were implanted symmetrically along the spine to minimize any potential confounding factors related to the animal or its location. A total of 10 rats were used (3 rats for the 3- and 7-time points and 4 rats for the 28-time point). Experimental groups include perfusion-seeded constructs and statically loaded patches as controls. No inclusion or exclusion criteria were adopted for this animal model. At the moment of sacrifice after 3, 7 and 28 days, rats were anaesthetized by intraperitoneal injection of a mixture of ketamine (1 mg/g) and xylazin (0.1 mg/g). Subsequently, the total rat vasculature was perfused with 1% w/v paraformaldehyde (PFA). In rats after 28 days following implantation, fluorescein isothiocyanate (FITC)-labeled Lycopersicon esculentum lectin 250 μg in 250 μl, (Vector Laboratories, Newark, USA) was injected into the femoral vein and allowed to circulate for 4 min prior to sacrifice by PFA [30]. The FITC-lectin labels all newly generated blood vessels connected to the main circulation with lectin, highlighting their functionality. Animal death occurred under anesthesia via exsanguination if lectin perfusion was performed. If rat perfusion was not carried out, rats were euthanized by CO2 inhalation. The constructs were harvested and fixed in PFA 4% w/v at 4 °C overnight and in sucrose 30% w/v at 4 °C for another day before embedding in optimal cutting temperature (OCT) compound (CellPath, Newtown, UK) and frozen in liquid nitrogen vapor. Animals were monitored for signs of pain, distress, and potential wound infections following predefined criteria (such as body weight, behaviour, posture, wound healing process). No signs of adverse effects or suffering were observed. Nevertheless, termination criteria were established in advance, in accordance with the license, to address any potential adverse events or signs of suffering. To further minimize potential distress in the animals, additional bedding was provided in the cages to prevent them from experiencing cold due to their lack of fur. The animals are kept in accordance with the FSVO regulations (Federal Food Safety and Veterinary Office). The rats are kept in hygienic, air-conditioned rooms that are equipped with modern cage systems, which provides to each cage with its own air supply to ensure hygiene entities.
Analyses
No data was excluded.
Immunofluorescence
10 μm-thick sections were cut using a conventional cryostat (Leica Biosystems, Wetzlar, Germany) and stained according to standard protocols. In detail, slides were permeated with 0.3% Triton-X v/v solution for 10 min and then in blocking solution for 1 h containing either 2% v/v normal goat serum or 5% v/v donkey serum in PBS. All antibodies were diluted in blocking solution of 1% Bovine serum albumin (BSA). The following primary antibodies were added and left to incubate at 4 °C overnight: rabbit anti-Ki67 (Abcam, Cambridge, UK), mouse monoclonal anti-Human Nuclei (HuNu clone 235–1), rabbit anti-nerve/glial antigen 2 (NG2, Sigma-Aldrich), rabbit anti-cleaved caspase 3 (Cell Signaling technology, Inc., Danvers, USA), goat anti-vascular endothelial (Ve)-cadherin (Santa Cruz Biotechnology, Inc. Dallas, USA), rabbit anti-PECAM-1 (CD31, Abcam). All antibodies were diluted at 1:100, except anti-NG2 at 1:200. After washing, sections were then incubated at room temperature, covered from light for 1 h with 4’,6-diamidino-2-phenylindole (DAPI), Alexa488, Alexa546, or Alexa647 secondary antibodies (Invitrogen, Waltham, USA) at a dilution of 1:200. After washing, DAKO mounting medium (Agilent, Santa Clara, USA) was applied on the slide and the cover slip mounted. After drying at room temperature, slides were stored at − 20 °C. Fluorescence images were acquired at 20 × with Olympus BX63 microscope (Olympus, Shinjoku, Japan) or Zeiss LSM710 confocal microscope (Zeiss, Jena, Germany).
Image analysis
All image analyses were performed using Fiji 2.15 software (Open source, NIH, USA) or CellSens (Olympus) on at least triplicate samples for a total of 3 SVF donors and a range of 5–30 high-powered representative fields (acquired by a 20 × objective) per construct. Cell distribution and density was examined by the number and localization of DAPI positive cells relative to the total area of each field examined. In vivo primary read-outs were the vessel length density (VLD) and the human cell engraftment. The VLD was determined by normalizing the length of CD31 positive vessels to the total area of each field examined [12]. The human nuclei quantification was HuNu positive cells relative to the total area of each field examined. All other quantifications (cleaved caspase3, NG2-, Ki-67-, and Ve-Cadherin-positive cells) were deemed as a positive co-localization of the staining of interest with HuNu, relative to the total area of each field examined. Single-blind analyses were conducted during the in vitro and in vivo experiment.
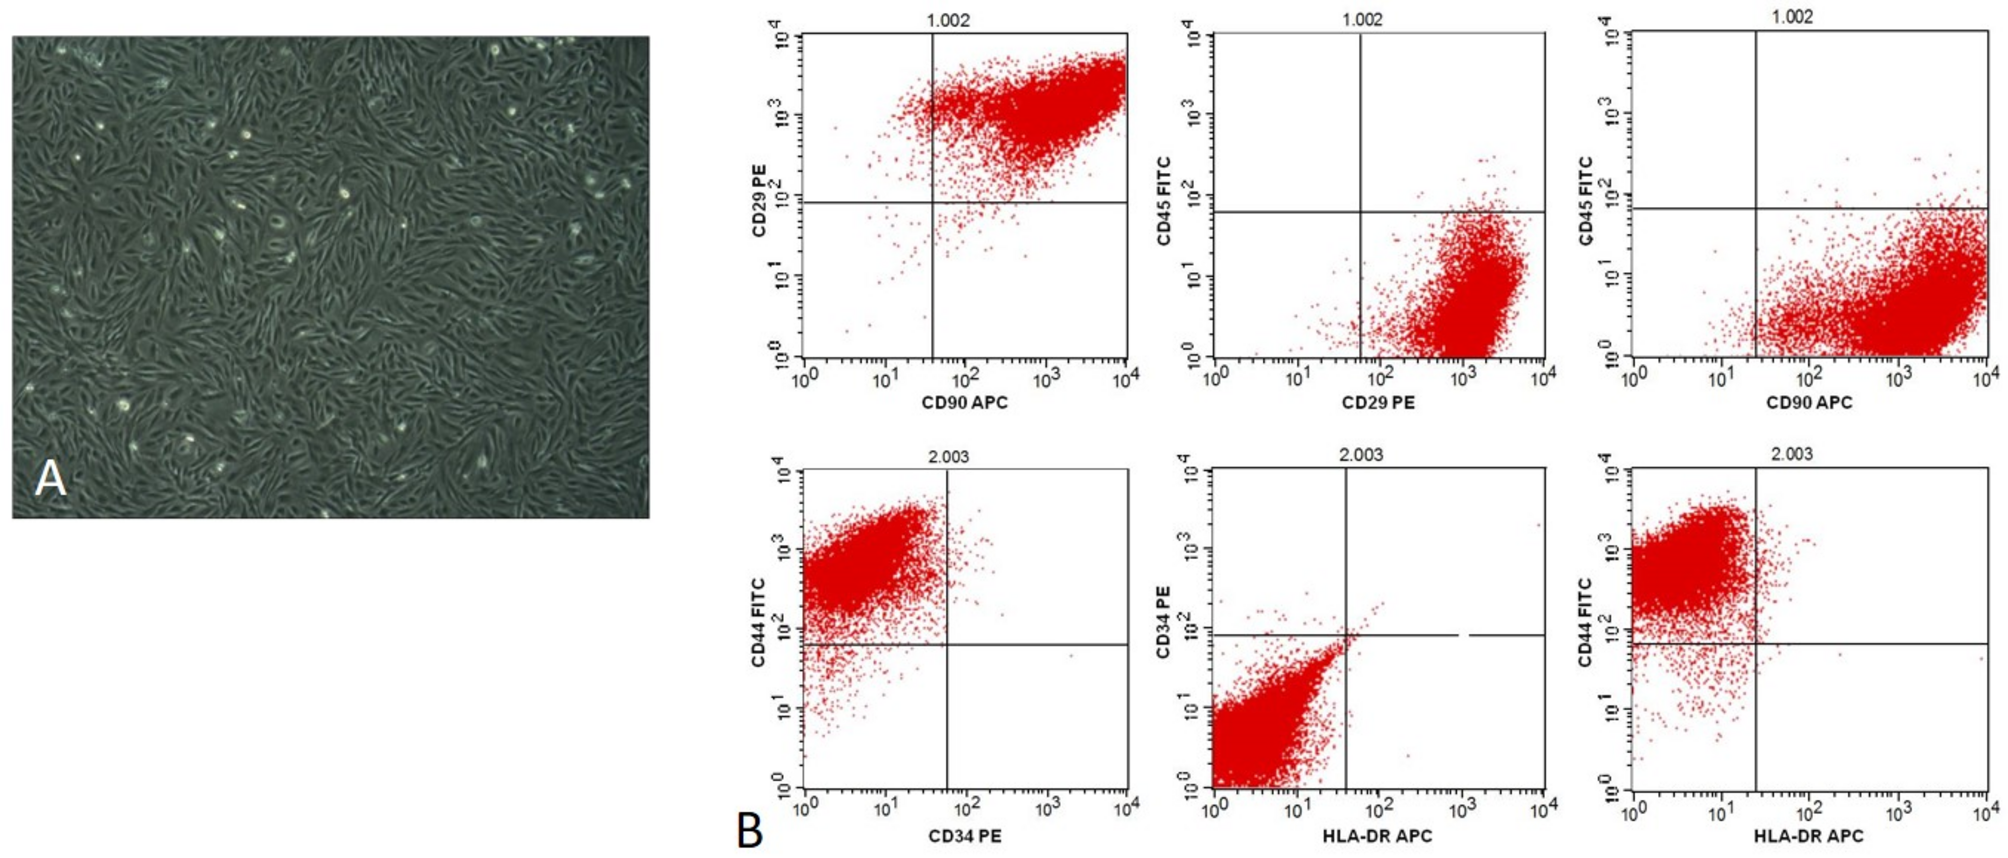
Flow cytometry
The SVF cell phenotype was determined by 6-channel cytofluorimetric analysis before in-vitro cell culture [13]. Cells in suspension were chilled and incubated for 30 min with the following fluorochrome-conjugated antibodies to human markers: CD11b APC, CD31 FITC, CD34 APC Cy7, CD45 BV605, CD73 APC CD146 PE, CD90 FITC, and VEGFR2 PE (Biolegend, San Diego, USA) in staining buffer consisting of 0.5% v/v FBS and 2 mM EDTA in PBS. Per million cells, 5 μl were used for all the antibodies according to the manufacturer’s protocol. Data were acquired with LSR FortessaTM flow cytometer (BD Biosciences) and analyzed using Flowjo v10.1r5 software (FlowJo LLC, Ashland, USY). It was presented as percentage over the total number of live cells (DAPI positive) for both experimental groups.
In vitro assessment of cytokine release
Supernatants (7.7 ± 0.2 mL) were collected after 18 h hours of culture through the injection site for the perfusion condition or from the well for the static condition. Two samples were tested for each donor (n = 2) for all the experimental groups. The concentrations of released human Vascular endothelial growth factor (hVEGF), interleukin (IL)-6, IL-12, tumor necrosis factor (TNF)-α and IL-1β were measured using the respective ELISA kit (R&D Systems, Minneapolis, USA) according to manufacturer’s instructions. Data were expressed as picogram (pg) of protein normalized to the total amount of DNA (expressed in μg) for each relative construct.
Statistical analysis
Statistical analysis was performed using Prism 10 (Graphpad, Boston, USA) and statistical significance determined to be at * p < 0.05 and increased denominated with stars (** p < 0.01, *** p < 0.001, **** p < 0.0001). No data were excluded. All data were presented as standard errors of the mean (SEM) unless otherwise stated. Data sets were initially assessed for normal distribution using the Kolmogorov–Smirnov test. If found to be normally distributed, data was analyzed using a 2-tailed unpaired student's t test for single comparisons or analysis of variance one-way ANOVA for multiple comparisons, followed by Dunn’s or Tukey's post-hoc. Data not found to be normally distributed was analyzed using a non-parametric Mann–Whitney test for single comparisons or Kruskal–Wallis for multiple comparisons.


Comments (0)