Generation of MSCs from iPSCs (iMSCs)
The iPSCs employed in this study were previously reprogrammed and established from human peripheral blood mononuclear cells by our research group [22]. MSCs were derived from these iPSCs following a protocol described in a prior study [23], with minor modifications. Initially, iPSCs were seeded onto six-well plates pre-coated with Matrigel (Corning, USA) and cultured in PGM1 medium (Cellapy, China) until reaching approximately 80% confluency. Then, PGM1 medium was replaced with an MSCs induction medium, consisting of α-MEM (Gibco, USA), 10% KnockOut™ Serum Replacement (Gibco, USA), 1% penicillin/streptomycin (EallBio, China), 1 mM sodium pyruvate (Gibco, USA), 50 μM L-ascorbic acid (Sigma-Aldrich, USA), 2 mM L-glutamine (Gibco, USA), and 0.1 mM non-essential amino acids (Gibco, USA), with medium changes every two days over a 14-day period. Following this induction, cells were digested with 0.25% trypsin (EallBio, China) and then seeded onto 10 cm culture dishes coated with 0.1% gelatin, denoted as passage 1 (P1) iMSCs, where the gelatin coating was applied only for the first two passages. From P1 onwards, cells were cultured and expanded in MSCs maintenance medium A, which contained high-glucose DMEM (EallBio, China), 10% fetal bovine serum (FBS; EallBio, China), 5 ng/mL basic fibroblast growth factor (PeproTech, USA), and 10 ng/mL epidermal growth factor (PeproTech, USA), with continued passaging. Passaging ceased at P3, with medium replacement every three days. After 3–5 weeks, large clusters of cells with the characteristic MSCs morphology appeared. Cells from P4 onward were considered successfully differentiated MSCs, maintained in MSCs maintenance medium B containing high-glucose DMEM with 10% FBS for subsequent expansion and passaging. For functional experiments, iPSC-MSCs at passages 5–10 were employed.
Trilineage differentiation of iMSCs
For osteogenic induction differentiation, cells were cultured for 21 days in osteogenic induction medium comprising α-MEM, 10% FBS, 50 μM L-Ascorbic acid (Sigma-Aldrich, USA), 0.1 μM dexamethasone (Solarbio, China), 10 mM β-glycerophosphate (Sigma-Aldrich, USA), and 1% penicillin–streptomycin. Cells were stained with 1% Alizarin Red S solution (Solarbio, China) to confirm mineral deposition. For adipogenic differentiation, high-glucose DMEM containing 10% FBS, 0.5 μM 3-isobutyl-1-methylxanthine (Sigma-Aldrich, USA), 0.5 μM dexamethasone, 10 μg/mL insulin (Sigma-Aldrich, USA), 50 μM indomethacin (Sigma-Aldrich, USA), and 1% penicillin–streptomycin was used as the adipogenic induction medium. Cells were cultured in this medium for 21 days, stained with Oil Red O staining (Solarbio, China) to detect lipid droplet formation. For chondrogenic differentiation, cells were cultured for 21 days in chondrogenic induction medium containing DMEM, 10% FBS, 0.1 μM dexamethasone, 1 mM sodium pyruvate (Sigma-Aldrich, USA), 40 μg/mL proline (Sigma-Aldrich, USA), 10 ng/mL TGF-β1 (PeproTech, USA), and 50 μg/mL L-Ascorbic acid. Following this period, Alcian Blue staining (Solarbio, China) was performed to visualize chondrogenic differentiation. Conventionally cultured iMSCs were used as controls and subjected to the corresponding staining procedures.
Polarization of macrophages and co-cultures with iMSCs
Human monocytic THP-1 cells, purchased from EallBio (Beijing, China), was maintained in RPMI 1640 medium (Gibco, USA) supplemented with 10% fetal bovine serum (FBS), 1% penicillin/streptomycin, and 0.05 nM 2-mercaptoethanol (Gibco, USA) at 37 °C in a 5% CO₂ incubator. The medium was replaced every other day, and the cells were passaged every four days. To induce differentiation into M0 macrophages, THP-1 cells were exposed to 100 ng/mL Phorbol 12-Myristate 13-Acetate (PMA, Sigma-Aldrich, USA) for 48 h. Subsequently, PMA was removed by medium exchange, and M0 macrophages were polarized into the M1 phenotype by incubation with 20 ng/mL IFN-γ (MCE, USA) and 100 ng/mL LPS from P. gingivalis (InvivoGen, France) for an additional 48 h (M0 + LPS + IFN-γ group).
For the co-culture of macrophages with iMSCs, THP-1 cells were seeded at a density of 1 × 10⁶ cells per well in six-well plates and differentiated into M0 macrophages using PMA. iMSCs (2.5 × 10⁵) were then plated in the upper chamber of Transwell inserts (0.4 μm pore size, NEST, China) to establish a co-culture system. LPS and IFN-γ were added to the system to sustain the macrophage activation process for 48 h (M0 + LPS + IFN-γ + iMSCs group). Conditioned medium (CM), RNA, and protein from macrophages under various conditions were collected for subsequent analyses.
The osteogenic differentiation of periodontal ligament stem cells (PDLSCs)
Human PDLSCs were purchased from EallBio (Beijing, China) and cultured in α-MEM medium (Gibco, USA) supplemented with 10% fetal bovine serum (FBS) and 1% penicillin/streptomycin. PDLSCs at a density of 1 × 10⁵ cells per well were seeded into 12-well plates, and osteogenic differentiation was induced using a 3:1 mixture of osteogenic induction medium and macrophage-conditioned medium (CM), with medium changes performed every three days. After seven days of differentiation, the cells were fixed in 4% paraformaldehyde (EallBio, China) for 30 min and stained using the BCIP/NBT ALP color development kit (Beyotime, China). Alkaline phosphatase (ALP) activity was measured using the Alkaline Phosphatase Assay Kit (Beyotime, China). After 21 days of induction, the cells were fixed and stained with 1% Alizarin Red S solution (Solarbio, China) to identify mineralized nodules. The stained nodules were subsequently dissolved in 10% cetylpyridinium chloride solution (Aladdin, China), and the absorbance was measured at 562 nm using a microplate reader (Molecular Devices, USA). RNA samples were collected on days 7 and 21 for real-time quantitative polymerase chain reaction (RT-qPCR) analysis.
Cytokine analysis
In addition to the aforementioned co-culture system, an iMSCs + LPS + IFN-γ group was established to determine cytokine levels secreted by iMSCs under inflammatory conditions. Specifically, iMSCs (2.5 × 10⁵) were seeded into the upper chamber of Transwell inserts, and LPS and IFN-γ were added for further 48-h culture (iMSCs + LPS + IFN-γ group). The quantification of cytokines was performed using a 27-plex magnetic bead-based immunoassay kit (Bio-Rad, M500KCAF0Y, USA) in accordance with the manufacturer's instructions. The concentrations of 27 cytokines in the supernatants of macrophages from the M0 group, M0 + LPS + IFN-γ group, M0 + LPS + IFN-γ + iMSCs group, and iMSCs + LPS + IFN-γ group were analyzed. The detection was conducted using the Luminex X-200 system (Luminex Corporation, USA), and data analysis was performed with Milliplex Analyst software (Version 5.1, Merck Millipore, USA). The intra-assay and inter-assay coefficients of variation (CV) were confirmed to be below 15%, ensuring the reproducibility of the measurements. Cytokine concentrations were expressed in picograms per milliliter (pg/mL).
Detection of intracellular reactive oxygen species (ROS)
The levels of ROS in macrophages were measured using a ROS detection kit (Beyotime, China). Following a 12-h stimulation with LPS and IFN-γ or co-culture with iMSCs, cells were incubated with 2 mL of 0.1% dichlorofluorescein diacetate (DCFH-DA) at 37 °C for 30 min. Rosup (50 µg/mL) was used as a positive control for ROS induction. The cells were then washed with serum-free RPMI 1640 medium to remove excess DCFH-DA. Subsequently, the cells were observed and imaged under a fluorescence microscope. Following fluorescence imaging, the cells were detached using Accutase (Sigma-Aldrich, USA) and subjected to flow cytometry to quantify ROS levels. The mean fluorescence intensity (MFI) in the FITC channel was used as a quantitative indicator of ROS production.
Flow cytometry analysis
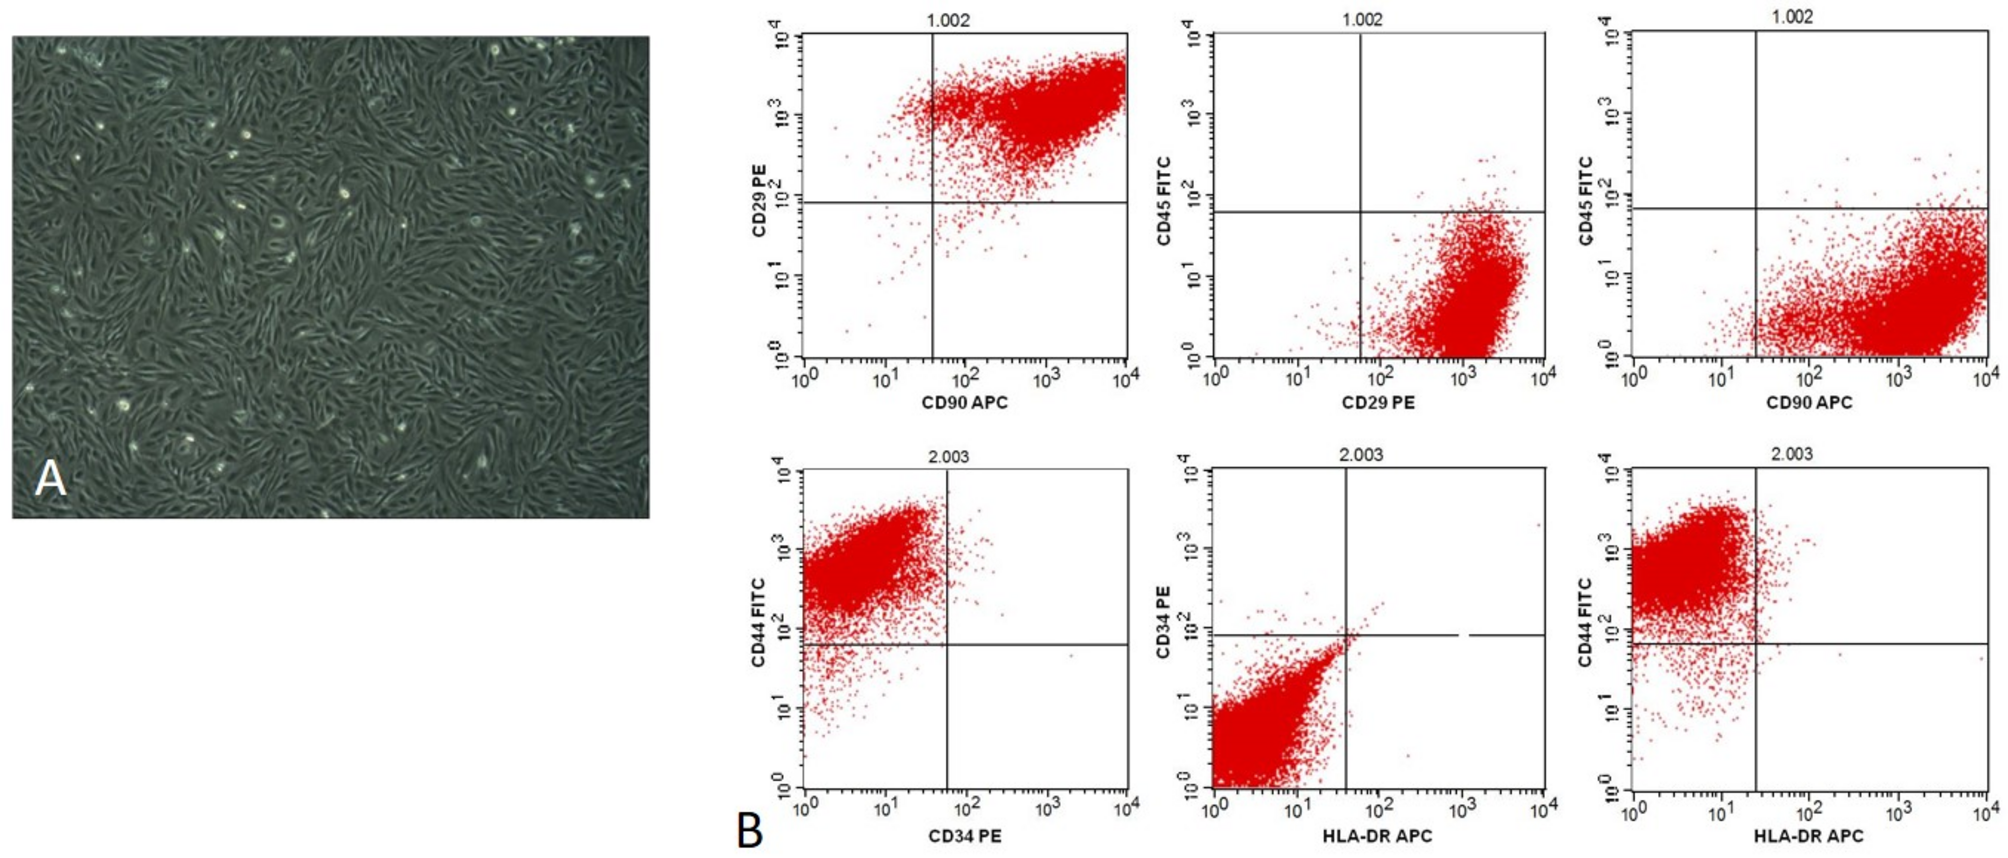
The immunophenotypic characterization of iMSCs was performed following the ISCT standards [24]. iMSCs were digested using trypsin and stained with the following antibodies at 4 °C for 30 min: CD73-APC (BioLegend, USA), CD90-FITC (BioLegend, USA), CD146-PE (BioLegend, USA), CD105-PE (BioLegend, USA), CD34-PE (BD Biosciences, USA), CD45-PE (BioLegend, USA), and HLA-DR-APC (BioLegend, USA).
For the detection of M1 macrophages marker CD86 and M2 macrophages marker CD206, cells were incubated with CD11b-FITC (BioLegend, USA) and CD86-PE antibodies (BioLegend, USA) in the dark for 30 min. After centrifugation, cells were fixed and permeabilized using BD Cytofix/Cytoperm (BD Biosciences, USA) according to the manufacturer's protocol, followed by incubation with CD206-APC antibody (BioLegend, USA) at 4 °C for 30 min.
For ROS detection by flow cytometry, macrophages were harvested by digestion with Accutase for 15 min and washed twice with PBS. ROS levels were quantified using the FITC channel, with the mean fluorescence intensity of FITC serving as the indicator.
Flow cytometry was performed using a CytoFLEX S flow cytometer (Beckman Coulter, USA), and data were analyzed with CytExpert software (version 2.6, Beckman Coulter, USA).
Reverse transcription-quantitative polymerase chain reaction (RT-qPCR) analysis
Total RNA was extracted from cells using TRIzol reagent (Invitrogen, USA), and cDNA was synthesized through reverse transcription using the TaKaRa PrimeScript RT Reagent Kit (Takara Biomedical Technology, Japan). RT-qPCR was performed with the SYBR Green Pro Taq HS qPCR Kit (AG, China) on the AriaMx Real-Time PCR System (Agilent, USA). Data were analyzed using the comparative ΔΔCt method, with GAPDH serving as the internal control. The primer sequences for the target genes are listed in Table 1.
Table 1 Primer sequences used for qRT-PCRWestern blot analysis
Total protein was extracted using a Protease Inhibitor Cocktail (TargetMol, USA), Phosphatase Inhibitor Cocktail III (TargetMol, USA), and RIPA Lysis Buffer (Applygen, China). Protein samples were loaded and separated by electrophoresis on a 10% SDS-PAGE gel (EPIZYME, China). The separated proteins were transferred onto a PVDF membrane (Merck Millipore, USA). The membrane was blocked for 30 min with a Rapid Blocking Buffer (EPIZYME, P2108P) and incubated overnight at 4 °C with primary antibodies. After three washes with TBST, the membrane was incubated with the secondary antibody for 1 h. Immunoreactive bands were visualized using the Immobilon ECL Ultra Western HRP substrate (Merck Millipore, USA). The primary antibodies used were as follows: Nrf2 (1:1000, Abmart, China), HO-1 (1:1000, Abmart, China), NQO1 (1:1000, Abmart, China), AKT (1:1000, Abmart, China), P-AKT (1:1000, Abmart, China), NF-κB p65 (1:1000, Abmart, China), P-NF-κB p65 (1:1000, Abmart, China), GAPDH (1:3000, Abclonal, China), and β-tubulin (1:2000, Abmart, China).
Transcriptomic analysis
RNA sequencing and bioinformatics analysis were conducted with the assistance of NovelBio Bio-Pharm Technology Co., Ltd (Shanghai, China). Total RNA was extracted from macrophages under four conditions: M0, M0 co-cultured with iMSCs in a Transwell system (M0 + iMSCs), M0 stimulated with LPS and IFN-γ (M0 + LPS + IFN-γ), and M0 stimulated with LPS and IFN-γ in the presence of iMSCs (M0 + LPS + IFN-γ + iMSCs). The cDNA libraries for each RNA sample were prepared using the VAHTS Universal V6 RNA-seq Library Prep Kit for Illumina (Vazyme, China) following the manufacturer’s instructions. The libraries underwent quality control using the Agilent 2200 system and were sequenced on the DNBSEQ-T7 platform with 150 bp paired-end reads. Clean reads were obtained by removing adapter sequences and low-quality reads from the raw data. Differentially expressed genes (DEGs) were identified using the DESeq2 algorithm [25] based on the following criteria: (i) Fold Change > 2 or < 0.5, (ii) P-value < 0.05, and (iii) FDR < 0.05 [26]. Gene Ontology (GO) analysis and Pathway Analysis were performed using the CytoNavigatortm RNA-Seq Analysis Platform. GO annotations data were sourced from NCBI (http://www.ncbi.nlm.nih.gov/), UniProt (http://www.uniprot.org/), and Gene Ontology (http://www.geneontology.org/), and significant GO categories were identified using Fisher’s exact test (P-value < 0.05). Pathway analysis was conducted based on the KEGG database to identify significant pathways associated with the DEGs, with Fisher’s exact test applied to determine statistical significance (P-value < 0.05).
Ligature-induced periodontitis mouse model
The work has been reported in line with the ARRIVE guidelines 2.0. Male C57BL/6 mice aged 4–6 weeks were purchased from the Experimental Animal Center of Peking University Health Science Center. All mice were housed in the same facility under specific pathogen-free conditions, maintained on a 12-h light/dark cycle. The experimental protocol was approved by the Biomedical Ethics Committee of Peking University (Approval No.: PUIRB-LA2023075). The mice were randomly assigned to three groups: healthy control group (n = 5), untreated periodontitis group (n = 5), and periodontitis group treated with iMSCs (n = 5). Mice in the healthy control group received no treatment. In the untreated periodontitis group, experimental periodontitis was induced under sodium pentobarbital anesthesia by placing a 5–0 silk ligature around the cervical region of the second maxillary molars bilaterally. In the iMSC-treated periodontitis group, ligatures were placed as described above, and mice received local periodontal injections of iMSCs (5 × 10⁵ cells suspended in 10 μL PBS) on days 3, 5, 7, and 10. After two weeks, the mice were euthanized by cervical dislocation, and the maxillae were harvested and fixed in 4% paraformaldehyde for 24 h for subsequent analyses. The personnel conducting the experiments were not involved in the result analysis, and two independent researchers cross-verified the analysis outcomes.
Micro-CT analysis
Micro-CT (Siemens Medical Solutions USA, Inc., Hoffman Estates, IL, USA) was used to assess alveolar bone loss. Scanning was performed with a resolution of 10 µm. Upon completion of the scan, image data were exported, and quantitative analysis was conducted on parameters such as bone mineral density (BMD) and bone volume/total volume ratio (BV/TV) to evaluate changes in the alveolar bone. Bone morphological changes in the alveolar bone were further validated using Mimics software (Materialise, Belgium), and the distance between the cementoenamel junction (CEJ) and alveolar bone crest (AB) of the maxillary second molar was measured and presented.
Histological analysis
The maxillae of mice were decalcified in 10% EDTA solution for two weeks, followed by the preparation of 4-μm-thick paraffin sections for HE staining. TRAP staining: After deparaffinization, sections were stained using a TRAP staining kit (Servicebio, GB1050, China), dehydrated, and mounted. Immunofluorescence staining: Sections were deparaffinized, hydrated, subjected to antigen retrieval, and blocked for endogenous peroxidase activity. The sections were then blocked with bovine serum albumin and incubated overnight at 4 °C with primary antibodies against CD68 (Servicebio, GB113109, 1:100), iNOS (Servicebio, GB11119, 1:100), CD206 (Servicebio, GB113497, 1:100), and p65 (Bioss, BS-0465R, 1:100). For secondary antibody staining, sections labeled with CD68, iNOS, and CD206 were incubated with a green fluorescent secondary antibody (Servicebio, GB22303, 1:100), while sections labeled with p65 were incubated with a red fluorescent secondary antibody. Nuclei were counterstained with DAPI, and slides were mounted using an anti-fade mounting medium. Immunohistochemical (IHC) staining: Sections were deparaffinized and hydrated, followed by antigen retrieval. After blocking with bovine serum albumin (BSA), tissue sections were incubated overnight at 4 °C with the primary antibody against IL-17A (Proteintech, 1:100). After washing, sections were treated with a secondary antibody (Servicebio, GB23303, 1:100), developed with DAB chromogen, counterstained with hematoxylin for 1 min to label nuclei, and finally dehydrated and mounted. IHC, HE and TRAP-stained sections were scanned using a WISLEAP WS-10 pathological slide scanner (WISLEAP, China). Immunofluorescence images were captured using a confocal fluorescence microscope, and both TRAP-stained and immunofluorescence images were analyzed using ImageJ software.
Statistical analysis
All data are presented as the mean ± standard deviation. Western blot bands, TRAP staining, immunohistochemistry, and immunofluorescence images were analyzed using ImageJ (version 1.53e, National Institutes of Health, USA). Graphs and statistical analyses were performed using GraphPad Prism (version 8.0.2, GraphPad Software Inc., USA). One-way analysis of variance (ANOVA) was used for multiple group comparisons. A P-value of < 0.05 was considered statistically significant.


Comments (0)