Animals
All animal procedures used in this study were approved by the Experimental Animal Ethics Committee of Tianjin First Central Hospital and complied with the “Guide for the Care and Use of Laboratory Animals”. Clinical trial number: not applicable. Animals were randomly assigned to the experimental group, and all experiments were conducted on male animals. Sprague–Dawley (SD) rats aged 7–8 weeks were housed in a specific pathogen–free facility at the Tianjin Organ Transplantation Key Laboratory. During the study, the animals were exposed to a 12-hour light and 12-hour dark cycle, and freely received food and water. The work has been reported in line with the ARRIVE guidelines 2.0.
Rat model of post-LT liver fibrosis induced by prolonged cold ischemia time (CIT) of donor liver
Anesthesia method during rat liver transplantation using isoflurane inhalation anesthesia. The concentration during induction anesthesia is 4–5%, and the oxygen flow rate is controlled at 1 L/min. The concentration during maintenance anesthesia is 2–3%, and the oxygen flow rate is controlled at 0.2–0.4 L/min. The concentration during the anhepatic phase is 0.5-1%, and the oxygen flow rate is controlled at 0.4–0.6 L/min. After obtaining the SD rats’ livers, each liver was perfused through the portal vein with 10 mL of precooled Sodium Lactate Ringer’s Injection. Subsequently, the donor liver was transferred to a sterile bag containing Sodium Lactate Ringer’s Injection to ensure complete immersion, and any air was expelled from the bag. Then, the bag was placed into a foam box with ice water mixture and stored in a refrigerator at 4 °C. Maintaining a continuous supply of ice in the mixture of ice and water was crucial to ensure proper organ preservation. According to the experimental requirements, the donor liver had to be implanted in situ into another rat after 4 h. We observed and recorded the recovery time of consciousness and activity ability of the recipients after LT, and collected and analyzed blood and liver pathology results and recorded the survival status on postoperative day 28.
Animal euthanasia methods
The rats were sacrificed by inhaling CO2, in accordance with the Canadian Council on Animal Care guidelines on euthanasia of animals used in science. We placed the rats in a pre-filled CO₂ chamber (20–30% displacement rate) and maintained exposure for ≥ 5 min after respiratory arrest. Then we confirmed death via bilateral thoracotomy.
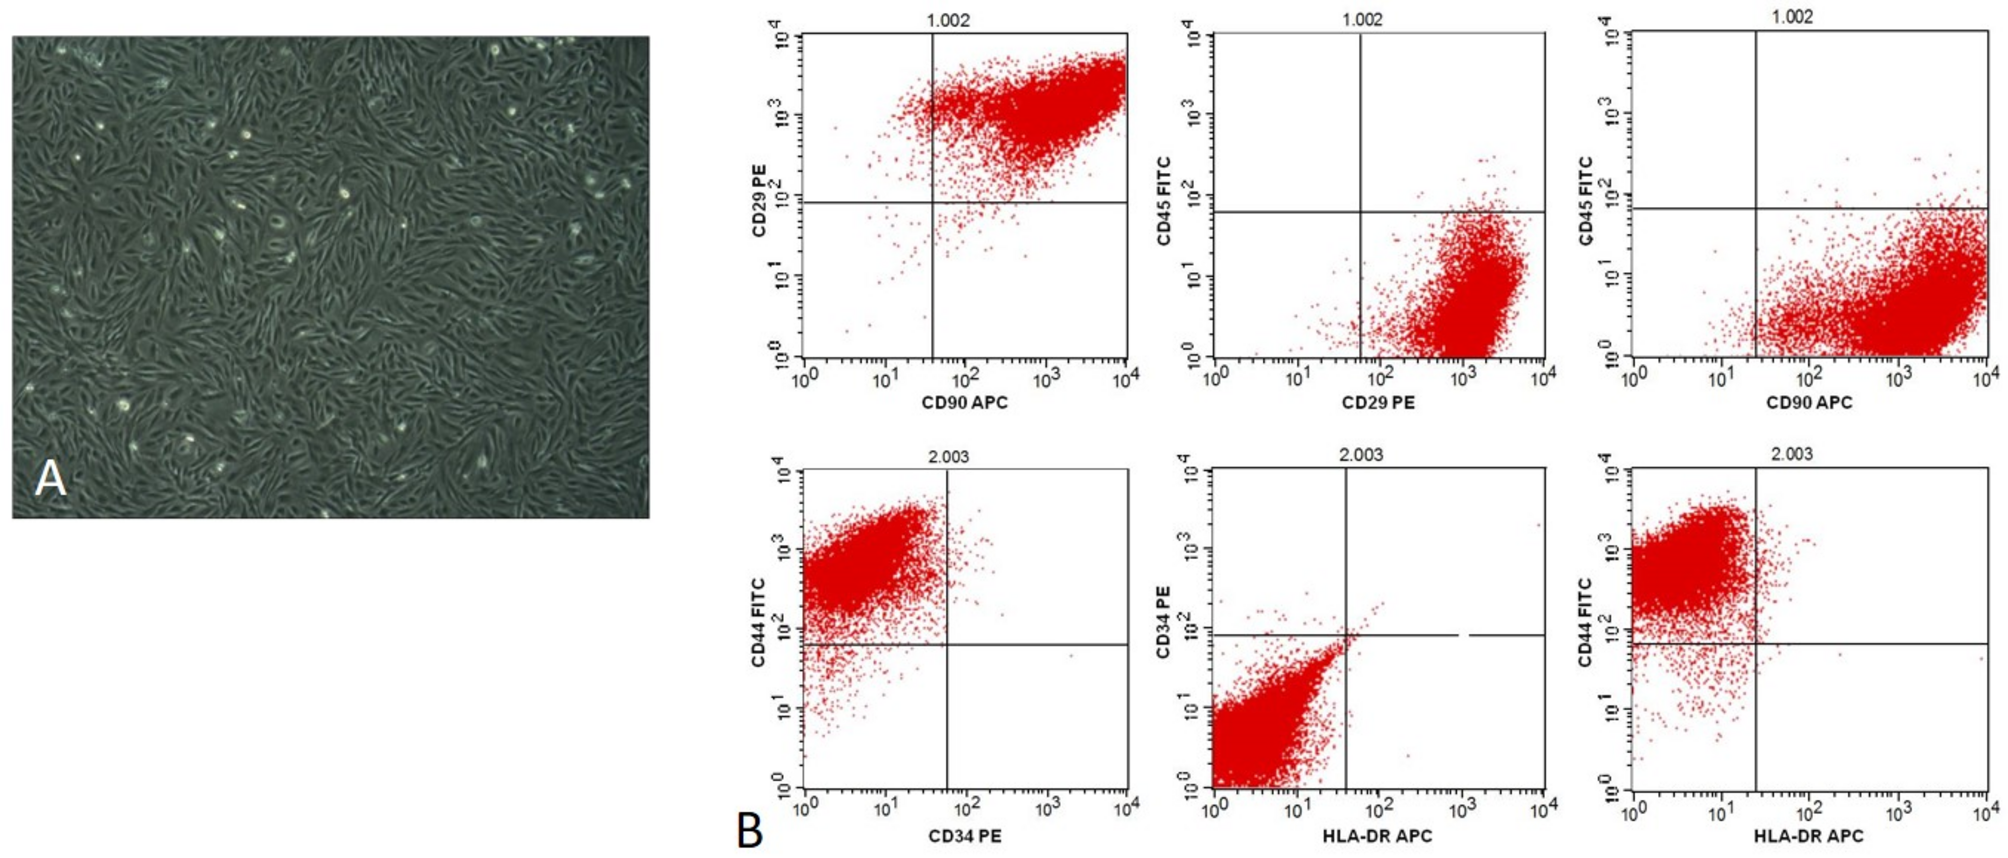
BMSCs extraction and characterization
The femur and tibia were removed aseptically after the rats were euthanized by inhaling CO2. The marrow cavity was rinsed with DMEM/F12 (1:1) containing 10% fetal bovine serum; the cell suspension was inoculated into T75 culture flasks, and cultured at 37 °C with 5% CO2. Well-grown passage 3 cells were resuspended for detection and backup, labeled with fluorescent antibodies: anti-CD34-FITC (0.25 µg/106 cells, Cat# sc-7324, Santa Cruz, CA, USA), anti-CD90-FITC (0.25 µg/106 cells, Cat# 202503, BioLegend, CA, USA), anti-CD45-PE (0.25 µg/106 cells, Cat# 202224, BioLegend, CA, USA), anti-CD29-PE (0.25 µg/106 cells, Cat# 102207, BioLegend, CA, USA), anti-RT1A-PE (0.25 µg/106 cells, Cat# 205208, BioLegend, USA), and anti-RT1B-FITC (0.25 µg/106 cells, Cat# 205305, BioLegend, CA, USA), and incubated for 30 min in the dark for flow cytometry.
Animal experiment grouping design
The animals were randomly divided into the Sham group, LT group, LT + BMSC group, LT + Abrocitinib group, LT + BMSC + RO8191 group, LT + anti-IL7 group, and LT + anti-IL7Rα group, with 6 animals in each group. The LT group was subjected to a transplantation of the liver with a cold storage time of 4 h. The LT + BMSC group received 5 × 10⁶ BMSCs by injection through the portal vein after blood flow opening during LT. In addition to LT, the LT + Abrocitinib group received Abrocitinib (40 mg/kg of body weight, per os, daily) for 10 days. The LT + BMSC + RO8191 group received 5 × 10⁶ BMSCs via portal vein injection with open blood flow after LT, and also received RO8191 (20 mg/kg of body weight, per os, daily) for 10 days. The LT + anti-IL7 group received anti-IL7 antibody (M25; Cat# HY-P990210, MCE, Shanghai, China) (250 µg/kg of body weight, per ip, once a week) for 2 weeks after LT. The LT + anti-IL7Rα group received anti-IL7Rα antibody (A7R34; Cat# HY-P990209, MCE, Shanghai, China) (250 µg/kg of body weight, per ip, once a week) for 2 weeks after LT. The Sham group and the LT group did not receive intervention. All of the rats were euthanized at 28 days after LT, and their livers and blood were obtained for subsequent experiments.
Construction of cellular hypoxia–reoxygenation model and co-culture model
Normal rat HSC cell line (HSC-T6), normal rat hepatic cell line (IAR20) and BMSCs were cultured in suitable DMEM or RPMI-1640 medium, respectively, in a normal 37 °C, 5% CO2 cell culture incubator. When the cells grew and fused to around 90% density in the culture dish, trypsin digestion was used to prepare a cell suspension. The cells in HSC-T6 or IAR20 cell suspension were counted and inoculated in a six-well plate (106 cells). Complete culture medium was replaced with low-glucose culture medium when the cells have grown and fused to a density of around 50%. Then, the medium was placed in a cell hypoxia–reoxygenation incubator and incubated under 99% N2 mixture for 12 h. After hypoxia, the low-glucose medium was replaced with complete medium and cultured in a normal 37 °C, 5% CO2 cell incubator. Cell counting was performed on BMSC suspension, and the cells were inoculated in a Transwell chamber with a pore size of 0.4 μm in a six-well plate (106 cells). We cultivated the cells in a normal 37 °C, 5% CO2 cell culture incubator using complete culture medium. If co-culture was required, we moved the chamber to the six-well plate that had just been deprived of oxygen in the previous step, replaced the complete culture medium, and placed it in a normal 37 °C, 5% CO2 cell culture incubator for cultivation.
RNA-sequencing analysis
Total RNA from the livers was extracted using the TRIzol reagent (Invitrogen, Waltham, MA, USA), and RNA quantification was based on the NanoDrop2000 spectrophotometer (Thermo Fisher, Waltham, MA, USA). Then, libraries were constructed using VAHTS Universal V6 RNA-seq Library Prep Kit in accordance with the manufacturer’s instructions. The RNA libraries were sequenced on an Illumina NovaseqTM6000 platform (OE Biotech, Shanghai, China). Gene Ontology (GO), Kyoto Encyclopedia of Genes and Genomes (KEGG), Reactome, and WikiPathways enrichment analyses of differentially expressed genes were performed to screen the significantly enriched terms using R (v 3.2.0). R (v 3.2.0) was used to draw the column diagram, chord diagram, and bubble diagram of the significantly enriched terms.
Quantitative real-time polymerase chain reaction (RT-qPCR)
For RT-qPCR detection, total RNA was extracted from the liver tissue samples or cultured cells using TRIzol reagent. NanoDrop 2000 (Thermo Fisher, Waltham, MA, USA) and gel electrophoresis were used to quantitatively and qualitatively evaluate the separated RNA. Subsequently, in accordance with the manufacturer’s instructions, 1 µg of RNA was reverse-transcribed into cDNA using HiScript II Q RT SuperMix for qPCR. PCR amplification products were quantified using PowerUp SYBR Green Master Mix in line with standard procedures (95 °C for 15 s, 60 °C for 30 s, 72 °C for 30 s; 40 cycles). Table 1 lists the primer pairs used in this study.
Table 1 The primer sequences of genes in RT-qPCR assaysWestern blot (WB) analysis and antibodies
We separated the total protein extract of the liver tissue or cells using lysis buffer and quantified it using bicinchonic acid protein analysis kit (KeyGEN, Nanjing, Jiangsu, China). The protein samples were denatured by heating at 100 °C for 10 min. The protein lysate was separated on 10% sodium dodecyl sulfate–polyacrylamide gel and transferred onto a polyvinylidene difluoride membrane. We first sealed the membrane with 5% bovine serum albumin in Tris-buffered saline/0.1% Tween-20 for 2 h, and then incubated it with the following specific antibodies at 4 °C for 12 h: ACTA2 (Cat# ab124964, Abcam, Cambridge, MA, USA), CASP3 (Cat# ab184787, Abcam, Cambridge, MA, USA), COL1A11 (Cat# ab270993, Abcam, Cambridge, MA, USA), DES (Cat# ab32362, Abcam, Cambridge, MA, USA), IL7 (Cat# A1650, ABclonal, Wuhan, Hubei, China), IL7R (Cat# A11678, ABclonal, Wuhan, Hubei, China), JAK1 (Cat# A5534, ABclonal, Wuhan, Hubei, China), MMP9 (Cat# ab76003, Abcam, Cambridge, MA, USA), STAT1 (Cat# 66545-1-Ig, Proteintech, Wuhan, Hubei, China), p-STAT1 (Cat# GB115605-100, Servicebio, Wuhan, Hubei, China), STAT3 (Cat# 60199-1-Ig, Proteintech, Wuhan, Hubei, China), p-STAT3 (Cat# 60479-1-Ig, Proteintech, Wuhan, Hubei, China), STAT5 (Cat# A5029, ABclonal, Wuhan, Hubei, China), p-STAT5 (Cat# AP0758, ABclonal, Wuhan, Hubei, China), TGFB1 (Cat# ab215715, Abcam, Cambridge, MA, USA), TIMP1 (Cat# sc-21734, Santa Cruz, CA, USA), and TUBA1A (Cat# ab7291, Abcam, Cambridge, MA, USA). The antibodies were diluted in line with the instructions. We captured the membrane as a digital image on the ChemiDoc immunoblot detection system (Bio-Rad, Hercules, CA, USA). ImageJ software (National Institutes of Health, SA, USA) was used to quantify the bands.
Serum measurement
The blood samples were centrifuged at 1500 rpm for 10 min to obtain serum, which was rapidly frozen for further analysis. Serum levels of aspartate aminotransferase (AST), alanine aminotransferase (ALT), and total bilirubin (TBil) were measured using an automated biochemical analyzer (Abbott Laboratories, USA).
Liver histopathology
After harvesting, the rat liver tissue was fixed with 4% paraformaldehyde, embedded in paraffin, and sliced into 5-µm-thick sections. The tissue sections were stained with hematoxylin–eosin (HE), Sirius red, and Masson trichrome dyes, and inflammation, fibrosis, and structural changes were observed under a Nikon optical microscope.
Statistical analysis
All statistical analyses in this study were conducted using GraphPad Prism 10.0, and unless otherwise specified, data are presented as mean ± standard deviation. We calculated the statistical difference between two groups using a two-sided Student t-test, and performed one-way analysis of variance for comparisons more than two groups. Statistical differences with P values less than 0.05 were considered significant (*P < 0.05, **P < 0.01, ***P < 0.001, and ****P < 0.0001). Detailed statistical information for each experiment is provided in the corresponding legend. Unless otherwise specified in the legend, all in vitro experiments were conducted in triplicate.


Comments (0)