
Remember me

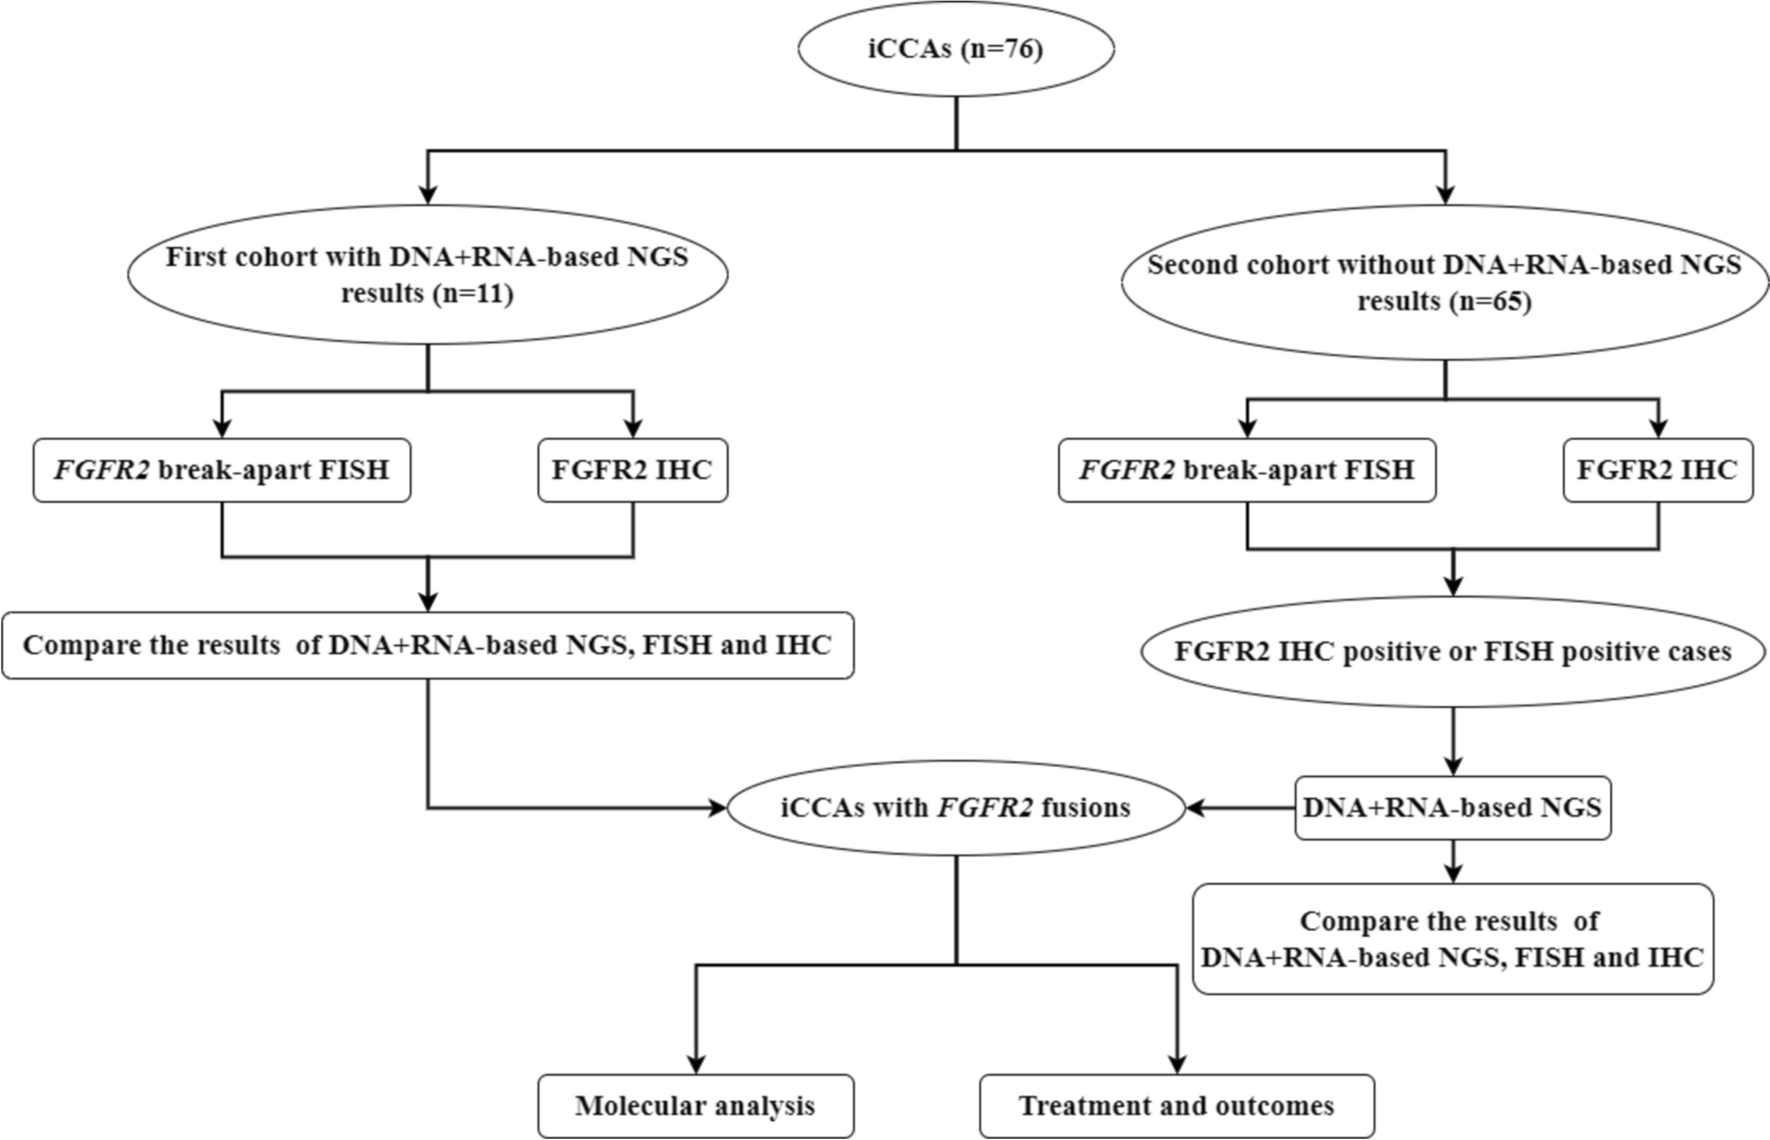

This single-center, prospective study was conducted between October 2020 and December 2023 (Fig. 1). The study population comprised consecutive patients with LC for whom EGD, SHAPE, LSM, SSM, and clinical data were available. The inclusion criteria were age ≥ 20 years, known LC, and willingness and ability to participate. LC diagnosis was made as described previously based on the results of histologic examination of the liver tissue or combined physical, laboratory, and radiologic findings [24, 25]. The etiologies of LC included viral hepatitis, alcohol-associated liver disease, and metabolic dysfunction-associated steatotic liver disease, with the diagnostic definitions detailed in Online Resource 1, Materials and Methods 1. Exclusion criteria were β-blocker use (n = 6), episodes of recent (< 3 months) gastrointestinal bleeding (n = 3), post-splenectomy (n = 2), PV thrombosis (n = 1) and refusal to enroll (n = 1).
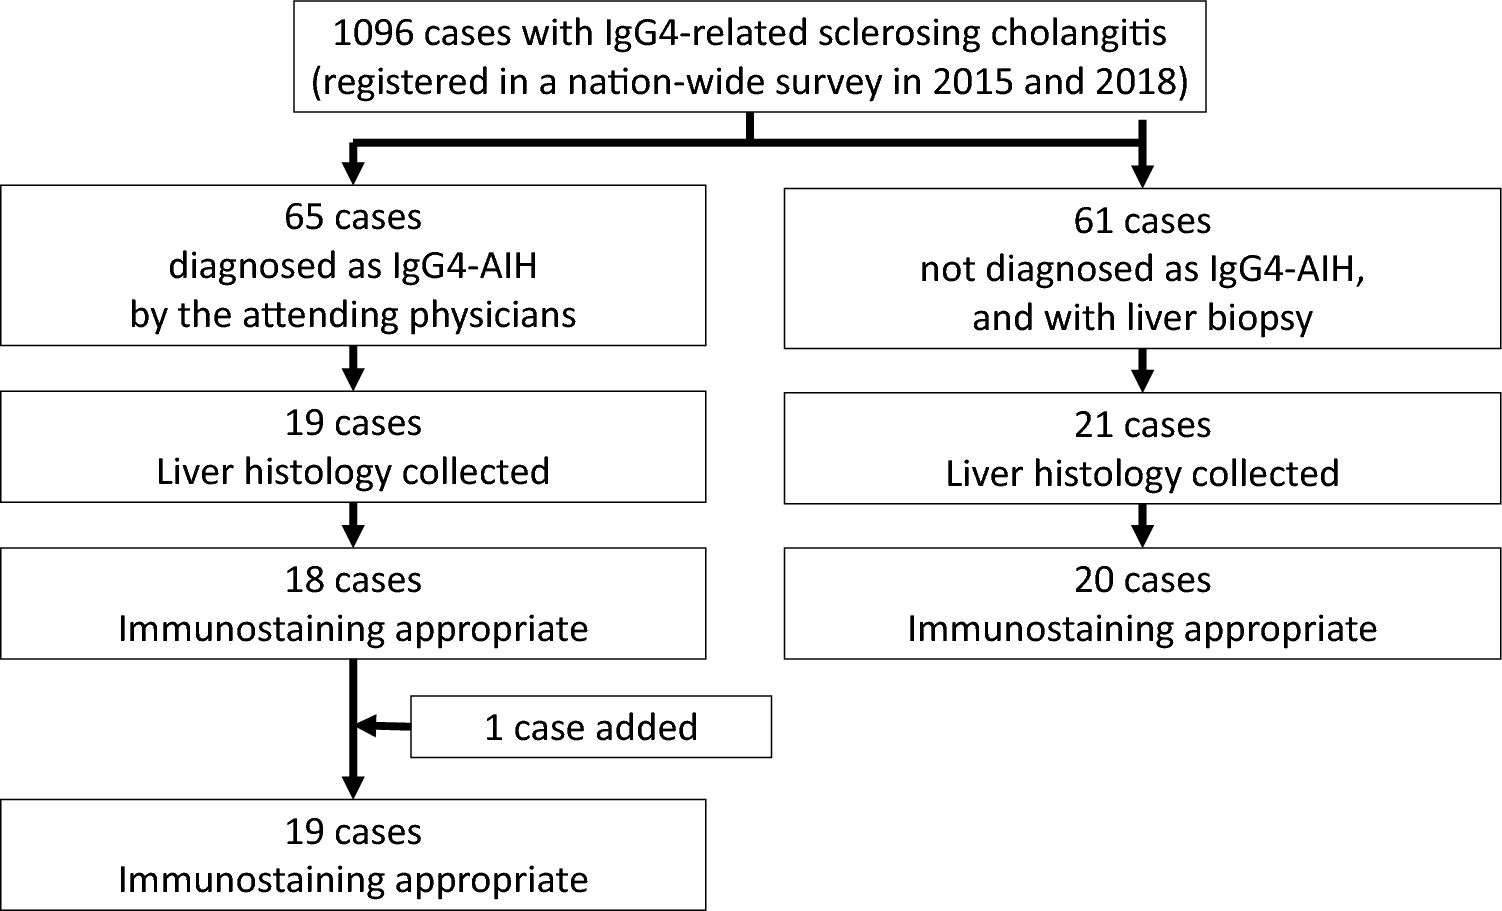
Fig. 1
Flow chart of eligible patients with chronic liver disease. EV esophagogastric varices, RC red color, SHAPE subharmonic-aided pressure estimation, SWE shear wave elastography, UGE upper gastrointestinal endoscopy, VCTE vibration-controlled transient elastography
The primary endpoint of this study was the predictive values of SHAPE, Baveno VII criteria, LSM, and SSM for the diagnosis of high-risk EV. All protocols of this study were approved by the Institutional Review Board of Iwate Medical University (approval number: MH2019-102). All patients provided written informed consent before the study according to the principles of the Declaration of Helsinki (revision of Fortaleza, 2013).
SHAPESHAPE was performed using a LOGIQ E10 US system, with a C1-6-D probe (GE HealthCare, Wauwatosa, WI, USA) on the same day as LSM and SSM and before EGD. SHAPE analysis was performed by two hepatologists (H. K. and T. A. with at least 15 years of experience in abdominal US examinations), who were blinded to EGD findings and clinical data of the patients.
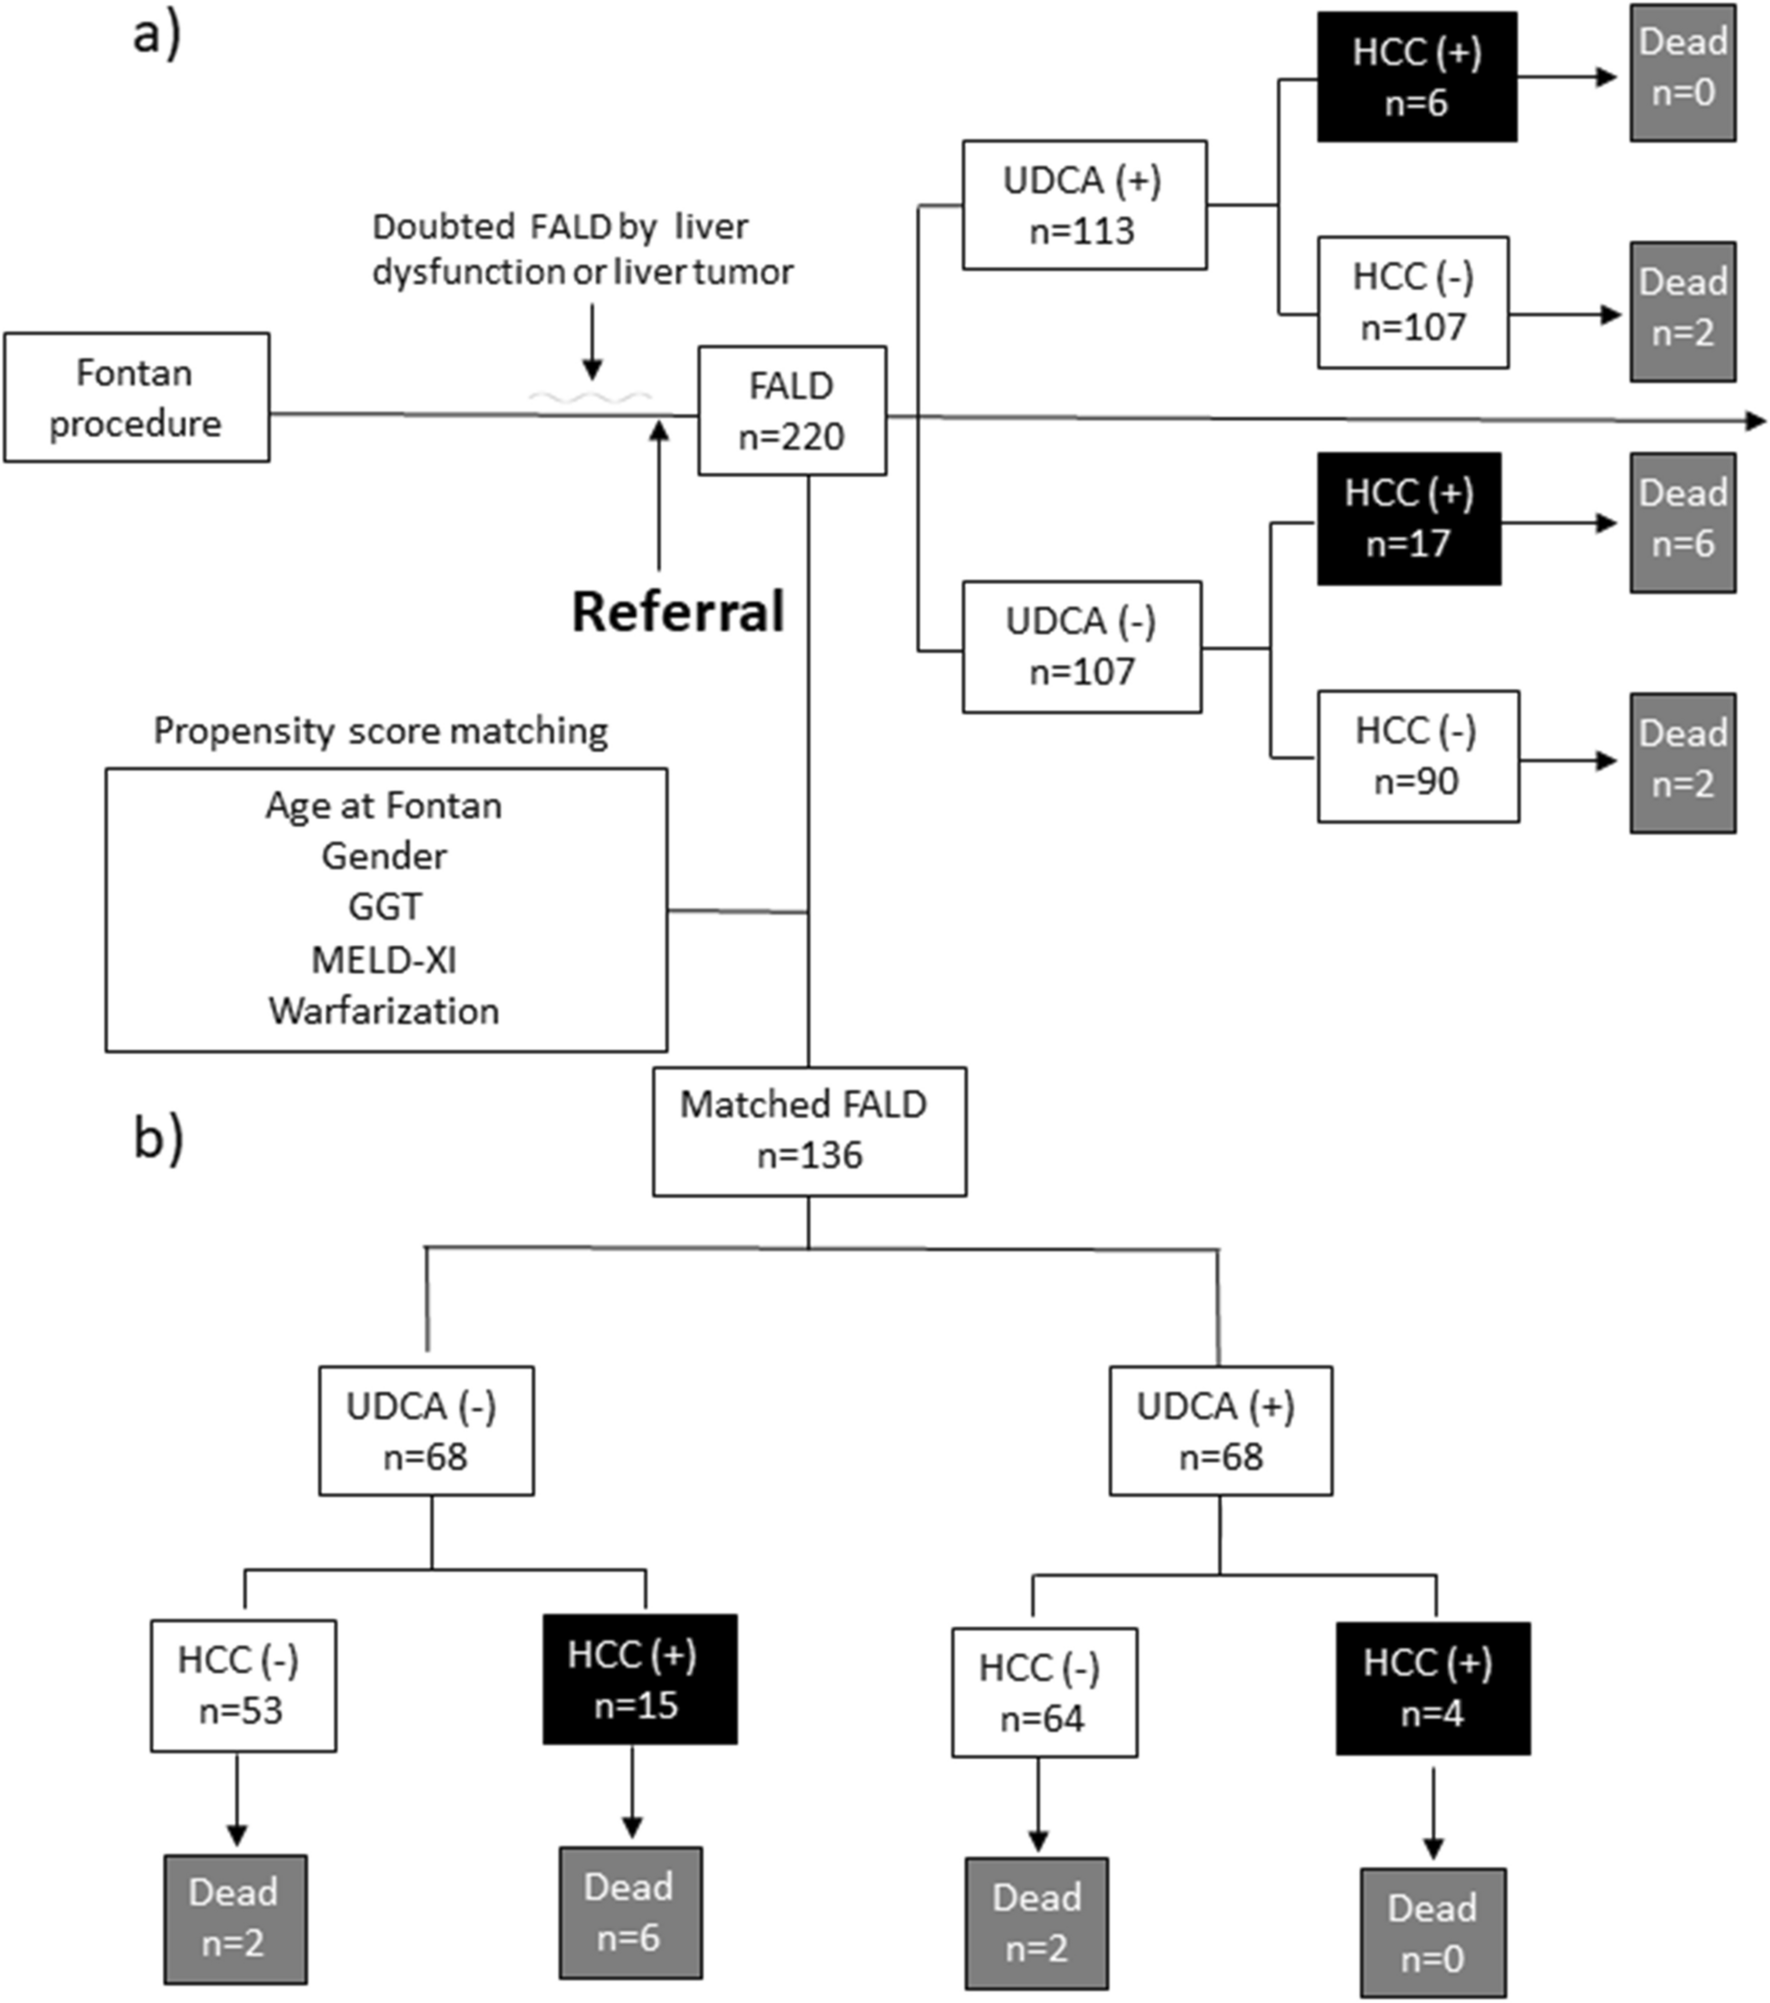
First, the US cross-sectional, right intercostal view with simultaneous right PV and right hepatic vein (HV) images was obtained (Fig. 2a). Second, cine recordings for SHAPE analysis were started 90 s after intravenous injection of Sonazoid® (perfluorobutane microbubbles, GE HealthCare, Oslo, Norway) at a dose of 0.0075 mL/kg (Fig. 2b). To estimate the absolute hydrostatic pressure, the US sound pressure within the region of interest was kept constant. Since the efficacy of the acoustic power optimization method has been reported previously [20, 26], cine clips were recorded and stored for 20 s, during which the mechanical index (MI) incrementally increased by + 0.05 every 0.5 s under continuing breath-holding. The default parameters of the US system were, 57 dB for dynamic range, 37 cm for gain, and 15 cm for depth under full focus view. Third, time intensity curve analysis was performed using the software integrated into the US equipment. For the measurement, a region of interest with a 10-mm diameter for the PV and HV at the same depth was chosen. Subsequently, a graph depicting the relationship between the amplitudes and acoustic output of the subharmonic signal was automatically generated by the software. According to a previous report [27], the acoustic power corresponding to the subharmonic response most sensitive to changes in the hydrostatic pressure should be identified by its maximum slope. We selected the point of maximum slope of the PV as the optimum power (Fig. 2c). Finally, the HV minus the PV at the optimum power (HV-PV) was calculated for the SHAPE gradient measurement (Fig. 2d, e, f). The HV-PV was measured thrice for each patient to investigate the intra-observer variability. Furthermore, the HV-PV of all patients was successively evaluated by two investigators to determine interobserver variability.
Fig. 2
Identification of an ultrasound section that can simultaneously depict the right portal vein (PV) and hepatic vein (HV) at the same depth. a An image example of PV and HV identification using a color Doppler ultrasound examination. b Sample images of subharmonic contrast when the mechanical index is gradually increased. c An example of time intensity curve analysis, and the results for patients without varices (null-risk group); d those with straight, small-caliber varices (low-risk group); e and those with moderately enlarged varices (high-risk group) (f). The HV-PV values of the “Null-risk,” “Low-risk,” and “High-risk” groups are − 9.7, − 5.1, and − 1.8 dB, respectively
LSM and SSMLSM was performed using a LOGIQ E10 with a C1-6-D probe and a FibroScan® 502 Touch with an M or XL probe (Echosens, Paris, France). The LSM and SSM techniques and examination procedures have been previously described [28,29,30,31,32]. LSM and SSM are detailed in Online Resource 1, Materials and Methods 2 and 3.
Evaluation of EVsEV was evaluated endoscopically based on the published general rules for recording their endoscopic findings (second edition) [33]. The endoscopic findings were recorded in the form (F) of EV and the red color sign (RCS). EV was classified into four groups according to form and size. F0 lesions were lacking in varicose appearance; F1 lesions were straight, small-calibered varices; F2 lesions were moderately enlarged, beady varices; and F3 lesions were markedly enlarged, nodular, or tumor-shaped varices. RC signs of the EVs were graded 0, 1, 2, or 3 according to their density and distribution (RC0, absent; RC1, small in number and localized; RC2, intermediate between RC1 and RC3; RC3, large in number and circumferential). RC signs for gastric varices were graded as 0 or 1 (RC0, absent; RC, present with red-wale markings).
Based on the evaluation of varices and Child–Pugh grade, EV risk was stratified into three groups—no EV was regarded as null-risk; low-risk was defined as fulfilling the F1 form, negative RCS and Child–Pugh grade A or B; high-risk was defined as EV other than null and low risks.
Statistical analysesBased on the formula described by Karimollah et al. [34], we determined that the sample sizes for sensitivity and specificity were 95 and 110, respectively.
Data are presented as medians with interquartile ranges [25th and 75th percentiles]. Intra-observer agreement was assessed using the intraclass correlation coefficient (ICC) for the HV-PV gradient values. Thus, a sample size of 111 was finally selected. The Kruskal–Wallis test with Steel–Dwass post hoc tests was used to compare the three groups. The relationships between the clinical parameters and HV-PV values were examined using Spearman's rank correlation coefficients. The efficacy of the parameter in discriminating high-risk EV was evaluated using receiver operating characteristic curve analyses and category-free net reclassification improvement (cfNRI). Diagnostic performance variance across the models was explored by comparing the area under the curve (AUC) values analogous to the Harrell's concordance index (C-index). The highest Youden's J statistic was used to determine the optimal cutoffs for identifying the high-risk EV. Sensitivity, specificity, positive predictive values, negative predictive values, and positive and negative likelihood ratios were computed based on the AUC-derived cutoffs. AUC comparisons were performed using DeLong’s test. The model was internally validated using 1000 bootstrap samples. Calibration (agreement between observed and predicted outcomes) was assessed using calibration plots and a smoothing technique based on locally estimated scatterplot smoothing. Statistical significance was set at P < 0.05. All statistical analyses were conducted using EZR (version 1.53; Saitama Medical Center, Jichi Medical University), a graphical user interface for the R software (R Foundation for Statistical Computing).
Comments (0)