Animals
All animal experiments and conducted procedures were in accordance with the law on animal experimentation and are approved by the regulatory authorities. The work has been reported in line with the ARRIVE guidelines 2.0.
To establish the dry eye-dry keratoconjunctivitis model, twelve 1-year-old healthy male crossbreeds weighing 2.0 ± 0.5 kg were obtained from the Experimental Animal Center of Northwest Agriculture and Forestry University. Additionally, three 1-year-old healthy male crossbreeds weighing 2.0 ± 0.5 kg were utilized as the normal control. For the ADMSC isolation, a 6-month-old female hybrid dog weighing 1.5 kg was obtained from the Laboratory Animal Center of Northwest A&F University. All animal experimental protocols were conducted in strict accordance with the Guide for the Care and Use of Laboratory Animals (Ministry of Science and Technology of the People’s Republic of China, Policy No. GB/T35892-2018). The animals were housed in routine sanitary facilities with the required constant temperature and relative humidity.
Cell isolation and culture
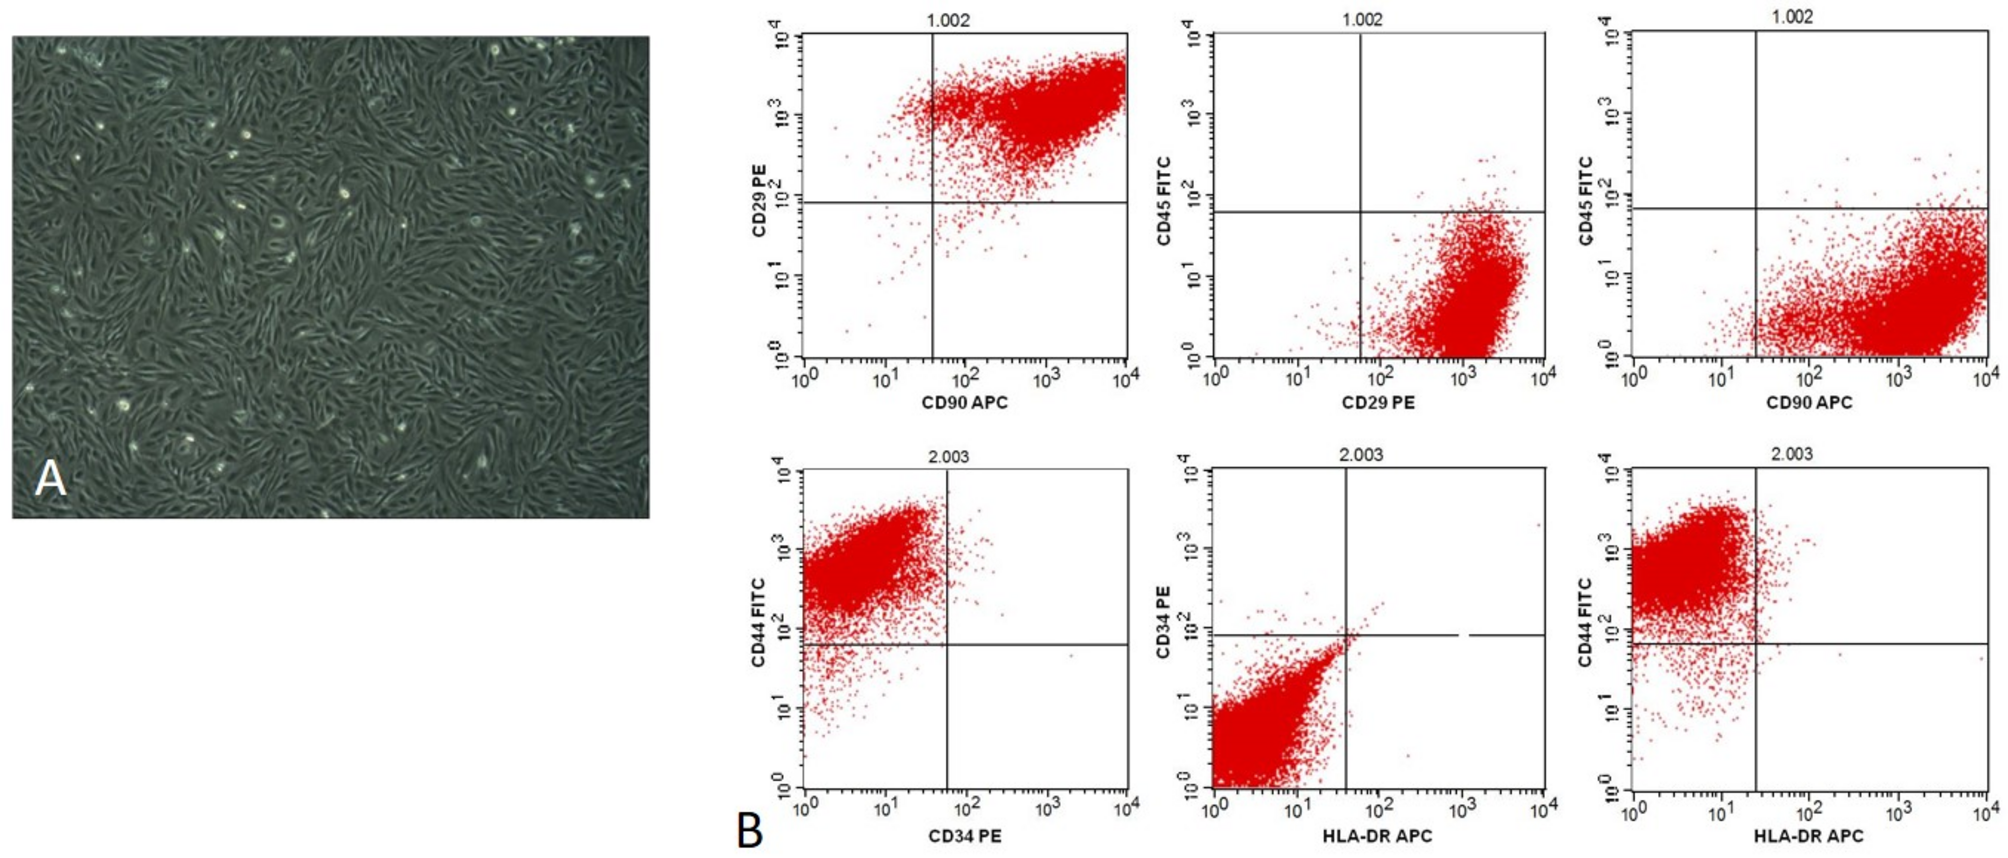
ADMSC were derived from the abdominal subcutaneous adipose tissue of a 6-month-old female crossbred dog, as female dogs generally have more adipose content. The detailed ADMSC isolation steps and the identification of ADMSC and the establishment of the ADMSC immortalized cell line were described in our previous report [21]. Cells were cultured at 37 °C and 5% CO2 incubator in α-MEM (Invitrogen, Carlsbad, CA, USA) complete medium with 10% FBS (Gibco original, origin Australia). When cells were attached to the bottom of the plate at approximately 80% density, a 1:3 passaging was performed. Cells were frozen using DMSO cell freezing solution (Beyotime) [22, 23]. We used cells that were passaged to the third generation after resuscitation in all subsequent experiments.
Establishment of ADMSC cell lines overexpressing SPARC
The lentiviral expression vector for SPARC was reconstructed by inserting SPARC into the polyclonal site (CMV) of the pCDH-CMV-MSC-EF1 vector. Subsequently, this plasmid was transfected into 293T cells in the presence of two helper plasmids (PAX, VSVG) for lentiviral packaging. After 48 h of viral tapping, the cell supernatant was collected and the virus particles were purified and concentrated. The concentrated virus particles were then tapped into immortalized ADMSC cell lines for further experimentation. Green fluorescence-positive cell clones were screened using 1 µg/mL Puromycin, and single-cell clones displaying green fluorescence were selected through the dilution method. Finally, the selected clones were expanded in culture to measure mRNA levels using real-time quantitative PCR and protein levels using ELISA [24].
Real-time fluorescence quantitative polymerase chain reaction analysis
Total RNA was extracted from ADMSC-CMV and ADMSC-OESPARC using TRIzol reagent (Takara, Japan) according to the instructions provided by the reagent vendors. The extracted RNA was then reverse transcribed to cDNA using a reverse transcriptase kit (Thermo Fisher Scientific). Subsequently, a quantitative real-time polymerase chain reaction (qRT-PCR) was carried out using a CFX96 real-time PCR system. The qRT-PCR protocol involved pre-denaturation at 94 °C for 5 min, denaturation at 94 °C for 30 s, annealing at 58 °C for 30 s, extension at 70 °C for 30 s, and a total of 39 cycles. As an internal reference, GAPDH was used. The relative expression of genes was evaluated through the utilization of comparative CT values obtained from the qRT-PCR. The following primer sequences were used: GAPDH, F: GCTGCCAAATATGACGACATCA, R:GTAGCCCAGGATGCCTTTGAG; SPARC, F:ATGAGGGCCTGGATCTTCTT, R: TTAGATCACAAGATCCTTGT [25].
Detection of SPARC protein levels in cells by ELISA
SPARC levels in ADMSC-CMV and ADMSC-OESPARC supernatants were determined by double-antibody sandwich assay using the enzyme-linked immunoassay 96T kit for cysteine-rich acidic protein (SPARC), and five replicate wells were set up for each group. The assay was performed according to the instructions provided by the reagent supplier (FANKEWEI, Shanghai, China). Absorbance (OD) was measured at 450 nm using an enzyme counter and the concentration of SPARC in the samples was calculated from the standard curve [26].
Cell growth curves
Both ADMSC-CMV and ADMSC-OESPARC groups of cells were inoculated into 24-well plates at 5 × 10³ cells per well. The medium in the plates was changed daily using α-MEM (+). Cells were manually counted in 3 wells of each group every 24 h. This process was repeated until day 8. Finally, based on the cell count results, a cell growth curve was plotted, with the horizontal coordinate indicating time and the vertical coordinate indicating the number of cells [27].
EdU cell proliferation assay
Cells in logarithmic growth phase were used in this study. First, ADMSC-CMV and ADMSC-OESPARC cells were inoculated into 96-well plates with approximately 1 × 10³ cells per well. The plates were then cultured until reaching a density of 60–70%. After discarding the culture medium, EdU staining was performed based on the instructions provided by the reagent vendor (Reebok Bio, Guangzhou, China). The staining process was observed and photographed under a fluorescence microscope immediately upon completion. Multiple fields of view were randomly selected for each sample, followed by the counting of EdU fluorescence-positive cells and calculation of the percentage of positive cells using Image J [28].
In vivo potency studiesModels of canine dry eye disease
After a 3-week acclimatization period, fifteen male crossbred dogs were randomly divided into five groups: normal, dry eye self-healing control, cyclosporine-treated, ADMSC-CMV-treated, and ADMSC-OESPARC-treated, three dogs in each group. To model canine dry eye, all dogs, except the normal group, were given 0.25% benzalkonium chloride drops in both eyes twice a day for seven consecutive days [29]. From day 8 onwards, different treatments were administered to each group. The dry eye self-healing control dogs received 0.7% saline drops in both eyes once a day for eight consecutive days. The cyclosporine treatment group received cyclosporine ophthalmic solution in both eyes once a day for eight consecutive days. The ADMSC-CMV treatment group received 200 µL of 0.7% saline suspension containing 1 × 10⁵ ADMSC in both eyes once a day for eight consecutive days. Similarly, the ADMSC-OESPARC treatment group received 200 µL of 0.7% saline suspension containing 1 × 10⁵ ADMSC in both eyes once a day for eight consecutive days [30, 31]. Each time the 0.7% saline cell suspension was freshly prepared before using, with no more than a 15-minute interval between isolation of the cells from the petri dish and their use on the surface of the experimental dog’s eye.
Ocular surface inflammation index
Ocular surface inflammation was observed in dogs at eight time points: day 1, day 3, day 5, day 7, day 9, day 11, day 13, and day 15 of the experiment. The dogs were anesthetized with 1% sodium pentobarbital 0.1 mL/ 10 g intraperitoneally and kept sedentary to facilitate the detection of various dry eye indices. Ciliary congestion (absent, 0; present but less than 1 mm, 1; present and greater than 1 mm less than 2 mm, 2; present and greater than 2 mm, 3); central corneal edema, peripheral corneal edema and peripheral corneal edema (absent, 0; present but clear iris texture can be seen, 1; present but clear iris texture cannot be seen, 2; present but pupil cannot be seen, 3). The sum of the three scores is the final Keratoconus Inflammation Index, and it is important that the same person who don’t know the grouping situation performed and scored each operation [32, 33].
Corneal sodium fluorescein staining
The corneal fluorescein sodium staining method is commonly used in clinical practice to evaluate the integrity of the corneal epithelium. A positive result indicates a corneal epithelial defect, suggesting discontinuity of the corneal epithelial cell layer. Corneal sodium fluorescein staining experiments were performed at five time points: day 1, day 3, day 7, day 9, and day 15 of the experiment. To perform the staining, 0.5 mL of 2% liquid fluorescein sodium was pipetted onto the surface of the canine eye using a 1 mL spiking gun. After 2 min, corneal epithelial staining was observed under cobalt light using a slit lamp, and photographs were taken to record the staining. The cornea was divided into four regions: supratemporal, infratemporal, supranasal, and infranasal. A scoring system ranging from 0 to 4 was used to evaluate each region’s staining. The scoring criteria were as follows: no staining (0 points), scattered punctate staining (1 point), slight diffuse punctate staining (2 points), severe diffuse staining but not in obvious lamellae (3 points), and obvious lamellar staining (4 points). After scoring was completed for each region, the scores were totaled. It is important that the same person who don’t know the grouping situation performed and scored each operation [34].
Tear secretion experiments
Tear volume was measured at four time points: day 1, day 7, day 10, and day 15 of the experiment. In order to ensure accurate measurements, precautions were taken to avoid the use of eye drops and bright light stimulation in the examination room prior to the assessment. The measurement technique involved using a 40 mm×5 mm strip of Whatman 41# filter paper. This strip was carefully folded at a right angle using sterile forceps and then clamped inside the conjunctival sac at the inner 1/3 of the lower eyelid. The other end of the strip was hung on the outside of the lower eyelid and left in place for 2 min. After this time, the wet length of the strip was observed and recorded. According to the established criteria, a wet length of 15 mm to 25 mm was considered normal, while a wet length of 11 mm to 14 mm indicated early dry eye. A wet length of 6 mm to 10 mm was classified as moderate dry eye, and a wet length of ≤ 5 mm was indicative of severe dry eye [35].
Collection of canine serum
On the 15th day of experiment, serum was collected from all groups of dogs. To collect the serum, blood was drawn from the cephalic vein of the forearm. Before drawing the blood, the hair in the area was clipped, and the skin was sterilized with iodine and alcohol. The blood collector then tightly held the upper part of the clipped area using the thumb and forefinger of the left hand. This caused the veins of the lower limbs to fill. With the syringe attached to the 6-gauge needle, the right hand quickly punctured into the vein, and blood was withdrawn at an appropriate speed. Once 2 mL of whole blood was drawn, the needle was removed, and the blood was slowly injected into a 1.5 mL centrifuge tube along the wall. The tube, containing the blood, was placed in a 37℃ warm box for 1 h to promote coagulation. Afterward, centrifugation was performed at 2000 rpm for 10 min. This step aided in collection of the supernatant while avoiding aspiration of impurities. During this process, the serum appeared clear and transparent, either colorless or slightly yellow. Finally, the collected canine serum was stored in portions at -20 °C [27].
Histological analysis
After 8 days of treatment, dogs in the dry eye model group and the remaining four groups were euthanized by intraperitoneal injection of an overdose of anesthetics (Ketamine and Xylazine). Periocular tissues, such as corneal tissues and transient membrane glands, were gently separated and collected. These tissues were then washed with PBS and fixed with a 4% paraformaldehyde solution fixative at 4 °C for 24 h. Following fixation, the tissues were gradually dehydrated, embedded in paraffin wax, and sliced into 4 µM sections. Hematoxylin-eosin (H&E) staining and peridynamic acid-schiff (PAS) staining were performed according to the instructions of the reagent vendor (Beyotime). Morphological changes of corneal epithelial cells and transient membrane gland tissues were observed under a light microscope, starting from low magnification and progressing to high magnification. Histopathological observation of the ocular surface was conducted, with 3 sections observed, recorded, and photographed in each eye [36].
Immunohistochemistry staining
Eye sections were deparaffinized twice with xylene for 10 min each time. Then, they were deparaffinized with a xylene-ethanol mixture for 5 min, followed by sequential washing with anhydrous ethanol for 5 min, 95% alcohol for 5 min, 85% alcohol for 5 min, 75% alcohol for 5 min, 50% alcohol for 5 min, and distilled water twice for 2 min each time. Next, Tris/EDTA pH 9.0 restoration buffer was used for antigen repair by microwaving the sections for 15–20 min and allowing them to cool at room temperature. After three washes with PBS, the sections were treated with 3% H2O2 for 15 min to eliminate endogenous peroxidase activity, and the tissues were blocked with animal serum. Incubation with PCNA antibody (1:150; immunoway Inc) was carried out overnight at 4 °C. Subsequently, the sections were washed three times with PBS and incubated with horseradish peroxidase-labeled streptavidin working solution for 30 min. After three more washes with PBS, the sections were treated with DAB chromogenic solution for color development and hematoxylin staining solution for nuclear staining. Finally, the samples were dehydrated, sealed with drops of neutral resin, and analyzed under a light microscope [36].
ELISA for inflammatory factors
The levels of interleukin-6 (IL-6), interleukin-1β (IL-1β), and tumor necrosis factor-α (TNF-α) in the serum of each group of dogs were determined by double antibody sandwich assay using the 96T ELISA kits for canine IL-6, canine IL-1β, and canine TNF-α, respectively. The assay procedure was performed according to the instructions provided by the reagent supplier (FANKEWEI, Shanghai, China). Five replicate wells were set up in each group of canine sera for the determination of these three inflammatory factors. The absorbance (OD) was measured at 450 nm with an enzyme meter, and the concentrations of IL-6, IL-1β, and TNF-α in the serum of the samples were calculated by a standard curve [26].
In vitro efficacy studiesHuman corneal epithelial cell culture
HCECs cells, gifted by Dr. Shaohui Pan from Wenzhou Medical University, were cultured in an incubator at 37 ℃ with 5% CO2 using DMEM/F12 medium (Invitrogen, Carlsbad, CA, USA) containing 10% FBS and 1% ITS (insulin-transferrin-selenium-aminoethanol) (both from Gibco original, origin Australia). When the cell density reached approximately 80%, the cells were digested and passaged using 0.25% trypsin. For different experimental requirements, the HCECs were inoculated into 6-well, 48-well, and 96-well plates [37, 38].
Cell scratch experiment
Mark a horizontal line on the back of the 6-well plate for observation, inoculate HCECs cells equally into the prepared 6-well plate, waiting for the cells to fully integrate, use a 200 µL tip perpendicular to the marked horizontal line, scrape off the cells with equal widths, and make cell scratches. Excess supernatant should be aspirated, and the cells should be washed twice by adding PBS. The HCECs should be then classified into two groups: the culture group with ADMSC-CMV supernatant and the culture group with ADMSC-OESRARC supernatant. In the first group, 1mL of ADMSC-CMV supernatant and 1mL of DMEM/F12 medium containing 2% serum should be added. In the second group, 1mL of ADMSC-OESRARC supernatant and 1mL of DMEM/F12 medium containing 2% serum were added. Subsequently, the cells were cultured, and the width of the scratch should be photographed and recorded at 12 h and 24 h [27]. The culture solution of ADMSC used was as described in 2.2.
Giemsa staining
In 48-well plates, 250 µL/well of HCECs cell suspension was inoculated. The plates were divided into four groups: normal control group, untreated model group, ADMSC-CMV supernatant culture group, and ADMSC-OESRARC supernatant culture group. Each group consisted of three replicate wells. Use culture solution as described in 2.9.1. After the cells were adhered to the wall, except for the normal control group, each group was treated with benzalkonium chloride (1 µg/mL per well) for 24 h [39]. Following this treatment, the culture medium was changed. In the ADMSC-CMV supernatant culture group, 125 µL of ADMSC-CMV supernatant and 125 µL of DMEM/F12 medium containing 10% serum were added. Similarly, in the ADMSC-OESRARC supernatant culture group, 125 µL of ADMSC-OESRARC supernatant and 125 µL of DMEM/F12 medium containing 10% serum were added. The culture solution of ADMSC used was as described in 2.2. In the untreated model group, 250 µL of normal DMEM/F12 medium containing 10% serum was added, and the cells were cultured for an additional 24 h. Subsequently, the cell supernatant of each group was discarded. The cells were then fixed with 4% paraformaldehyde at room temperature for 20 min, washed three times with PBS, and stained with the configured Giemsa Staining Solution working solution dropwise for 15 min. After three additional washes with PBS, the cells were observed and photographed under a light microscope, following the instructions provided by the Giemsa Staining Kit (Beyotime) [25].
CCK-8 cell proliferation assay
The 96-well plate was inoculated with HCECs cell suspension (100 µL/well), divided into four groups, namely the normal control group, untreated model group, ADMSC-CMV supernatant culture group, and ADMSC-OESRARC supernatant culture group. Each group consisted of 5 replicate wells. Use culture solution was described as in 2.9.1. After the cells adhered to the wall, benzalkonium chloride was added to each well (except for the normal control group) at 1 µg/mL for 24 h. Then, the culture medium was changed. For the ADMSC-CMV supernatant culture group, 50 µL of ADMSC-CMV supernatant and 50 µL of DMEM/F12 medium containing 10% serum were added. Similarly, for the ADMSC-OESRARC supernatant culture group, 50 µL of ADMSC-OESRARC supernatant and 50 µL of DMEM/F12 medium containing 10% serum were added. The culture solution of ADMSC used was as described in 2.2. The untreated model group received 100 µL of plain DMEM/F12 medium containing 10% serum. After incubating the cells for an additional 24 h, according to the reagent vendor’s instructions (Mishushengwu, Xian, China), 10 µL of CCK-8 solution was added to each well. The cells were incubated for another hour in a cell culture incubator, and the absorbance value at 450 nm was measured using an enzyme marker [40].
Real-time fluorescence quantitative polymerase chain reaction analysis
The six-well plates were first inoculated with HCECs cell suspensions (2 mL/well) and then divided into four groups: normal control group, untreated model group, ADMSC-CMV supernatant culture group, and ADMSC-OESRARC supernatant culture group. Use culture solution as described in 2.9.1. The cells were allowed to attach to the wall, and benzalkonium chloride was added to each group (except the normal control group) at a concentration of 1 µg/mL per well for 24 h. After that, the culture medium was changed. In the ADMSC-CMV supernatant culture group, 1 mL of ADMSC-CMV supernatant and 1mL of DMEM/F12 medium containing 10% serum were added. Similarly, in the ADMSC-OESRARC supernatant culture group, 1mL of ADMSC-OESRARC supernatant and 1mL of DMEM/F12 medium containing 10% serum were added. The culture solution of ADMSC used was as described in 2.2. As for the untreated model group, 2mL of plain DMEM/F12 medium containing 10% serum was replaced and the cells were incubated for an additional 24 h, the total RNA was extracted from the HCECs of each group using the TRIzol reagent (Takara, Japan) according to the instructions of reagent vendors. Reverse transcription to cDNA was performed using a reverse transcriptase kit (Thermo Fisher Scientific). quantitative real-time polymerase chain reaction (qRT-PCR) was performed using the CFX96 Real-Time Polymerase Chain Reaction (PCR) System: pre-denaturation at 94 °C for 5 min, denaturation at 94 °C for 30 s, annealing at 58 °C for 30 s, and extension at 70 °C for 30 s. 39 cycles. GAPDH was used as an internal reference. The relative expression of inflammatory factors IL-10, TNF-α, MMP9 and epidermal growth factor EGF was measured using the comparative CT values of qRT-PCR. The primer sequences were as follows: GAPDH, F: GCTGCCAAATATGACGACATCA, R: GTAGCCCAGGATGCCTTTGAG; IL-10, F: TTGCCTGGTCCTCCTGACTG, R: GTCTTCACTCTGCTGAAGGCA; TNF-α, F: CCCGAGTGACAAGCCTGTAG, R: TGAGGTACAGGCCCTCTGAT; MMP, F: GGACAAGCTCTTCGGCTTCT, R: TCGCTGGTACAGGTCGAGTA; EGF, F: GTGAGATGGGTGTGTCCCAGTG, R: GGGGTGGAGTAGAGTCAAGA [4].
Flow cytometry
First, HCECs cell suspension was inoculated into 6-well plates, following the grouping and processing methods outlined in Sect. 2.9.5. The cells were then incubated for 24 h. After that, the cell culture solution from each group was aspirated into a suitable centrifuge tube. Next, the adherent cells were washed once with PBS and digested with 0.25% trypsin. The cell culture solution collected earlier was added to the digestion mix, and the cells were gently blown down and transferred to a centrifuge tube. Subsequently, each group of HCECs was stained using the Annexin V-FITC Apoptosis Detection Kit according to the instructions provided by the reagent vendor (Beyotime). After resuspending 100,000 HCECs cells, the suspension was centrifuged, and the supernatant was discarded. Then, 195 µL of Annexin V-FITC conjugate was added to gently resuspend the cells. Next, 5 µL of Annexin V-FITC was added and gently mixed, followed by the addition of 10 µL of propidium iodide (PI) staining solution, also gently mixed. The cells were incubated at room temperature and protected from light for 15 min. Finally, the cells were analyzed using an analytical flow cytometer, and apoptosis was detected in each group. Additionally, In situ FITC/PI double-staining fluorescence assay was also performed on adherent cells to corroborate the results of flow cytometry [42].
Cellular immunofluorescence
The cells were inoculated in 96-well plates and grouped according to the treatment described in Sect. 2.9.4. Following a 24 h incubation period, the cells were washed with PBS. Subsequently, the cells in each group were fixed using 4% paraformaldehyde at room temperature for 20 min and then washed three times with PBS. To break the membrane, a solution of 0.2–0.5% Triton X-100 dissolved in citrate buffer was added and incubated for 15 min at room temperature. After washing with PBS three more times, each well was blocked with 70 µL of 10% FBS at room temperature for 1 h. Once the FBS was aspirated, 40 µL of primary antibody (PCNA at 1:100 dilution and Ki67 at 1:100 dilution, both from immunoway) was added to each well and incubated overnight at 4 °C. The cells were then washed three times with PBS, and 30 µL of hochest33342 was added to each well. The reaction was carried out at room temperature for 5 min, after which the cells were observed and photographed under a fluorescence microscope [43].
RNA sequencing
The cells were divided into ADMSC-CMV group and ADMSC-OESRARC group, and the cell samples were collected and sent to Shanghai Jiayin Biotechnology Ltd. for transcriptome sequencing comparison according to the company’s delivery requirements. Gene Ontology (GO) enrichment of potential target gene information and Kyoto Encyclopedia of Genes and Genomes (KEGG) pathway annotation analysis were performed using annotation databases, and pathways with a P value < 0.05 were considered reliable.
Statistical analysis
Statistical analysis was performed using IBM Corporation’s SPSS version 19.0 software (Chicago, IL, USA). All experimental data were examined using one-way analysis of variance (ANOVA) and are presented as mean SD±. Statistical significance was observed in the comparisons if the p-value was less than 0.05. GraphPad Prism software was used to analyze all the data.


Comments (0)