
Remember me

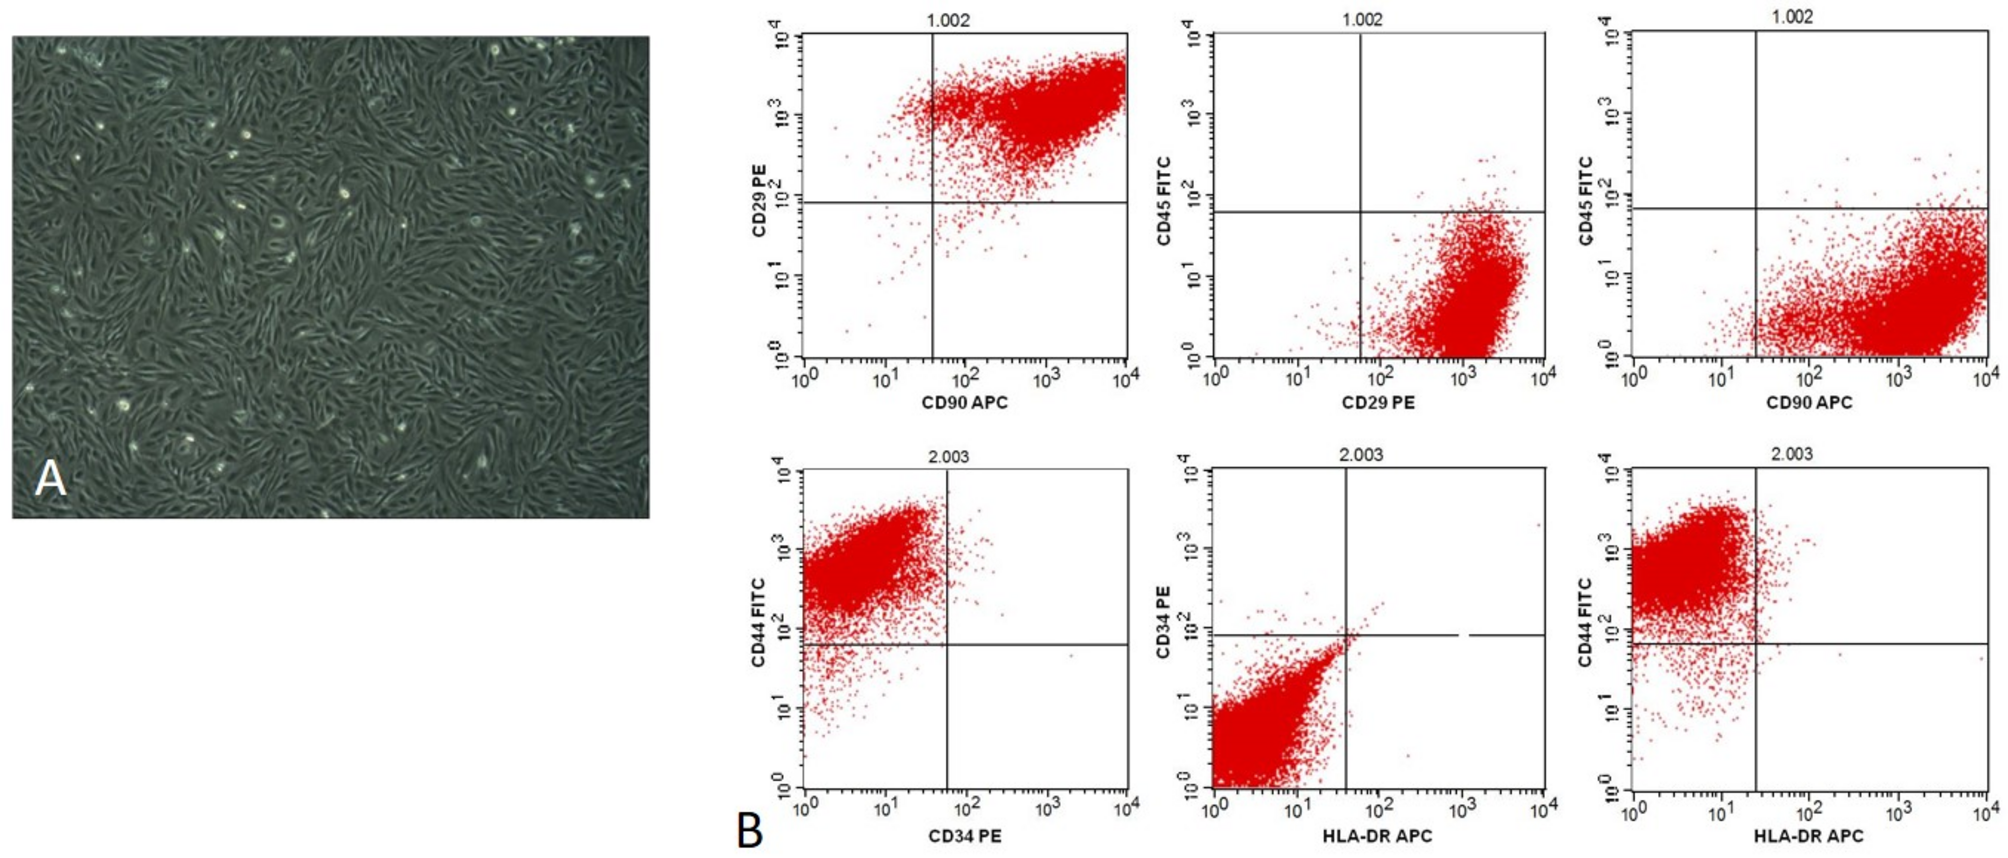


To determine whether iPericytes have the morphological characteristics of pericytes, we collected phase contrast micrographs of mesoderm and neural crest iPericytes and HBVPs and assessed the morphological features of each cell type. Throughout the differentiation process, mesoderm and neural crest iPericytes possessed similar morphological features (Additional file 1: Fig. S2). After differentiation, mesoderm and neural crest iPericytes had elongated fusiform cell bodies, that were similar in morphology to HBVPs (Fig. 1A, Additional file 1: Fig. S2). In vitro, HBVPs adopt several morphological phenotypes, that relate to different contractile “subsets” [24]. Mesoderm and neural crest iPericytes cultures also contained each of these morphological phenotypes (Additional file 1: Fig. S3) and in proportions similar to those reported for HBVPs [24]. To determine whether iPericytes express classical pericyte markers, we isolated RNA and generated cDNA to conduct a qPCR analysis. iPericytes expressed mRNAs that are integral to pericyte function, particularly: PDGFRB, which encodes the PDGFRβ protein; CSPG4 which encodes NG2 proteoglycan, and ACTA2 which encodes alpha-smooth muscle actin (αSMA). Compared to iPSCs, HBVPs, mesoderm and neural crest iPericytes expressed significantly higher levels of CSPG4 (HBVP, p = 0.0020; neural crest iPericytes, p < 0.0001; mesoderm iPericytes, p < 0.0001). Mesoderm and neural crest iPericytes, but not HBVPs also expressed more PDGFRB (HBVP, p = 0.1387; neural crest iPericytes, p < 0.0001, mesoderm iPericytes, p = 0.0002) and ACTA2 (HBVP, p = 0.1145; neural crest iPericytes, p = 0.0051; mesoderm iPericytes, p = 0.0447) mRNA than iPSCs (Fig. 1B). There were also differences between all three pericyte lines in expression of CSPG4 (HBVP vs. neural crest iPericytes, p < 0.0001; HBVP vs. mesoderm iPericytes, p < 0.0001; neural crest iPericytes vs. mesoderm iPericytes, p < 0.0001) and PDGFRB (HBVP vs. neural crest iPericytes, p < 0.0001; HBVP vs. mesoderm iPericytes, p = 0.0047; neural crest iPericytes vs. mesoderm iPericytes, p = 0.0002), but not ACTA2. Conversely, HBVPs, neural crest and mesoderm iPericytes expressed pluripotency genes at a very low level; expressing less OCT4 (HBVP, p < 0.0001; neural crest iPericyte, p < 0.0001; mesoderm iPericyte, p < 0.0001) and NANOG (HBVP, p < 0.0001; neural crest iPericyte, p < 0.0001; mesoderm iPericyte, p < 0.0001) mRNA than iPSCs (Fig. 1C).
Fig. 1
iPericytes are morphologically similar to HBVPs and express pericyte markers. A Phase contrast bright 4 × magnification images of iPSCs, HBVPs, mesoderm iPericytes and neural crest iPericytes. Scale = 200 µm. B-C Fold change gene expression measured by qPCR of pericyte genes PDGFRB, CSPG4, ACTA2 (B) and pluripotency genes OCT4 and NANOG (C) by iPSCs, neural crest iPericytes, mesoderm iPericytes and HBVPs (n = 3 per cell type). Data are normalised to HBVP cells, and comparisons were made using a one-way ANOVA: PDGFRB (F (3, 8) = 103.1, p < 0.0001), CSPG4 (F (3, 8) = 4671, p < 0.0001), ACTA2 (F (3, 8) = 9.340, p < 0.0054), OCT4 (F (3, 8) = 1686, p < 0.0001) and NANOG (F (3, 8) = 606.4, p < 0.0001). Post-hoc comparisons performed using Dunnett’s multiple comparisons test: *p < 0.05; **p < 0.01; ***p < 0.001; ****p < 0.0001. Data are shown as mean ± SD. D Immunocytochemistry showing expression of proteins PDGFRβ, CD13, and αSMA (green) by HBVP, mesoderm iPericytes and neural crest iPericytes. Nuclei counter-stained with DAPI (blue). Scale = 10 µm
To extend these mRNA expression findings, we performed immunocytochemistry to determine whether iPericytes expressed proteins synonymous with pericyte identity: PDGFRβ and CD13. Mesoderm and neural crest iPericytes displayed similar patterns of expression of PDGFRβ and CD13 compared to HBVPs (Fig. 1D). Quantification of the proportion of iPericytes expressing pericyte markers revealed that the vast majority of cells had positive labelling for PDGFRβ (HBVP 93%, mesoderm iPericyte 96%, and neural crest iPericyte 97%) and CD13 (HBVP 95%, mesoderm iPericyte 95%, and neural crest iPericyte 88%, suggesting these cultures were highly enriched for pericyte markers (Additional file 1: Fig. S4). Mesoderm and neural crest iPericytes also expressed the contractile protein αSMA similar to HBVPs (Fig. 1D). Overall, these data show that iPericytes are morphologically similar to HBVPs, express mRNAs and proteins that are consistent with pericyte identity, and expression is highly enriched across the whole culture.
Mesoderm and neural crest iPericytes have different gene expression profilesTo identify differences in gene expression between mesoderm and neural crest iPericytes, and to determine how similar these cells are to HBVPs, we performed bulk RNA sequencing. A PCA revealed that the majority of the variance was accounted for through the difference between HBVPs and iPericytes regardless of lineage (PC1: 78% variance), whereas PC2 (12% variance) accounted for the variation between neural crest and mesoderm iPericytes (Fig. 2A). Differential gene expression analysis was used to explore differences between HBVPs and iPericytes (Fig. 2B–D), or neural crest and mesoderm iPericytes (Fig. 2E–G). There were a substantial number of differentially expressed genes between HBVPs and iPericytes, with 984 genes upregulated and 880 genes downregulated in iPericytes compared to HBVP (Fig. 2B). This is also reflected in the heat map with clear differences in gene expression between HBVPs and iPericytes, regardless of lineage (Fig. 2C). Gene ontology analysis of differentially expressed genes between HBVPs and iPericytes showed enrichment for genes related to tissue development, cellular division, morphology, extracellular matrix production and protein binding (Fig. 2D).
Fig. 2
iPericytes derived through different lineage pathways have differential expression of genes. A PCA analysis showing separate clustering of mesoderm iPericytes, neural crest iPericytes and HBVPs (n = 6 for HBVPs, n = 3 for mesoderm or neural crest iPericytes). B Volcano plots showing upregulated and downregulated genes in iPericytes compared to HBVPs that met the log fold change threshold of 1. C Heat map showing differentially expressed genes in iPericytes compared to HBVPs. D Gene ontology analysis of key biological processes, cellular compartments and molecular function associated with 1,864 differentially expressed genes between iPericytes and HBVPs. E Volcano plots showing upregulated and downregulated genes in neural crest iPericytes compared to mesoderm iPericytes. F Heat map showing differentially expressed genes in neural crest iPericytes compared to mesoderm iPericytes. G Gene ontology analysis of key biological processes, cellular compartments and molecular function associated with 797 differentially expressed genes between neural crest iPericytes and mesoderm iPericytes
Next, we assessed for differential gene expression between mesoderm and neural crest iPericytes, which revealed 458 genes upregulated and 339 genes downregulated in neural crest iPericytes compared to mesoderm iPericytes (Fig. 2E). Visualisation of these differentially expressed genes via a heat map demonstrated the separation between mesoderm iPericytes and neural crest iPericytes (Fig. 2F). Gene ontology analysis showed enrichment for genes related to tissue development, extracellular matrix production, DNA/RNA processing and growth factor binding and activity (Fig. 2G). These differences could reflect changes in cellular function between mesoderm and neural crest iPericytes and HBVPs.
Validation of the mesoderm iPericyte differentiation protocol using multiple iPSC linesTo confirm that iPericyte differentiation is highly reproducible, multiple unrelated iPSC lines (MNZTASi019-A, MNZTASi021-A, and MNZTASi022-A) were cultured and used to generate mesoderm iPericytes. RNA was collected from the iPSCs and the iPericytes for bulk RNA sequencing. PCA of the gene expression profile of the iPSCs and mesoderm iPericytes revealed that each cell type (iPSCs and iPericytes) clustered separately along the first principal component, accounting for 93% of sample variation (Fig. 3A). Variation between replicates accounted for only 5% of sample variation, showing a remarkable similarity between replicates (Fig. 3A). We then selected genes associated with iPSC, pericyte, endothelial cell, microglia, oligodendrocyte progenitor cell (OPC), oligodendrocyte, astrocyte, or neuronal identity, and generated a heat map of gene expression for each iPSC line and the corresponding iPericytes (Fig. 3B). Regardless of donor, iPericytes had successfully downregulated the pluripotency genes NANOG, POU5F1 and SOX2, and upregulated pericyte-associated genes, including PDGFRB, CSPG4, ANPEP and ACTA2 (Fig. 3B). Gene expression was consistent across iPericytes generated from different iPSC lines (Fig. 3B). Importantly, iPericytes did not express genes synonymous with other neurovascular cell types (Fig. 3B). These data indicate this differentiation protocol can be applied to distinct iPSC lines and produce iPericytes with a consistent mRNA expression profile.
Fig. 3
Mesoderm iPericytes from multiple cell lines have similar mRNA expression. A Principal components analysis showing separate clustering of mesoderm iPericytes and iPSCs from n = 3 different cell lines. B Heat map showing relative expression levels in iPSCs and mesoderm iPericytes of key genes typically expressed by iPSCs, pericytes, endothelial cells (EC), microglia (MG), oligodendrocyte precursor cells (OPCs), oligodendrocytes (OL), astrocytes (AST) and neurons (NEU). Warmer colours indicate higher expression, cooler colours indicate lower expression
PDGFRβ signalling promotes iPericyte proliferationmRNA expression differences between HBVPs and iPericytes could influence their capacity to respond to environmental signals, and so we next compared the proliferative capacity of these cells. A key ligand-receptor pathway that pericytes utilise for survival and proliferation is the PDGFRβ signalling pathway [21]. We exposed HBVPs or iPericytes to basal pericyte medium alone (PM) or PM containing the PDGFRβ ligand, PDGF-BB (100 ng/ml), in the presence of the thymidine analogue, EdU, as previously described [21]. The addition of PDGF-BB increased the proportion of HBVPs and iPericytes that incorporated EdU over a 24 h period, indicative of increased proliferation (Fig. 4A, B, Additional file 1: Fig. S5; HBVP, p < 0.0001; neural crest iPericytes, p = 0.01; mesoderm iPericytes, p < 0.0001). The magnitude of response to PDGF-BB was similar between all three pericyte lines. Similar results were observed when complete pericyte media (CPM), containing specialised pericyte growth supplement (ScienCell, USA), was used compared to PM (Fig. 4B). These results indicate that iPericytes can proliferate in response to the pericyte growth factor PDGF-BB.
Fig. 4
Proliferation of iPericytes through the PDGF-BB: PDGFRβ signalling pathway. A iPericytes were incubated in basal pericyte media (PM) and treated with PDGF-BB (PM + PDGF-BB) while being exposed to 100 µM imatinib (PM + PDGF-BB + 100 µM imatinib). Proliferation was measured using an EdU uptake assay. iPericytes that are EdU-positive are indicated by magenta, while total number of iPericytes were measured by DAPI (blue). Scale bar = 50 µm. B Quantification of HBVPs, neural crest iPericytes and mesoderm iPericytes proliferating (as indicated by EdU-positive staining) as a percentage of total cells following 24 h exposure to PM, complete pericyte media with pericyte growth factors (CPM) or PM + PDGF-BB (n = 8 per condition). Data were analysed using a one-way ANOVA: HBVP (F (2, 21) = 35.52, p < 0.0001); neural crest iPericyte (F (2, 21) = 30.85, p < 0.0001); mesoderm iPericyte (F (2, 21) = 191.4, p < 0.0001). C Quantification of changes to PDGF-BB-induced proliferation with increasing concentrations of imatinib over 24 h in HBVPs, neural crest iPericytes and mesoderm iPericytes (n = 8 per condition). Data were analysed using a one-way ANOVA or Kruskal–Wallis test: HBVP (F (3, 26) = 259.2, p < 0.0001); neural crest iPericyte (H (3) = 24.41, p < 0.0001); mesoderm iPericyte (F (3, 28) = 221.5, p < 0.0001). For B, C, post-hoc comparisons were performed using Dunnett’s multiple comparisons or Dunn’s test: *p < 0.05; **p < 0.01; ***p < 0.001; ****p < 0.0001. Data shown as mean ± SD. D Heat map of key genes involved in pericyte proliferation in the PDGF-BB: PDGFRβ signalling pathway in HBVP, neural crest iPericytes and mesoderm iPericytes selected from Sweeney et al. [29]
To confirm that the proliferative response was mediated by PDGFRβ, HBVP and iPericyte proliferation was assessed in the presence of imatinib. In pericytes, imatinib inhibits PDGFRβ phosphorylation to prevent proliferation [21]. In HBVPs and iPericytes, imatinib produced a dose dependent inhibition of PDGF-BB-induced proliferation (Fig. 4C, Additional file 1: Fig. S5). For HBVPs, 0.01 µM imatinib did not alter proliferation (p = 0.9851), while 10 µM imatinib and 100 µM imatinib significantly reduced proliferation by 31% and 96% of PDGF-BB alone, respectively (p < 0.0001). Mesoderm iPericytes also failed to respond to 0.01 µM imatinib (51%, p = 0.6517), while 10 µM and 100 µM imatinib significantly reduced proliferation to 37% and 8% of PDGF-BB alone, respectively (p < 0.0001). Neural crest iPericytes were less sensitive to PDGFRβ blockade, as neither 0.01 µM (p = 0.9723) or 10 µM (p = 0.3121) altered PDGF-BB-induced proliferation. However, 100 µM imatinib significantly reduced the proliferation rate to 11% of that recorded for PDGF-BB alone (p = 0.0009). These findings indicate that neural crest iPericytes are less sensitive than mesoderm iPericytes or HBVPs to PDGFRβ inhibition.
To determine why neural crest iPericytes have altered susceptibility to PDGFRβ inhibition, we interrogated our RNA-sequencing dataset, and identified differences between HBVPs, mesoderm and neural crest iPericytes, in the relative expression of mRNAs downstream of the PDGF-BB:PDGFRβ pathway. In particular, PIK3CA (log2FoldChange = − 0.67, padj = 2.76E−5), NFKB1 (log2FoldChange = − 1.28, padj = 2.47E−26), NFKB2 (log2FoldChange = − 0.78, padj = 0.00096), CREB1 (log2FoldChange = − 0.46, padj = 2.39E−6) and PTPN11 (log2FoldChange = − 0.36, padj = 0.003) were differentially expressed between HBVPs and iPericytes, while PIK3CA (log2FoldChange = − 0.44, padj = 0.039) and NFKB2 (log2FoldChange = 0.68, padj = 2.24E−5) were differentially expressed between mesoderm and neural crest iPericytes (Fig. 4D). RNAseq analysis also revealed that the expression of PDGFRβ was significantly higher (log2FoldChange = − 1.06, padj = 6.26E−6) in neural crest iPericytes compared to mesoderm iPericytes (Fig. 4D), which is in line with the qPCR data (Fig. 1B). These differences could explain why neural crest iPericytes required a higher concentration of imatinib to prevent PDGF-BB mediated proliferation.
iPericytes contract in response to endothelin-1A primary function of pericytes is to contract and dilate to modulate capillary diameter, thereby altering cerebral blood flow [4]. We previously used a single cell imaging assay [24] and the xCelligence electrical impedance assay [23] to show that HBVPs can respond to vasoactive mediators. To assess the responses of mesoderm and neural crest iPericytes to endothelin-1, we again used the xCelligence system. Cells were plated on specialised cell culture plates that allow resistance to electron flow to be measured to provide an assessment of cell index (Additional file 1: Fig. S6A). Normalised cell index values can be analysed to compare differences in slope, AUC and change in cell area after treatment with contractile mediators (Additional file 1: Fig. S6B). It is important to note that a small reduction in normalised cell index is ordinarily observed over the first few minutes of an experiment, even under control conditions (Fig. 5A, B, [23]). When mesoderm iPericytes (Fig. 5A) and neural crest iPericytes (Fig. 5B) were treated with endothelin-1, normalised cell index decreased compared to vehicle suggesting pericytes had contracted, which was confirmed when AUC was calculated (treatment: p = 0.0033, Fig. 5C; treatment: p < 0.0001, Fig. 5F). Compared to HBVPs, contraction of mesoderm iPericytes (p = 0.9995, Fig. 5C) and neural crest iPericytes (p = 0.1464, Fig. 5F) was similar in the first 20 min of endothelin-1 exposure. The maximum contraction achieved by mesoderm iPericytes was the same as HBVPs in response to endothelin-1 (treatment: p = 0.0021, Fig. 5D), and this was maintained over 2 h (treatment: p = 0.0026, Fig. 5E). However, there was a different effect of treatment with endothelin-1 on neural crest iPericytes in comparison to HBVPs (interaction of cell type x treatment: p = 0.0010, Fig. 5G). Post-hoc analysis revealed that neural crest iPericytes maximum contraction was greater in response to endothelin-1 compared to HBVPs (p = 0.0007, Fig. 5G) and they also sustained a greater level of contraction compared to HBVPs for up to 2 h (p = 0.0001, Fig. 5H). These findings suggest that iPericytes derived through different lineages display distinct responses to endothelin-1.
Fig. 5
Endothelin-1 induces iPericyte contraction. A, B Normalised cell index of neural crest iPericytes, mesoderm iPericytes and HBVPs treated with endothelin-1 or vehicle (CPM) over a period of 2 h (n = 4 per condition). C–E Quantified AUC (C; indicator of volume of contraction), ∆ cell index (D; maximum contraction) and ∆ cell index after 2 h (E; contraction at 2 h time point) for mesoderm iPericytes and HBVPs treated with control or endothelin-1 analysed using two-way ANOVA: AUC (cell type: F (1, 12) = 0.6953, p = 0.4206; treatment: (F (1, 12) = 13.35, p = 0.0033; interaction: F (1, 12) = 0.1006, p = 0.7565); ∆ cell index (cell type: F (1, 12) = 0.02309, p = 0.8817; treatment: F (1, 12) = 15.21, p = 0.0021; interaction: F (1, 12) = 0.5773, p = 0.4620); ∆ cell index after 2 h (cell type: F (1, 12) = 1.590, p = 0.2313; treatment: F (1, 12) = 14.31, p = 0.0026; interaction: F (1, 12) = 0.5518, p = 0.4719). F–H Quantified AUC (F), ∆ cell index (G) and ∆ cell index after 2 h (H) for neural crest iPericytes and HBVPs treated with control or endothelin-1 analysed using two-way ANOVA: AUC (cell type: F (1, 12) = 1.563, p = 0.2351; treatment: (F (1, 12) = 54.67, p < 0.0001; interaction: F (1, 12) = 5.470, p = 0.0375); ∆ cell index (cell type: F (1, 12) = 13.53, p = 0.0032; treatment: F (1, 12) = 66.11, p < 0.0001; interaction: F (1, 12) = 18.47, p = 0.0010); ∆ cell index after 2 h (cell type: F (1, 12) = 34.64, p < 0.0001; treatment: F (1, 12) = 38.56, p < 0.0001; interaction F (1, 12) = 14.70, p = 0.0024). C–H Post-hoc comparisons performed using Sidak’s multiple comparisons test. *p < 0.05; **p < 0.01; ***p < 0.001; ****p < 0.0001. Data shown as mean ± SD. I–J Normalised gene expression counts of differentially expressed endothelin-1 receptors in HBVP, neural crest iPericytes and mesoderm iPericytes compared using DEseq: HBVPs and neural crest iPericytes EDNRA, I log2FoldChange = 2.53, padj = 6.12E−23; EDNRB, J log2FoldChange = 5.14, padj = 9.13E−26; neural crest iPericytes compared to mesoderm iPericytes EDNRA, I log2FoldChange = − 2.52, padj = 3.12387E−25; EDNRB, J log2FoldChange = − 7.22, padj = 6.77016E−15
To determine whether the lineage specific responses of iPericytes were due to differences in endothelin-1 receptor expression, we determined whether endothelin-1 receptor genes were differentially expressed between HBVPs, neural crest iPericytes and mesoderm iPericytes. EDNRA and EDNRB, genes which code for the two major endothelin-1 receptors, were differentially expressed in our RNA-seq dataset. There was a significantly different expression of both subtypes of endothelin-1 receptor between HBVPs and neural crest iPericytes (EDNRA: Fig. 5I, log2FoldChange = 2.53, padj = 6.12E−23; EDNRB: Fig. 5J log2FoldChange = 5.14, padj = 9.13E−26), while there was no difference between HBVP and mesoderm iPericytes (Fig. 5I, J). There was also significantly higher expression of both subtypes of endothelin-1 receptor in neural crest iPericytes compared to mesoderm iPericytes (EDNRA: Fig. 5I, log2FoldChange = − 2.52, padj = 3.12E−25; EDNRB: Fig. 5J, log2FoldChange = − 7.22, padj = 6.77E−15), which might be driving their greater response to the endothelin-1 ligand. These data indicate that iPericytes can respond to endothelin-1, and that neural crest iPericytes display a greater contractile response to endothelin-1 compared to mesoderm iPericytes and HBVPs.
iPericytes have functional responses to the vasodilator adenosineGiven we observed differences in the response of neural crest iPericytes and mesoderm iPericytes to endothelin-1, we also tested the response of iPericytes to adenosine which can initiate pericyte relaxation in vitro [23]. Similar to HBVPs, when mesoderm iPericytes (Fig. 6A) and neural crest iPericytes (Fig. 6B) were exposed to adenosine, normalised cell index increased compared to vehicle conditions, indicative of pericyte relaxation. When treated with adenosine, mesoderm iPericytes relaxed (treatment: p = 0.0002, Fig. 6C) and the maximum relaxation achieved by mesoderm pericytes was the same as HBVPs in response to adenosine (treatment: p = 0.0002, Fig. 6D), however, this was not maintained over 2 h (treatment: p = 0.7317, Fig. 6E). There was a different response following adenosine treatment on neural crest iPericyte relaxation in comparison to HBVPs (interaction of cell type x treatment: p = 0.0202, Fig. 6F). Post-hoc analysis revealed that neural crest iPericytes relax less in response to adenosine compared to HBVPs (p = 0.0112, Fig. 6F), which was also observed in assessment of maximum relaxation (p = 0.0336, Fig. 6G) and relaxation at 2 h (p = 0.0170, Fig. 6H). These findings indicate that neural crest iPericytes display reduced ability to relax in response to adenosine compared to mesoderm iPericytes.
Fig. 6
Adenosine induces iPericyte relaxation. A, B Normalised cell index of neural crest iPericytes, mesoderm iPericytes and HBVPs treated with adenosine or vehicle (CPM) over a period of 2 h (n = 4 per condition). C–E Quantified AUC (C), ∆ cell index (D) and ∆ cell index after 2 h (E) for mesoderm iPericytes and HBVPs treated with control or adenosine analysed using two-way ANOVA: AUC (cell type: F (1, 12) = 6.583, p = 0.0247; treatment: (F (1, 12) = 26.84, p = 0.0002; interaction: F (1, 12) = 6.027, p = 0.0303); ∆ cell index (cell type: F (1, 12) = 6.387, p = 0.0265; treatment: F (1, 12) = 28.26, p = 0.0002; interaction: F (1, 12) = 1.284, p = 0.2794); ∆ cell index after 2 h (cell type: F (1, 12) = 1.460, p = 0.2502; treatment: F (1, 12) = 0.1232, p = 0.7317; interaction: F (1, 12) = 1.174, p = 0.2999). F–H Quantified AUC (F), ∆ cell index (G) and ∆ cell index after 2 h (H) for neural crest iPericytes and HBVPs treated with control or adenosine analysed using two-way ANOVA: AUC (cell type: F (1, 12) = 8.596, p = 0.0126; treatment: (F (1, 12) = 50.38, p < 0.0001; interaction: F (1, 12) = 7.159, p = 0.0202); ∆ cell index (cell type: F (1, 12) = 7.881, p = 0.0158; treatment: F (1, 12) = 57.12, p < 0.0001; interaction: F (1, 12) = 3.777, p = 0.0758); ∆ cell index after 2 h (cell type: F (1, 12) = 16.46, p = 0.0016; treatment: F (1, 12) = 20.58, p = 0.0007; interaction: F (1, 12) = 1.500, p = 0.2442). C–H Post-hoc comparisons performed using Sidak’s multiple comparisons test. *p < 0.05; **p < 0.01; ***p < 0.001; ****p < 0.0001. Data shown as mean ± SD. I, J Normalised gene expression counts of differentially expressed adenosine receptors in HBVP, neural crest iPericytes and mesoderm iPericytes compared using DEseq: HBVPs and neural crest iPericytes ADORA1, I log2FoldChange = 3.92, padj = 1.65E−11; ADORA2B, J log2FoldChange = − 1.71, padj = 2.93E−19; HBVPs and mesoderm iPericytes ADORA1, I log2FoldChange = 2.72, padj = 0.00006; ADORA2B, J log2FoldChange = − 2.33, padj = 1.52E−25; neural crest iPericytes compared to mesoderm iPericytes ADORA1, I log2FoldChange = − 1.19, padj = 0.001; ADORA2B, J log2FoldChange = − 0.61, padj = 0.03288
To determine whether the lineage specific responses of iPericytes were due to differences in adenosine receptor expression, we determined whether adenosine receptor genes were differentially expressed between HBVPs, neural crest iPericytes and mesoderm iPericytes. ADORA1 and ADORA2B, genes which code for two of the major adenosine receptors, were differentially expressed in our RNA-seq dataset. There was a significantly different expression of adenosine receptors type ADORA1 and ADORA2B between HBVPs and neural crest iPericytes (ADORA1: Fig. 6I, log2FoldChange = 3.92, padj = 1.65E−11; ADORA2B: Fig. 6J, log2FoldChange = − 1.71, padj = 2.93E−19). There was also significantly higher expression of both of these subtypes in neural crest iPericytes compared to mesoderm iPericytes (ADORA1: Fig. 6I, log2FoldChange = − 1.19, padj = 0.001; ADORA2B: Fig. 6J, log2FoldChange = − 0.61, padj = 0.033). Therefore, while differences in the expression of adenosine receptors exist between HBVPs, mesoderm and neural crest iPericytes, they do not reflect differences in functional responses to adenosine. These findings suggest that iPericytes can respond to adenosine, and that neural crest iPericytes display a reduced relaxation response compared to HBVPs.
Comments (0)