Cell cultures, treatments, and readouts
Human umbilical vein endothelial cells (HUVEC) from pooled donors (Clonetics, Lonza) were cultivated in endothelial basal medium (EBM-2, CC-3156, Lonza) supplemented with SingleQuot Bullet Kit (CC-4176, Lonza). The development of cellular senescence was verified through senescence-associated (SA)-Beta-Gal staining (#9860, Cell Signaling). Human monocytes THP-1 cells (ATCC) were cultured in RPMI-1640 medium supplemented with 10% heat-inactivated fetal bovine serum (FBS), 1% penicillin/streptomycin, and 1% l-glutamine (all from Euroclone).
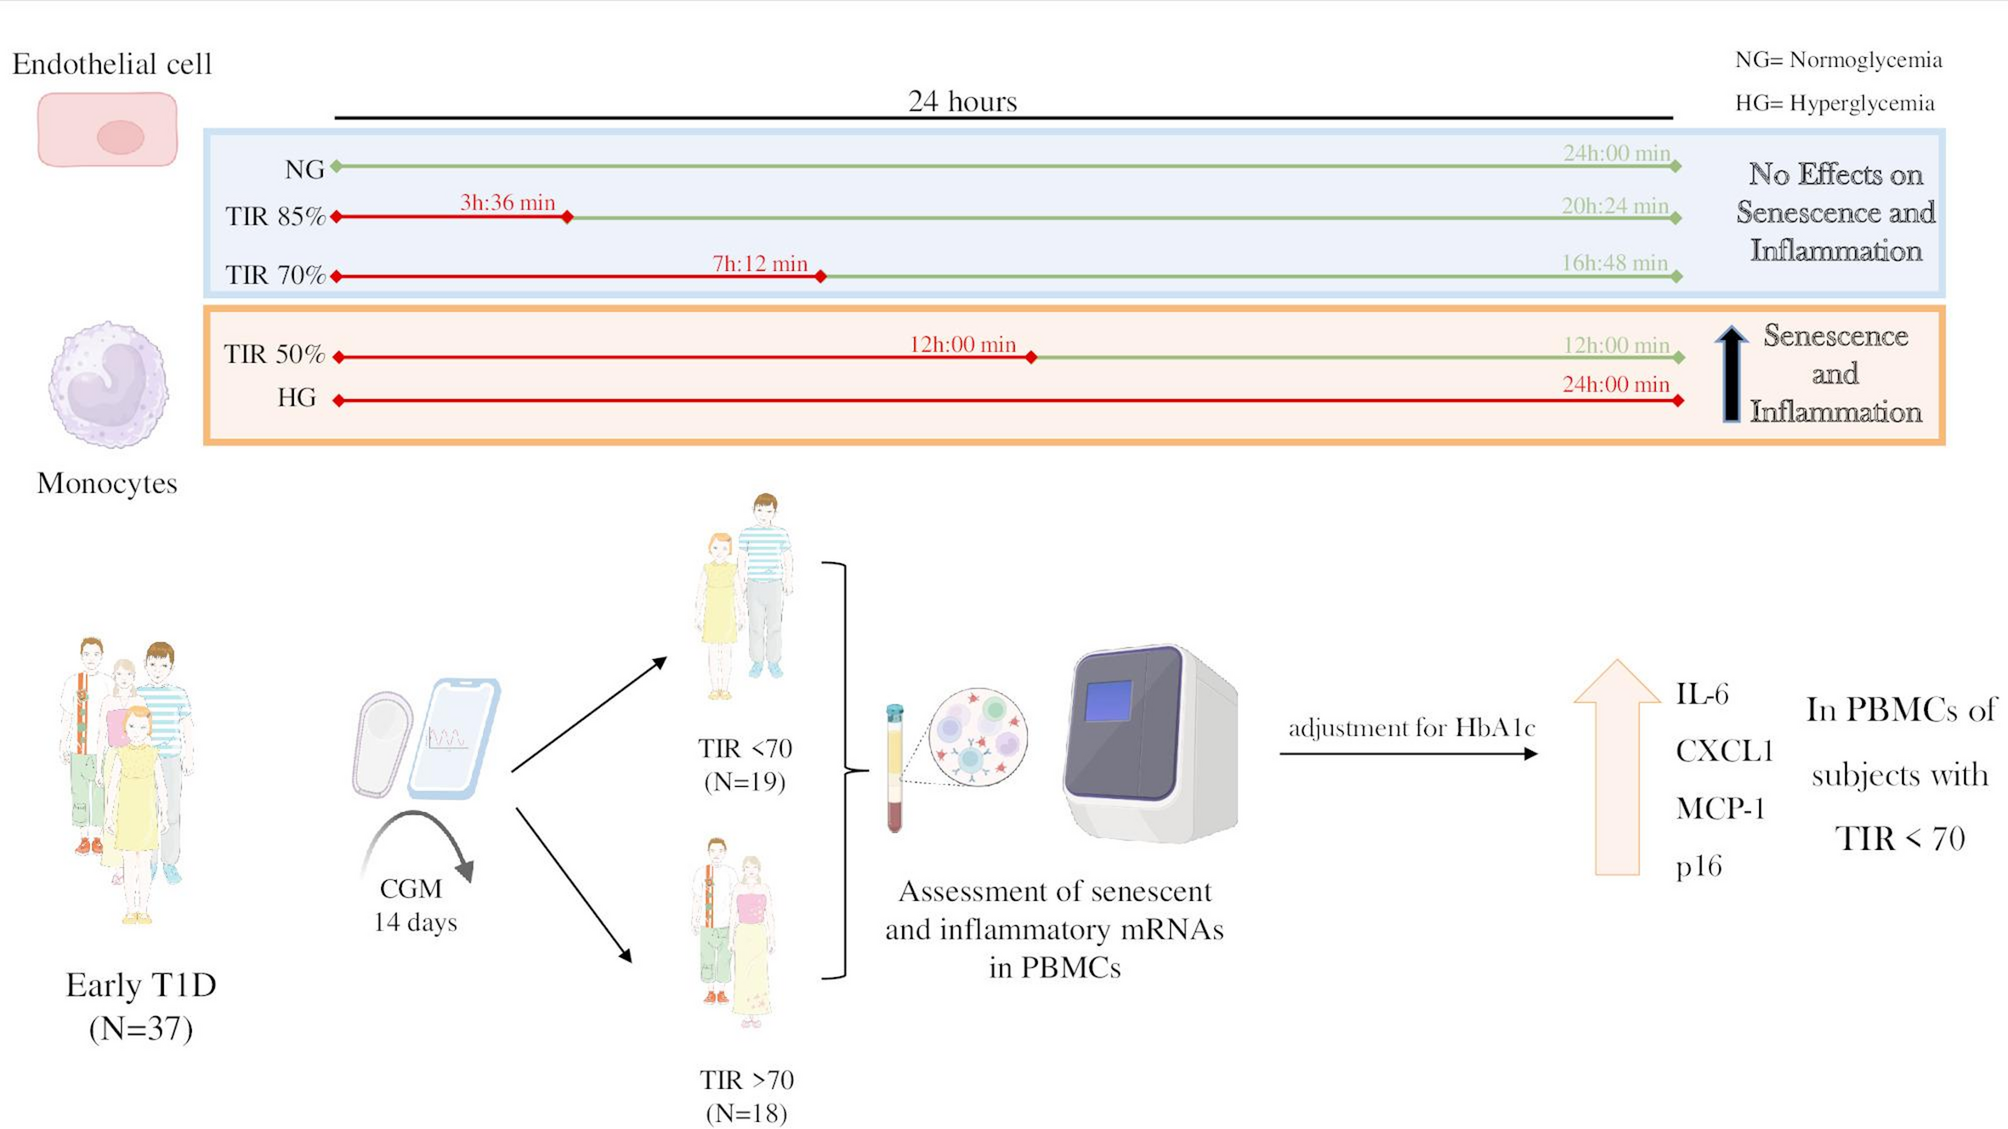
Young endothelial cells (i.e., SA-Beta Gal < 10%) were seeded at a density of 5000/cm2 and exposed to increasing percentages of TIR (50%, 70%, and 85%), as well as to constant normoglycaemia (a fixed level of 100 mg/dl glucose) or constant hyperglycemia (fixed 500 mg/dl glucose), for ten days with daily media change. To obtain the desired degrees of TIR, media was changed twice a day at appropriate timing (as depicted in the study design of Fig. 1A). For instance, to obtain a TIR of 50%, cells spent 12 h a day at 100 mg/dl of glucose and the other 12 h at 500 mg/dl. Glycemia was not fluctuating neither during normoglycemia nor during hyperglycemia. The same degrees of normoglycemia and of hyperglycemia (500 mg/dl glucose), commonly used in molecular experiments [8], were applied to all the TIR conditions, in order to isolate the effect of TIR from those related to the magnitude of glycemic excursions. The same design was applied to monocytes for 5 days, adjusting the relative amount of glucose to 200 mg/dl for normoglycemia and to 600 mg/dl for hyperglycemia, a common approach with this cell type [8, 9].
Molecular readouts were markers of senescence and of the associated inflammatory response assessed through kit, i.e. for SA-Beta-Gal, or through either RT-PCR or Western Blot for the other variables, as described in the subsequent sections. According to existing literature [5,6,7], we used SA-Beta-Gal, p16, p21, and PAI-1 as markers of senescence while IL-1α, IL-1β, IL-6, IL-8, TNFα, CXCL1, MCP-1, and NLRP3 were selected as relevant inflammatory markers.
RNA extraction and RT qPCR
Total RNA was extracted using the RNA Purification Kit (37,500, Norgen Biotek) and assessed for concentration and purity with a NanoDrop spectrophotometer (Thermo Fisher). Samples with a 260/280 ratio of approximately 2.0 were selected for further analysis. One microgram of RNA was reverse-transcribed using the Superscript III Reverse Transcriptase Kit (Invitrogen) following the manufacturer’s protocol. Quantitative real-time PCR (qRT-PCR) was conducted on a QuantStudio 6 Flex detection system (Applied Biosystems) with TB Green® Premix Ex Taq™ reagents (RR420A, Takara Bio). The thermal cycling conditions followed previously published protocols [8] and the primers used are listed in Supplementary Table 1. GAPDH was used as the reference gene for normalization for in vitro experiments while β-Actin was used to normalize human PBMCs data [10].
Western blot
Cells were lysed in RIPA buffer (R0278, Merck) with 1% protease inhibitor (11,873,580,001 cOmplete™, EDTA-free Protease Inhibitor Cocktail, Merck), 1% phosphatase inhibitor II and III (p5726, p0044, Merck). Protein concentration was determined using the Bradford assay (23,200, Thermo Fisher). For Western blots, 50 µg of lysate was separated by electrophoresis using PAGE gels (NP0335BOX, NuPAGE™ Bis–Tris Mini Protein Gels, 4–12%, Thermo Fisher) and transferred to nitrocellulose membranes (GE10600020, 0.45 μm, Merck). After blocking with 5% non-fat dried milk (70,166-500G, Merck) or 5% bovine serum albumin (A1470-100G, Merck), membranes were incubated overnight at 4 °C with the following primary antibodies: anti-IL-1β (ab254360, Abcam), anti-IL-6 (#12,153; Cell Signalling), anti-IL-8 (ab110727; Abcam), anti-CXCL1 (#24,376; Cell Signalling), anti-TNFα (#6945; Cell Signalling), anti-PAI-1 (#11,907; Cell Signalling), and anti-Vinculin (#13,901; Cell Signalling) all diluted 1:1000, Secondary IgG HP-conjugated anti-rabbit HRP-linked antibody (#7074; Cell Signalling, 1:3000) were applied for 1 h at room temperature. Immunoreactive proteins were revealed with WESTAR ETA ULTRA C 2.0 (XLS075,0100, Cyanagen) using UVITEC Alliance Q9. Vinculin was used as the loading control. Densitometric analysis was performed with UVITEC Nine Alliance.
Monocytes adhesion to endothelial cells
HUVEC were plated as a monolayer and exposed to increasing percentages of TIR, NG and HG for 10 days as described above. At the end of the treatment, we tested monocytes adhesion using The Vybrant™ Cell Adhesion Assay Kit (V-13181, Invitrogen). Five × 106 THP-1 monocytes were labeled with 7.5 µM of calcein-acetoxymethyl ester (AM) at 37 °C for 30 min. After washing cells two times with RPMI, the labelled suspension (5 × 10⁵ cells) was added to HUVEC previously exposed to increasing percentages of TIR, NG and HG for 10 days. After an incubation for 3 h at 37 °C, nonadherent, calcein-labeled cells were removed by careful washing with RPMI. The fluorescence of adherent calcein AM labeled THP-1 cells was measured using the spectrophotometer Synergy HT (Biotek), setting an excitation of 485 nm. Absorbance of control cells (NG) was set at 1 and the others calculated as relative fold changes.
Sample size calculation for the cohort study
Given the lack of previous studies using such an approach, we estimated a sample size based on the observations obtained from our preliminary in vitro experiments. Using p16 as the reference, i.e. the most commonly used marker of senescence [5,6,7], we observed a mean difference between treatments above vs below 70% of TIR of 0.5 arbitrary units (i.e. the effect size) with a standard deviations of 0.5 units. Considering a Beta of 0.2, an alpha of 0.05, and an expected equal proportion of subjects in the two groups, with the intention of comparing the two means through T statistic it results that two groups of 17 people each (total n = 34) are needed to observe a difference in the expression of this marker. We estimated that such sample size would suffice also for the comparison of the other markers, which showed similar data in preliminary experiments.
Study cohort, PBMCs collection, and endpoints
Participants were selected from a National Childhood Registry for type 1 diabetes and were regularly managed at the Department of Endocrinology, Diabetes, and Metabolic Diseases at the UMC Ljubljana University Children Hospital, Slovenia. The participants enrolled provided their written informed consent and the protocol was approved by the Slovenian Ethical Committee (nr. 0120–6/2023/3).
Between March 2023 and March 2025, participants were recruited during a routine follow-up visit approximately one year after type 1 diabetes diagnosis according to selected study inclusion criteria: the use of CGM devices, had available clinical data and complete CGM data relative to the previous 14 days, and were on therapy only with insulin (any treatment modality, including automatic insulin delivery systems). Main exclusion criteria were a diagnosis of diabetes other than T1D, use of glucose-lowering drugs beyond insulin, incomplete CGM data, lack of clinical information, and inability to provide appropriate volumes of blood samples to isolate PBMCs. People with recently developed disease were selected for participation in order to minimize the burden of comorbidities thus maximizing the chances of isolating the effect of glycemia on inflammatory and senescence variables [5,6,7], as well as to increase the likelihood of creating two balanced groups discordant only for glucose control.
Clinical examinations were conducted and electronic health records were evaluated to collect demographic, clinical, and therapeutic data. Subjects were all Caucasian and pubertal status was defined as previously suggested [11]. During a regular clinical visit, CGM data collected and blood samples were obtained according to standard procedures after overnight fasting for analysis of biochemical variables and to isolate PBMCs, which were isolated starting from fresh heparin blood tubes through Ficoll-Paque using a standard protocol [12]. Considering CGM data relative to the 14 days preceding blood withdrawal, people were assigned to one of two groups: individuals with TIR < 70% or subjects with TIR > 70%. The primary endpoint of the study was the expression of p16 and other common markers of senescence and inflammation, i.e. p21, IL-1α, IL-1β, IL-6, IL-8, CXCL1, MCP-1, and NLRP3 [5,6,7], in PBMCs among people with TIR < 70% and those with TIR > 70%, assessed at the mRNA level. The correlations between TIR values, considered as continuous variables, and the same markers were exploratory endpoints. As an additional exploratory analysis, we also compared the expression of the same markers in the same population categorized according to the Time Above Range (TAR), considered as time above 180 mg/dl without the further stratification commonly used in clinical practice differentiating the 180–250 mg/dl from the > 250 mg/dl range [1,2,3]. Such an approach was chosen to avoid creating too much groups, given the limited sample size. Considering this categorization, we opted to set the threshold for categorization as a TAR < or ≥ 30%, which is the sum of the targets suggested by guidelines which recommend a TAR < 25% for the 180–250 mg/dl glycemia range and < 5% for the > 250 mg/dl glucose range [1,2,3].
Statistical analysis
For in vitro experiments, at least three different batches were used for endothelial cells while the same number of technical replicates were done for monocytes. Levels of different mRNAs or proteins among different treatments were compared using ANOVA followed by Tukey test.
For the cohort study, the distribution of variables was assessed with the use of the Shapiro–Wilk test. Clinical characteristics were compared between the two groups with a t-test for normally distributed data, the Mann–Whitney U test for non-normally distributed data, and Fisher’s exact test for categorical variables. Since, as expected, HbA1c was different among the groups of people with TIR < 70% vs those with TIR > 70%, and considering that this variable is held to affect senescence and inflammation [5,6,7], the comparison of the expression of p16, p21, IL-1α, IL-1β, IL-6, IL-8, CXCL1, MCP-1, and NLRP3 in the two groups, i.e. the primary endpoint, was performed using ANCOVA adjusted for HbA1c. The same approach was used to compare the expression of the same markers in the groups of people with TAR ≥ or < 30%. Linear regression analyses were performed to estimate the association of TIR values, considered as a continuous variable, and the same markers. A two-sided P value of less than 0.05 was considered significant. Figures were prepared with the use of GraphPad Prism, version 9.1.2, which was used also for statistical analysis with the exception of the ANCOVA test, which was performed with StatsCalculators [13].


Comments (0)