
Remember me


This study used nationwide datasets from the Korean National Health Insurance System (KNHIS), which covers more than 99% of Korean citizens. It provides health information, including annual or biennial health checkups with anthropometric and laboratory measurements; claims data using the 10th edition of the International Classification of Disease (ICD-10) codes and lifestyle questionnaires, including smoking history, alcohol consumption habits, and physical activity. We also used nationwide death certificates from the Korean National Statistical Office, which provide information on the causes of death using ICD-10 codes [17].
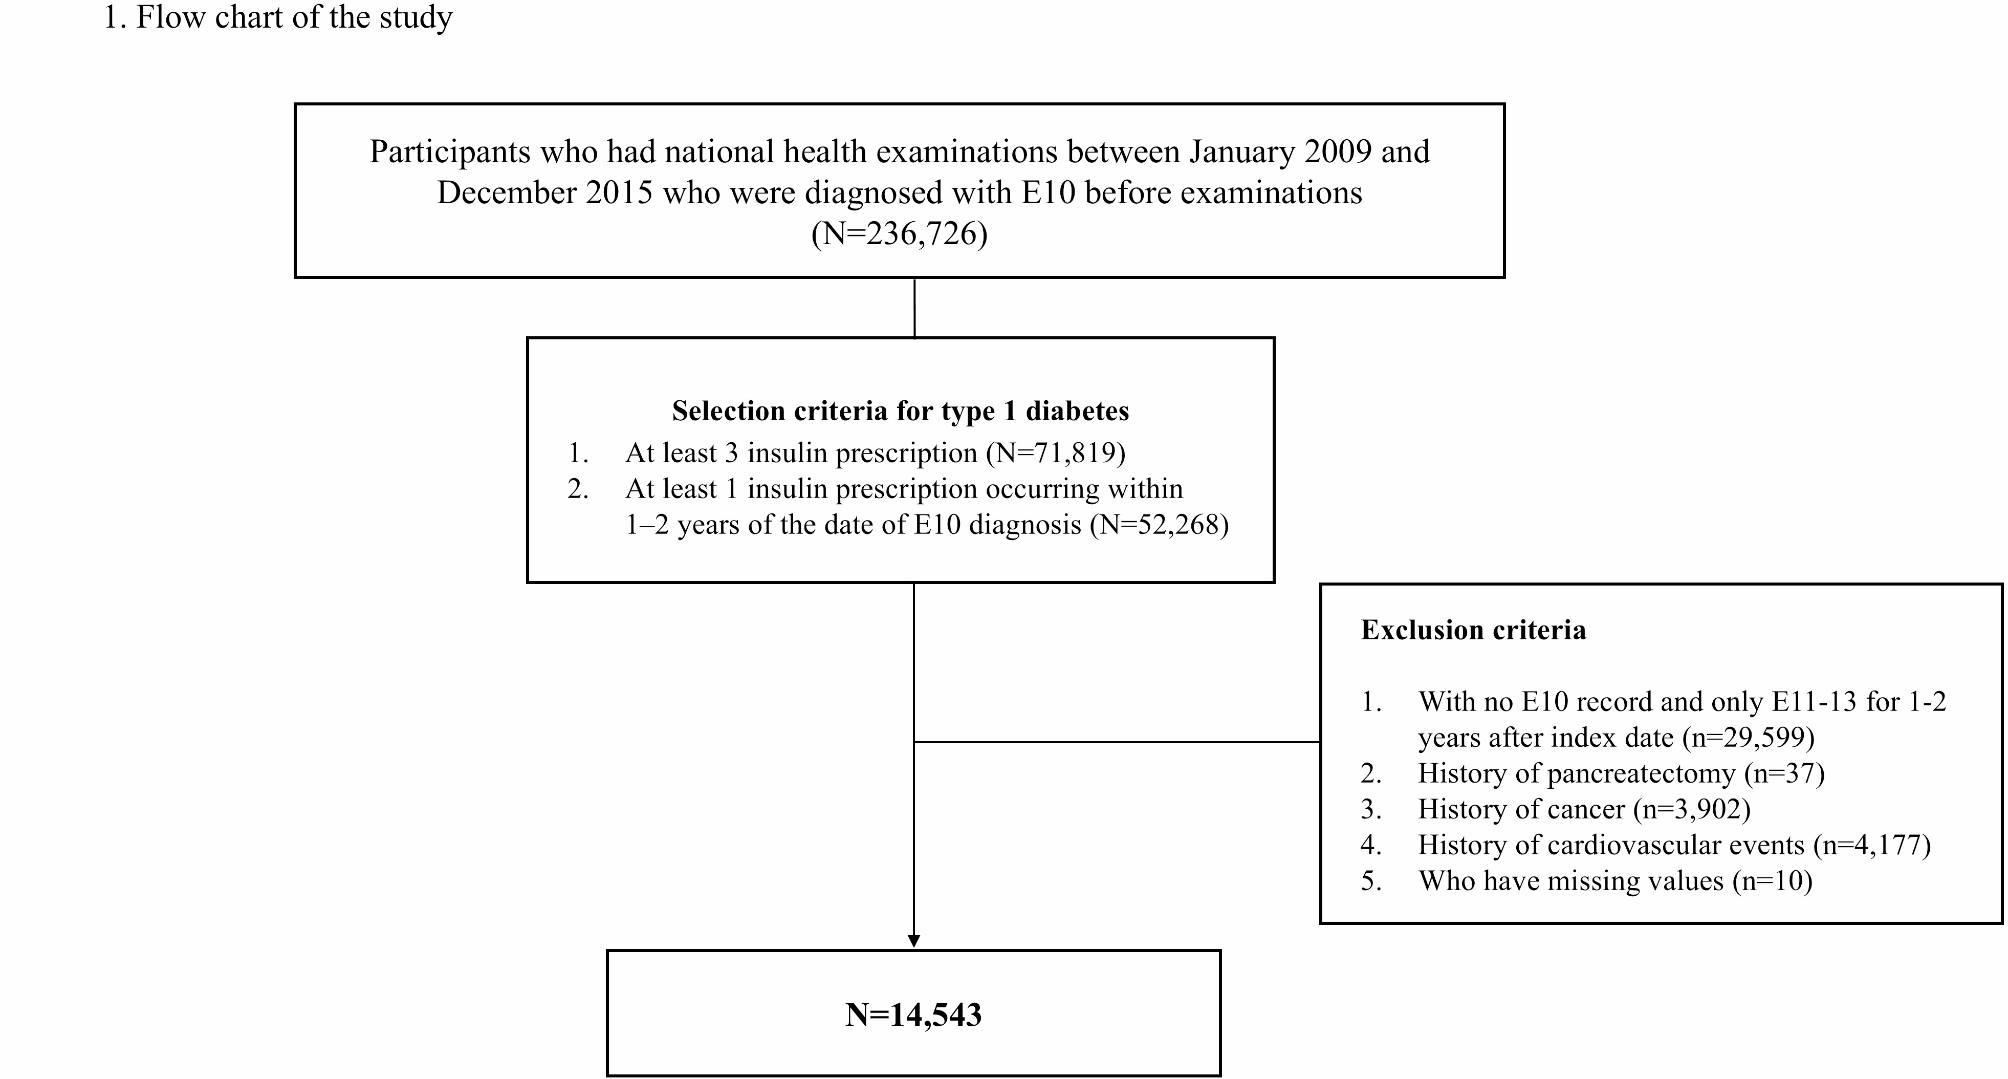
Study populationType 1 diabetes cohortWe used data from the KNHIS dataset and enrolled patients with T1DM using strict criteria derived from a previous nationwide cohort study in Korea [18]. Patients who underwent a health examination between 2009 and 2015 and were diagnosed with E10 (T1DM) before the examination were included in the study (N = 236,726). The date of health examination was defined as the index date. Additionally, individuals were required to have documented insulin prescriptions following their initial E10 diagnosis. Specifically, at least three insulin prescriptions were required (N = 71,819), with at least one insulin prescription occurring within 1–2 years after the initial diagnosis. (N = 52,268) [19].
Among individuals with T1DM, we excluded individuals with no E10 records and only E11–14 (E11: T2DM; E12: malnutrition-related diabetes mellitus; E13: other specified diabetes mellitus; E14: unspecified diabetes mellitus) for 1–2 years after the index date, because they tended to have ketosis-prone type 2 diabetes (n = 29,599) [20]. Individuals with a history of partial or total pancreatectomy before the index date (n = 37), cancer (n = 3,902), or cardiovascular events (n = 4,177) were excluded. Additionally, individuals who had missing values were excluded. (n = 10) Finally, 14,543 individuals with T1DM were enrolled in this study (Fig. 1). The study population was followed up until December 2020. The Institutional Review Board of the Samsung Medical Center approved the study and waived the requirement for informed consent because the data were de-identified. (IRB-2024-10-063)
Fig. 1
Flow chart of the study. (E10: Type 1 diabetes, E11: Type 2 diabetes, E12: malnutrition-related diabetes mellitus; E13: other specified diabetes mellitus; E14: unspecified diabetes mellitus)
Stratification by TyG index quartilesThe TyG index was estimated as ln [triglyceride (mg/dL) × fasting blood glucose (mg/dL)/2].
Study participants were stratified into quartiles based on their TyG index values. The cutoff points for quartile assignment were 8.46, 9.03, and 9.60, respectively. Specifically, the lowest quartile had TyG index < 8.46 (Q1, n = 3595), the second quartile had 8.46 ≤ TyG index < 9.03 (Q2, n = 3,641), the third quartile had 9.03 ≤ TyG index < 9.60 (Q3, n = 3629) and the highest quartile had TyG index ≥ 9.60 (Q4, n = 3678).
OutcomesThe primary outcomes were new-onset cardiovascular events including myocardial infarction (MI; I21-I22), ischemic stroke (I63-64) and heart failure (HF; I50). Cardiovascular events were defined as first confirmed event of hospitalization with a specific ICD-10 code. When defining cardiovascular outcomes, we referenced a previous study that validated the use of ICD codes and hospitalization data from the KNHIS database to define these outcomes [21, 22]. A composite CVD event was a combination of the above outcomes.
The secondary outcome was the all-cause mortality from the index date to December 2020.
VariablesThis study included detailed baseline data encompassing the following domains: demographic characteristics (age, sex, income level), lifestyle factors (smoking status, alcohol consumption, physical activity patterns), medical history (prescriptions, diagnoses, duration of T1DM, hospitalization records), anthropometry (height, weight, waist circumference), blood pressure (systolic and diastolic), laboratory assessments (fasting glucose, total cholesterol, high-density lipoprotein (HDL) cholesterol, low-density lipoprotein (LDL) cholesterol, estimated glomerular filtration rate (eGFR), triglycerides (TG), alanine aminotransferase (ALT), aspartate aminotransferase (AST) and gamma-glutamyl transpeptidase (r-GTP) [17].
Low income was defined as belonging to the bottom 20% of income earners in the NHIS population or receiving government-funded medical aid. Daily alcohol consumption (g/day) was estimated based on the self-reported drinking frequency and typical drink size using a standardized questionnaire. Individuals were classified as physically active if they performed vigorous activity for at least three days per week or moderate-intensity activity for at least five days per week. Chronic kidney disease (CKD) was defined as an eGFR < 60 mL/min/1.73 m [2]. Dyslipidemia was defined as at least one claim per year using code E78 or for the prescription of a lipid-lowering medication, including statins, ezetimibe, fibrates, nicotinic acid, omega-3, and evolocumab. Body mass index (BMI) was calculated as body weight (kg) divided by height2 (m2). And according to Asian criteria, a BMI of 23 or higher was defined as obesity. Diabetic ketoacidosis (DKA) was defined as at least one hospitalization with specific ICD codes: E10.1, E11.1, E12.1, E13.1, E14.1, and E87.2 [23].
Statistical analysisContinuous variables were expressed as means ± standard deviation (SD), and categorical variables were presented as frequencies (%). Significance of trend across the TyG quartiles was analyzed using linear regression models for continuous variables and Cochran-Armitage test or Jonckheere-Terpstra test for categorical variables. Kaplan-Meier curves were generated to compare the incidence of CVD stratified by TyG index quartiles and the differences between groups were assessed using the log-rank test. Cox proportional hazards models were used to estimate the hazard ratios (HR) and their 95% confidence intervals (CIs) for the incidence of CVD and all-cause mortality. In the multivariable-adjusted analyses, model 2 was adjusted for age and sex, while model 3 was additionally adjusted for BMI, systolic blood pressure (SBP), diastolic blood pressure (DBP), smoking history, alcohol consumption, physical activity, comorbidities such as CKD and dyslipidemia, prescription of antiplatelet agents including aspirin, clopidogrel, prasugrel, and ticagrelor, duration of T1DM, LDL cholesterol, and prescription of hypertension medication. Additionally, subgroup analyses were conducted to assess the potential interactions between other variables and TyG index on the incidence of CVD and all-cause mortality. To address the issue of small sample sizes in certain subgroups such as those with age < 50, income < 20% and who had history of DKA, we employed bootstrap methods for analysis. Restricted cubic spline (RCS) regression was employed to compare the non-linear associations of the TyG index, log-transformed triglycerides, and fasting blood glucose with the risk of CVD and all-cause mortality. The analysis was adjusted for potential confounders included in model 3, ensuring robust estimates of the associations. Statistical significance was set at P < 0.05. significance. All analyses were run in R version 4.0.3 software and SAS Enterprise Guide 7.1 for Windows (SAS Institute, Cary, NC, USA).
Sensitivity analysis for usual glycemic statusAs the KNHIS dataset did not include HbA1c values, we conducted a sensitivity analysis to account for individuals’ usual glycemic status. In this analysis, we included only individuals with at least one additional health check-up prior to index date. For these individuals, we calculated two key metrics: mean fasting glucose and the variability independent of the mean (VIM) of fasting glucose. VIM was calculated as SD /\(\:}^\), where was determined by fitting a non-linear regression model. And then, we conducted Cox regression analysis by adding the mean fasting glucose and VIM of fasting glucose to the adjustable variables, measured in two or more health check-ups.
Sensitivity analysis for association between persistent elevated TyG quartiles and cardiovascular events and all-cause mortalityAmong 11,632 individuals who underwent at least one additional health check-up after the index date until December 2020, 4431 individuals’ TyG quartiles remained unchanged between their first and last examinations. And we compare cardiovascular events and all-cause mortality in those individuals to reveal association between persistent elevated TyG index and cardiovascular events and all-cause mortality.
Comments (0)