Data collection and processing
The legacy DNA methylation raw IDAT files of ESCA cohort, assayed by the Illumina Infinium HumanMethylation 450 K BeadChip, were downloaded from TCGA Genomic Data Commons (GDC) portal (https://portal.gdc.cancer.gov/) [25]. The dataset contains a total of 202 samples, including 185 samples from tumor primary sites (96 ESCCs and 89 EACs), 1 metastatic ESCC sample and 16 adjacent normal tissues. The files of 96 ESCC primary tumor samples and 16 adjacent normal tissue samples were used for further analysis. The IDAT files were processed by the R Bioconductor ChAMP package (v2.21.1) [26]. Firstly, all files were up-loaded into R with champ.load function. Then, probes were screened with a detection P value > 0.01, and the probes with less than 3 beads in at least 5% of samples were also filtered out. Furthermore, we also filtered out all non-CpG, SNP-related and multi-hit probes, as well as probes locate in chromosome X and Y. Finally, we obtained the beta values of a total of 381,451 CpG sites for following analyses. After pre-processing, we then normalized the beta values by using Beta Mixture Quantile dilation (BMIQ) method to correct type I and type II probe bias [27].
The clinical information of ESCA cohort was obtained from the University of California Santa Cruz (UCSC) Xena database (https://tcga.xenahubs.net), and the data of 96 ESCC patients was summarized in Table 1. In addition, to analyze gene expression of ESCC, we downloaded TCGA ESCA cohort gene expression data estimated by log2(x + 1) transformed RNA-seq by Expectation Maximization (RSEM) normalized count from Xena database, and the data of 11 normal samples and 95 primary ESCC samples was kept for further analysis.
Table 1 The clinical characteristics of 96 ESCC patients included in this studyGSE53624 dataset [28], the gene expression assay of 119 paired ESCC cancer and adjacent normal tissues, was downloaded from Gene Expression Omnibus (GEO) database (https://www.ncbi.nlm.nih.gov/geo/). To get the gene expression information, we re-annotated the probes in our previous study [29]. Moreover, we obtained the expression profile of CFAP52 in pan cancer from Gene Expression Profiling Interactive Analysis 2 (GEPIA2) database (http://gepia2.cancer-pku.cn/) [30].
In addition, in order to investigate the expression of CFAP52 at the single cell level, two ESCC single cell RNA-seq datasets were obtained from GEO with SRA Toolkit (v3.0.5): GSE160269 dataset encompassing 4 adjacent normal and 58 tumor tissues from 58 ESCC patients [31], and GSE203115 dataset including 12 samples of 3 ESCC patients [32]. Raw FASTQ files were processed with Cell Ranger (v7.2.0) and mapped to GRCh38 reference genome to generate the gene expression matrices for each sample. Subsequently, Seurat package (v5.1.0) pipeline was employed to conduct quality control and downstream analysis [33]. For GSE160269 dataset, we excluded the low-quality genes and cells that met the following criteria: (1) genes expressed in less than 10 cells; (2) cells with < 200 genes or > 5000 genes; (3) cells with < 1000 or > 40,000 total counts and (4) cells with mitochondrial gene fraction more than 20% as well as erythrocytic gene content no less than 0.1%. Moreover, immune cells in CD45- dataset and non-immune cells in CD45 + dataset were discarded. For GSE203115 dataset, we only kept: (1) genes expressed in at least 10 cells; (2) cells with 200–5000 genes; (3) cells with 1000–30,000 unique molecular identifier (UMI) counts and (4) cells with fewer than 15% mitochondrial gene proportion and erythrocytic gene ratio < 0.1%. Doublets were analyzed and removed with DoubletFinder package (v2.0.4). Raw counts were firstly normalized with NormalizeData function. Then, highly variable genes were selected by using the FindVariableGenes function with default parameters. ScaleData function was employed to scale the normalized data and to regress out mitochondrial gene fraction in each cell, followed by principal component analysis (PCA) with RunPCA function. To exclude the batch effect, the data was integrated with HarmonyIntegration method. Subsequently, we used FindNeighbors and FindClusters functions to perform clustering with the top 30 principal components (PCs) which was determined by ElbowPlot function. The resolution parameter in FindClusters function was set to 0.1. Uniform Manifold Approximation and Projection (UMAP) for reduction was conducted with RunUMAP function to visualize cluster results. The cell clusters were manually annotated according to the specific expression of known marker genes reported previously: EPCAM, SFN, KRT5, KRT14, KRT8 and KRT7 (epithelial cells); VWF, PECAM1, ENG, CDH5, CLDN5 and FLT1 (endothelial cells); RGS5, MCAM, ACTA2 and PDGFRB (pericytes); FN1, DCN, COL1A1, COL1A2, COL3A1, COL6A1, C1R, LUM and FAP (fibroblasts); CD2, CD3D, CD3E and CD3G (T cells); CD19, CD79A, MS4A1, JCHAIN and MZB1 (B cells) and CD68, LYZ, CD14, IL3RA, LAMP3, CLEC4C, TPSAB1 and FCGR3A (myeloid cells). SingleR package (v2.6.0) was used to further verify the annotation result. Besides, we employed CopyKAT package (v1.1.0) to predict the malignant epithelial cells with endothelial cells as normal reference in tumor samples. To investigate the expression profile of CFAP52 in different cell types in GSE160269 dataset, we integrated CD45- and CD45 + dataset with RunHarmony function from harmony package (v1.2.0) [34].
Cell lines
Human ESCC cell lines used in this study were gifted from Dr. Y Shimada (Kyoto University) and cultured with RPMI-1640 culture medium (Lonza, Switzerland) containing 10% fetal bovine serum (FBS) (Gibco, USA) and 1% penicillin/streptomycin at 37 °C and 5% CO2. All the cell lines have been identified by Short Tandem Repeat (STR) profiling.
Vector construction and cell transfection
The full-length coding sequence region of CFAP52 was cloned into lentivirus vector pLenti6 and the empty vector was used as a control. These constructs and package plasmids (PLP1, PLP2, PLP/VSVG) were transfected into HEK293T cells with Lipofectamine 2000 (Invitrogen, USA) to generate corresponding lentiviruses, followed by infecting KYSE410 and KYSE450 cells. 2 µg/ml puromycin was used to identify the stable clones expressing CFAP52. For CFAP52 knockdown, specific siRNAs were transfected into YES2 and KYSE410 cells with Lipofectamine 2000 (Invitrogen, USA) solution. The siRNAs used in this study were listed in Table 2.
Table 2 siRNA sequences used in this studyDifferential methylation analysis
Mann-Whitney U test was used to identify the differentially methylated CpG sites between different sex or alcohol consumption groups with the beta values of all 381,451 CpG sites. P < 0.05 and| delta beta| > 0.1 was set as the criterion for significant differentially methylated CpGs. The differentially methylated positions (DMPs) between ESCC and normal samples were calculated by ChAMP package with champ.DMP function [26]. For a significant DMP, the absolute delta value of the average beta value in tumors and normal samples should be greater than 0.2 and the adjusted P value should be less than 0.05. To identify stage-related DNA methylation, Mann-Whitney U test was utilized to select the DMPs with P < 0.05 and| delta beta| > 0.1 in normal vs. stage I and II group and stage I and II vs. stage III and IV group, respectively. Subsequently, the DMPs, whose methylation levels monotonically changed in two groups, were selected as stage-related CpGs.
Differential gene expression analysis
The R package limma (v3.58.1) was utilized to analyze the differentially expressed genes (DEGs) between different ESCC sex groups or alcohol consumption groups with ESCC gene expression RSEM data [35], and P < 0.05 and| logFC| > 1 were used to select significant DEGs. To identify stage-related genes, we used student’s t-test to screen the genes with P < 0.05 in normal vs. stage I and II group and stage I and II vs. stage III and IV group, respectively. Then, the genes, whose expression levels monotonically changed in two groups, were selected as stage-related genes.
Survival analysis
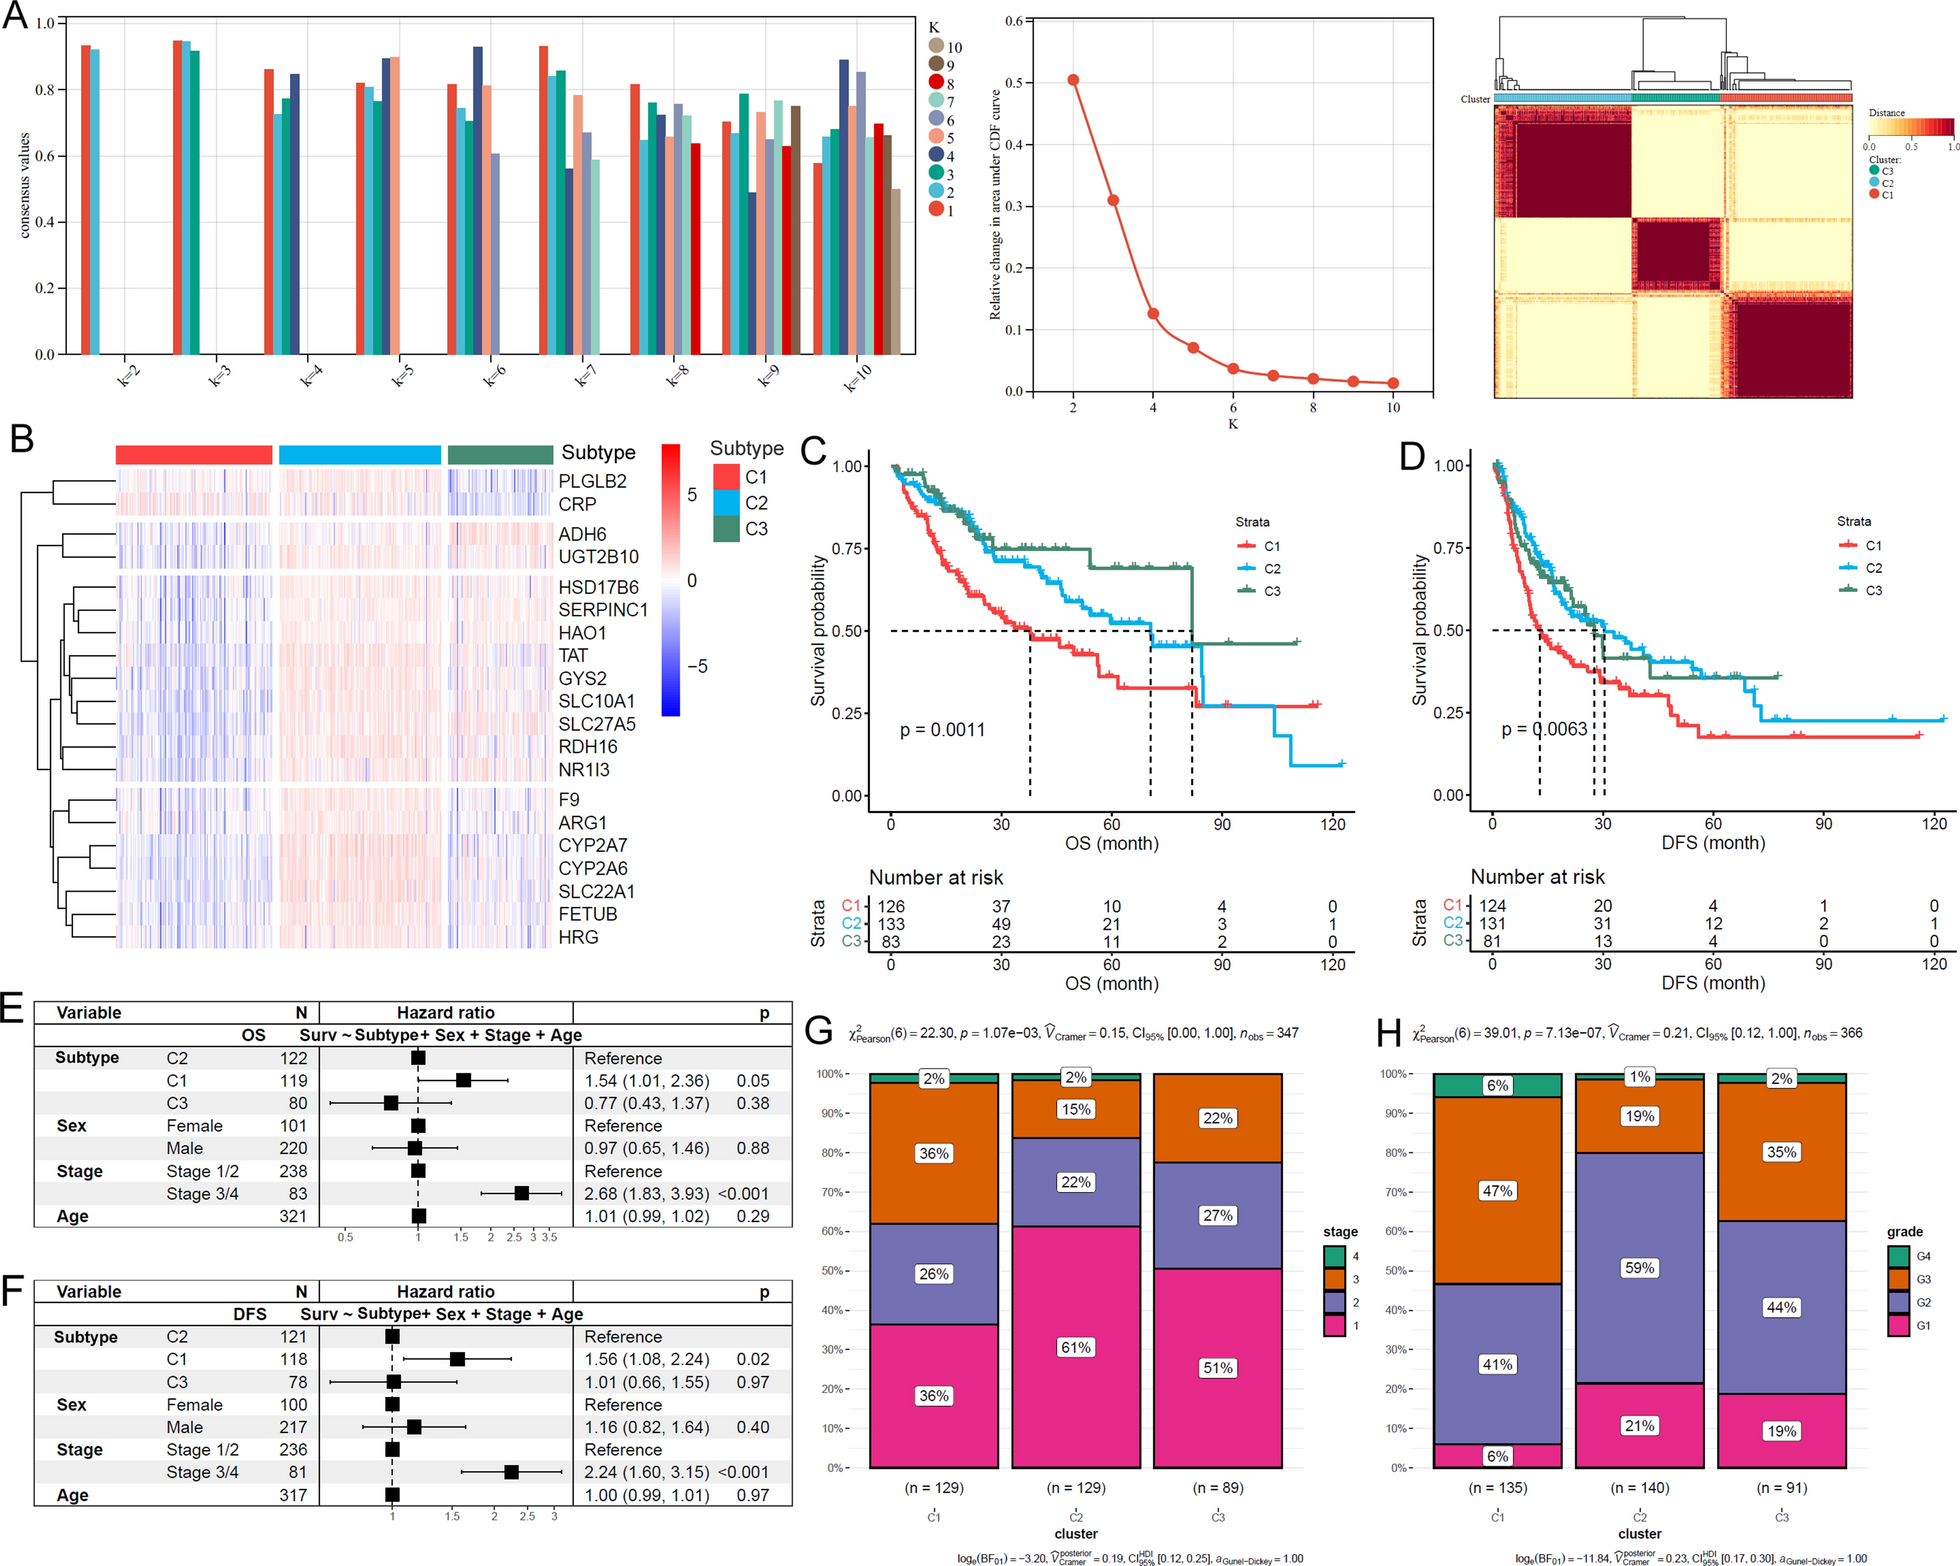
In order to identify the survival-related CpG sites, ESCC patients were firstly divided into two groups based on the median beta value of each DMP. Subsequently, cox regression analysis was conducted to calculate the P values and hazard ratio (HR) values of overall survival (OS), disease-free survival (DFS) and progression-free interval (PFI) with R survival package (v3.5-8), respectively. Multivariate cox regression was performed with survival package. The DMPs with P < 0.05 were regarded as prognosis-related CpGs. Kaplan-Meier curves were drawn to estimate OS, DFS and PFI of different ESCC clusters/groups, and the statistical differences between the curves were estimated by log-rank test. To study the associations between CFAP52 and FOXL2NB expression and ESCC overall survival, R package survminer (v0.4.9) was used to define the optimal cut-off value for high and low expression groups. Similarly, the P values were calculated with log-rank test.
Consensus clustering
In order to identify the ESCC subgroups, the beta values of survival-related CpG sites were utilized to perform consensus clustering by R package ConsensusClusterPlus (v1.66.0) with the parameters: maxK = 10, reps = 1000, pItem = 0.8, and pFeature = 1 [36].
EMT score
The EMT score was computed with the method which has been reported by Chen et al. [37]. Briefly, we firstly extracted the expression data of 51 mesenchymal genes and 25 epithelial genes in ESCC, and then the EMT score for each sample was estimated as the delta value between mean values of all mesenchymal genes and epithelial genes.
Analysis of immune cell infiltration
To assess the immune cell infiltration, the ESCC gene expression data was uploaded to CIBERSORTx database (https://cibersortx.stanford.edu/) [38]. Then, the immune cell fractions were computed in absolute mode with default LM22 immune cell signature.
Estimation of drug sensitivity
The R package oncoPredict can be used to predict drug sensitivity of cancer samples with gene expression data based on known drug response data of cell lines [39]. Accordingly, oncoPredict (v0.2) was employed to assess the drug sensitivities of ESCC samples based on Genomics of Drug Sensitivity in Cancer (GDSC) data of GDSC1 set (https://www.cancerrxgene.org/) [40].
Western blot
Radio Immunoprecipitation Assay (RIPA) buffer (Beyotime, China), supplemented with the protease and phosphatase inhibitor cocktail (Roche, Germany), was used to extract protein from cells. The protein was quantified using a BCA Protein Assay Kit (Beyotime) and separated on sodium dodecyl sulfate-polyacrylamide gel electrophoresis (SDS-PAGE), followed by transferring into polyvinylidene fluoride (PVDF) membranes (Millipore, USA). The antibodies against CFAP52 (1:1000, Abcam, ab127559) and β-actin (1:5000, Abcam, ab8226) were used to incubate the PVDF membranes overnight at 4 °C. After incubation with secondary antibodies, protein bands were imaged with Amersham Imager 600 (GE, USA).
Cell proliferation assay
The 3-(4,5-dimethylthiazol-2-yl)−5-(3-carboxymethoxyphenyl)−2-(4-sulfophenyl)−2 H-tetrazolium (MTS) assay was used to detect cell viability, which is an indicator for cell proliferation. In brief, about 3000 cells per well were seeded on 96-well culture plate and incubated for 0, 24, 48 and 72 h, respectively. 100 µL 10% MTS solution (Promega, USA) was added after discarding the culture medium. After incubation for 1–4 h, the optical density (OD) values of these wells were measured at 490 nm to calculate the relative cell viability.
Colony formation assay
About 2000 ESCC cells per well were seeded on 6-well culture plate and incubated with RPMI-1640 complete culture medium at 37 °C. Two weeks later, the colonies were fixed by using 100% methanol for 10 min and then stained with 0.1% crystal violet solution for 30 min at room temperature. A stereomicroscope (Leica) was used to take photographs for the grown colonies.
Cell cycle assay
For cell cycle analysis, about 1 × 10⁶ ESCC cells per well were seeded on 6-well culture plate and incubated for 24 h. The cells were washed with 1×PBS twice and then fixed with 70% ethanol solution at −20 °C overnight. After washing the cells with 1×PBS, 500 µL propidium iodide (PI) solution (BD Biosciences, USA) was added to cell pellets, followed by incubation for 20 min at room temperature. Cell cycle distribution or DNA content were analyzed and evaluated by Accuri™ C6 flow cytometer (BD Bioscience).
Migration assay
For migration assay, about 2 × 10⁵ ESCC cells were counted and resuspended with RPMI-1640 culture medium without FBS. These cells were transferred into the top chamber of 8 μm 24-well insert (Corning, USA) and the culture medium containing 20% FBS was added into the bottom chamber. The cells were incubated at 37 °C for less than 24 h and then fixed by transferring the top chamber into 100% methanol solution for 10 min. 0.1% crystal violet was used to stain the migrated cells, followed by visualizing and analyzing these cells using a stereomicroscope (Leica).
Scratch wound healing assay
About 5 × 10⁵ ESCC cells were counted and planted uniformly on 6-well culture plate for 24 h. The adherent cells were scratched by using a scratcher crosswise to form wounds. The proliferation status of these cells around the scratch wounds was observed after 0, 24 and 48 h, respectively. Then, more than three fields were randomly selected for imaging and analysis with a stereomicroscope (Leica).
RNA-seq and data analysis
We conducted bulk RNA-seq on KYSE410 cells which were infected with lentivirus vector carrying CFAP52 and empty vector, respectively. RNA extraction and library preparation were performed with VAHTS® Universal V8 RNA-seq Library Prep Kit for Illumina according to manufacturer’s instructions. Subsequently, all libraries were sequenced on Illumina NovaSeq6000 with a 2 × 150 bp paired-end mode. Three replicates were performed for each group.
Raw data was firstly processed by fastp (v0.23.4) for adapter trimming and low-quality sequence filtering with the parameters: --length_required 50 --qualified_quality_phred 20 --detect_adapter_for_pe. The pre-processed reads were then aligned to human reference genome (“GRCh38.primary_assembly.genome.fa”, v44) via STAR (v2.7.11b) with the parameter: --sjdbOverhang 149. The read counts for genes were calculated by using featureCounts (v 2.0.2) with the parameters: -B -p --primary --countReadPairs --fracOverlap 0.1 -s 0 -t exon -g gene_id. R package DESeq2 (v1.46.0) was employed to identified DEGs between CFAP52 overexpression and control partner groups.
Kyoto encyclopedia of genes and genomes (KEGG) pathway enrichment analysis
To explore the potential functions of the DEGs, we performed KEGG pathway enrichment analysis to get a primary understanding of the potential signaling pathways in which the DEGs were involved. The analysis was conducted by R Bioconductor clusterProfiler package (v4.14.6) [41]. The enriched pathways were presented in dot plots.
RNA extraction and quantitative real-time PCR (qRT-PCR)
Total RNA was isolated from KYSE410 cells with TRIZOL (Invitrogen). Subsequently, 2 µg RNA was transcribed into cDNA by using RevertAid First Strand cDNA Synthesis Kit (ThermoFisher Scientific, USA) according to the manufacturer’s instructions. qRT-PCR assay was carried out with SYBR® Premix Ex Taq™ (Tli RNaseH Plus) Kit (Takara, Japan) on an ABI PRISM 7500 Sequence Detector (Applied Biosystems, USA). RNA levels were calculated in a manner of 2−ΔΔCT where ΔCT = CT (target)-CT (reference). β-actin-coding gene ACTB was served as an internal reference. The sequences of primers used in this study were listed in Table 3.
Table 3 Primer sequences used in this studyQuantification of arachidonic acid
Relative arachidonic acid level was measured by UPLC-MS/MS system of metabolic platform of College of Future Technology Peking University. In brief, 5 × 10⁶ KYSE410 cells were collected and resuspended with 500 µL 80% methanol solution. After being centrifuged for three minutes at 25,000 g, 100 µL supernatant was diluted with 100 µL of deionized water and mixed, followed by injecting 2 µL this mixture onto the UPLC-MS/MS system. Multiple Reaction Monitoring analyses were performed using a Xevo TQ-S micro Mass Spectrometer.
Immunohistochemistry
The specimens containing 112 tumor tissues and 68 adjacent normal tissues of ESCC were provided by Shanghai Outdo Biotech Co. Ltd. The corresponding pathological information and informed consent were obtained from all patients. Complete overall survival data were available for 111 out of all patients: 88 mortality cases and 23 survivors (one patient excluded due to missing survival data), and the median survival time was 19 months. Then the tissue chip was deparaffinized and hydrated, followed by antigen retrieval through boiling for 3 min in Tris-EDTA buffer (pH 9.0). The samples were blocked using 10% normal goat serum (ZSGB-BIO, China) and followed by incubation with anti-CFAP52 antibody (1:500, Abcam, ab127559) at 4 °C overnight. After that, the sections were incubated with the secondary antibody and were stained using DAB (Dako, Denmark). The expression of CFAP52 protein was evaluated according to the staining intensity as following: 0, negative; 1, weak; 2, strong; 3, very strong. The staining area was scored as following pattern: 0, < 5%; 1, 5–25%; 2, 26–50%; 3, 51–75%; 4, > 75%. The product of staining intensity score and staining area score is defined as “H score”. CFAP52 was considered highly expressed when the H-score was >= 9 in a tumor sample, based on a median H-score of 8.5.
Statistical analyses
Mann-Whitney U test was utilized to identify the differentially methylated CpG sites and to compare CFAP52 expression in different epithelial cell groups. Student’s t-test was used to estimate the statistical differences of gene expression, EMT score, immune cell infiltration, CIBERSORTx absolute score. Besides, the cell viability, cell number, wound healing rate, colony formation efficiency, qRT-PCR gene expression, arachidonic acid level and CFAP52 protein expression were also compared by student’s t-test. Prognosis-related CpG sites were selected by cox regression analysis. Survival curves were conducted by Kaplan-Meier method, and the statistical differences between the curves were estimated by log-rank test. PCA for prognosis-related CpGs was performed and visualized with R FactoMineR (v2.11) and factoextra (v1.0.7) packages, respectively. Each P value was two-sided, and P < 0.05 was considered statistically significant.


Comments (0)