
Remember me

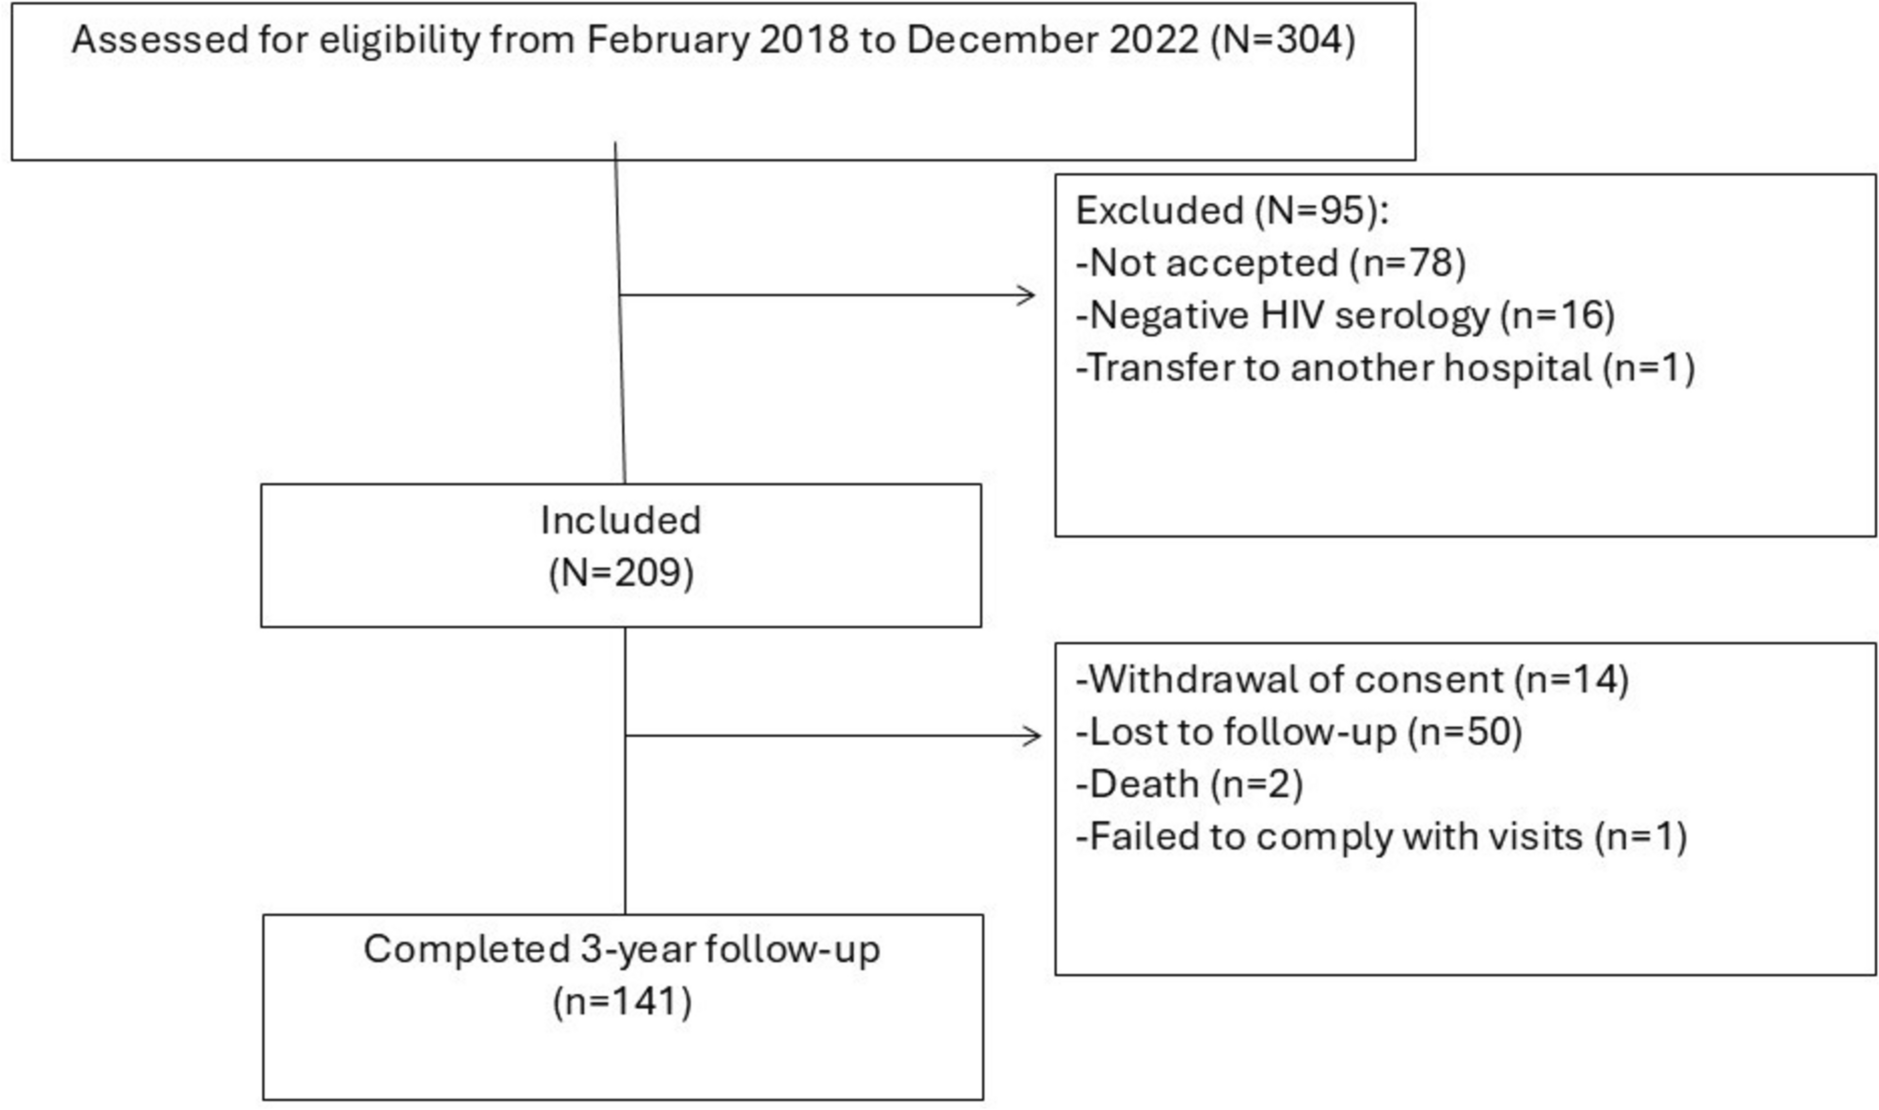
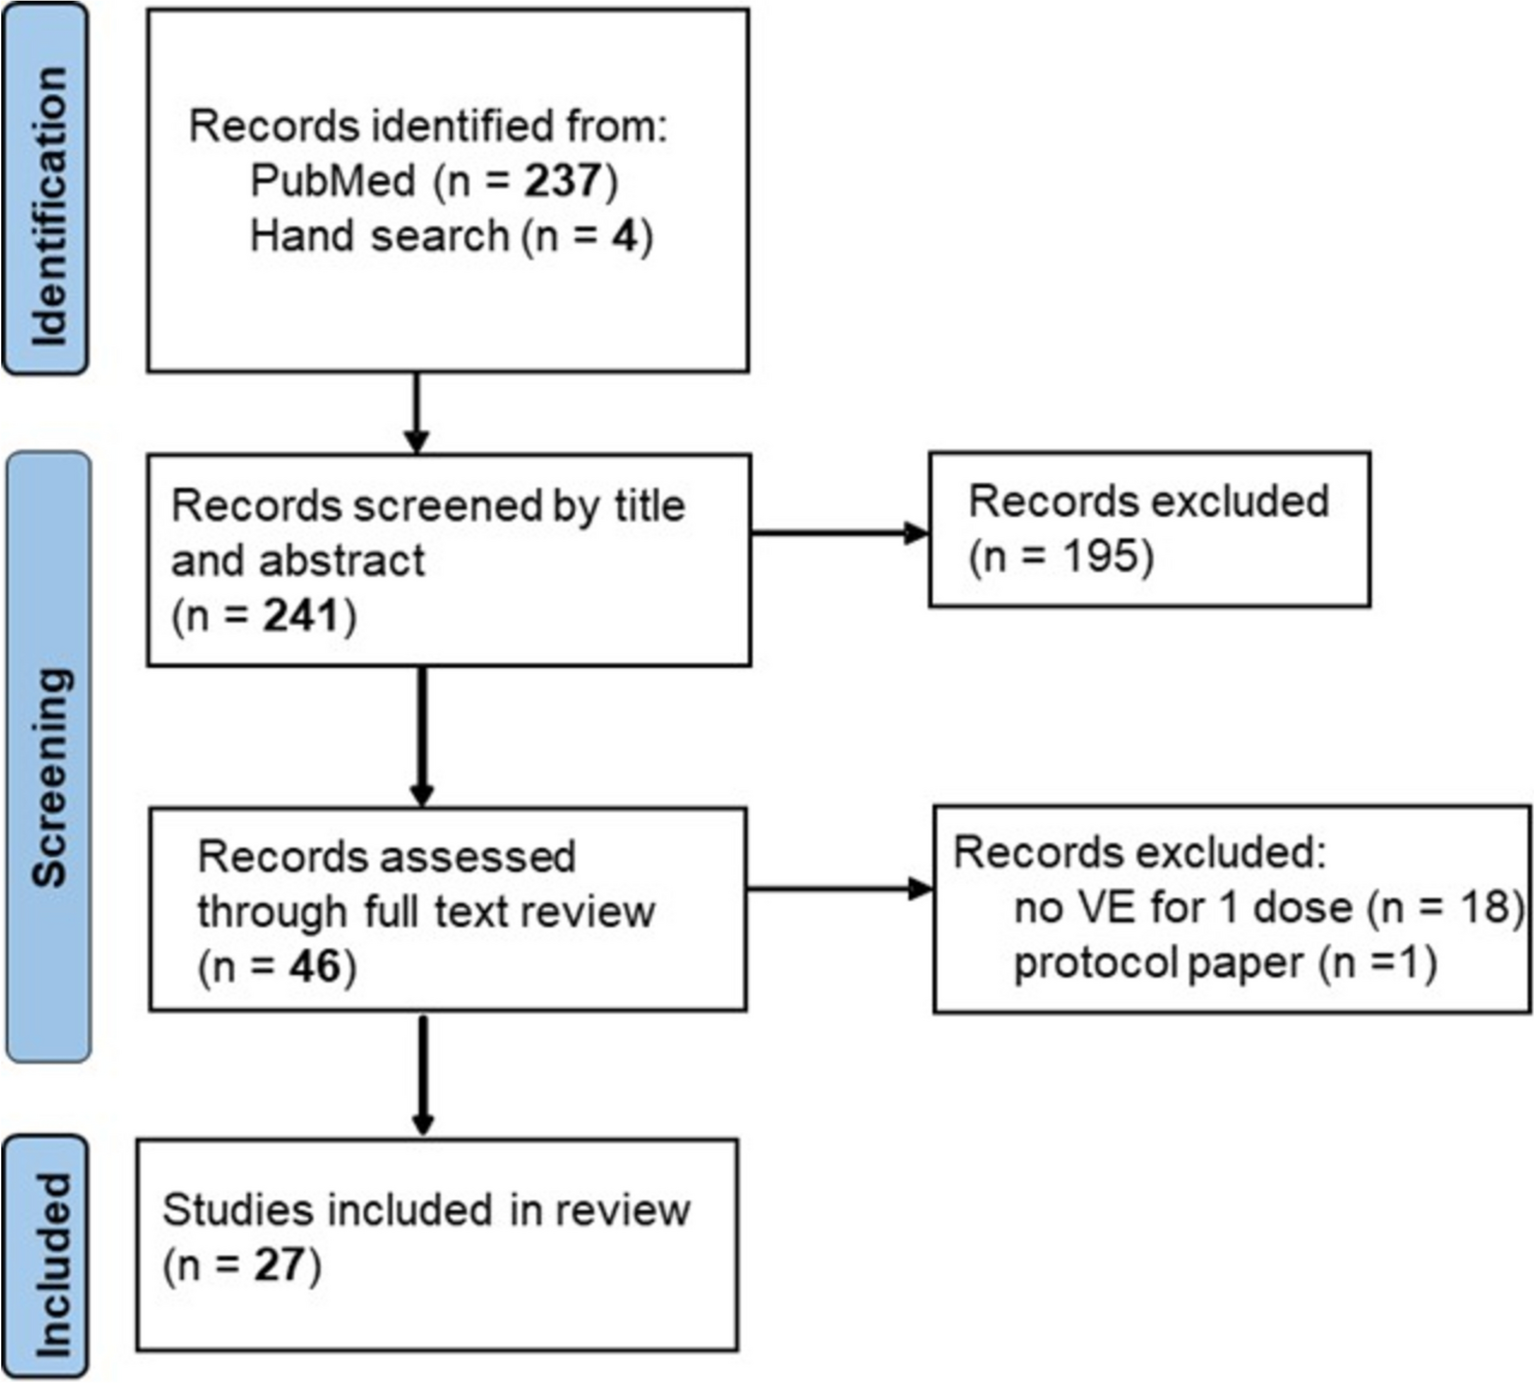

After the initial screening, a total of 162 articles were identified, of which 85 were duplicates. Following the inclusion and exclusion criteria, nine studies were ultimately included in the analysis, involving 939 adult patients with HBV-ACLF treated with TAF, TDF, or ETV. The flowchart of the study selection and inclusion process is presented in Fig. 1.
Fig. 1
Flow chart of the study identification, screening, and inclusion processes. ETV entecavir, TDF tenofovir disoproxil fumarate, TAF tenofovir alafenamide
Study CharacteristicsThe nine studies [19,20,21,22,23, 26,27,28,29] included in the analysis comprised five prospective cohort studies and four retrospective cohort studies. Three of these studies compared all three drugs, while the remaining six compared any two of the three drugs. All included studies were conducted with patients from Asia, specifically China and Bangladesh. As a result, the findings may reflect a limited ethnic population. Nonetheless, these studies provide valuable clinical evidence for assessing the efficacy and safety of different nucleotide analogs in treating HBV-ACLF. The key characteristics of the included studies are summarized in Table 1. Furthermore, no statistically significant differences in baseline characteristics were observed between the intervention groups in any of the studies. Notably, patient ages across treatment arms were generally similar and none of the studies reported significant age-related imbalance. Therefore, we believe that age was unlikely to be a confounding factor in the observed outcomes.
Table 1 Characteristics of the included studiesRisk of Bias AssessmentTwo independent researchers assessed the quality of the included studies using the NOS. According to the quality analysis, the risk of bias for all included studies was considered acceptable. The specific results are shown in Table 2.
Table 2 Quality evaluation of the included cohort studies via the Newcastle–Ottawa Scale (NOS)Network Meta-Analysis ResultsHeterogeneity and ConsistencyIn the overall consistency analysis, the results indicated that, with the exception of the MELD score, there was good consistency across studies for the other outcome measures. Specifically, there was no significant heterogeneity for the following outcomes: 12-week survival rate (P = 0.313), 12-week HBV-DNA clearance rate (P = 0.845), 4-week HBV-DNA levels (P = 0.971), 4-week ALT levels (P = 0.272), 4-week TBIL levels (P = 0.315), 4-week eGFR levels (P = 0.429), and 4-week cr levels (P = 0.515). In contrast, the 12-week MELD score showed a P-value of 0.019, indicating some inconsistency for this specific outcome. In the local inconsistency check, no significant differences (P > 0.05) were found between the direct or indirect comparisons of studies for survival rate, HBV-DNA clearance rate, HBV-DNA levels, ALT levels, TBIL levels, eGFR levels, and cr levels, indicating that there was no local inconsistency between studies for these outcomes. However, in the MELD score analysis, no local inconsistency was observed between TDF and ETV comparisons, but significant inconsistency was noted between TAF and TDF (P = 0.002) as well as TAF and ETV (P = 0.01).
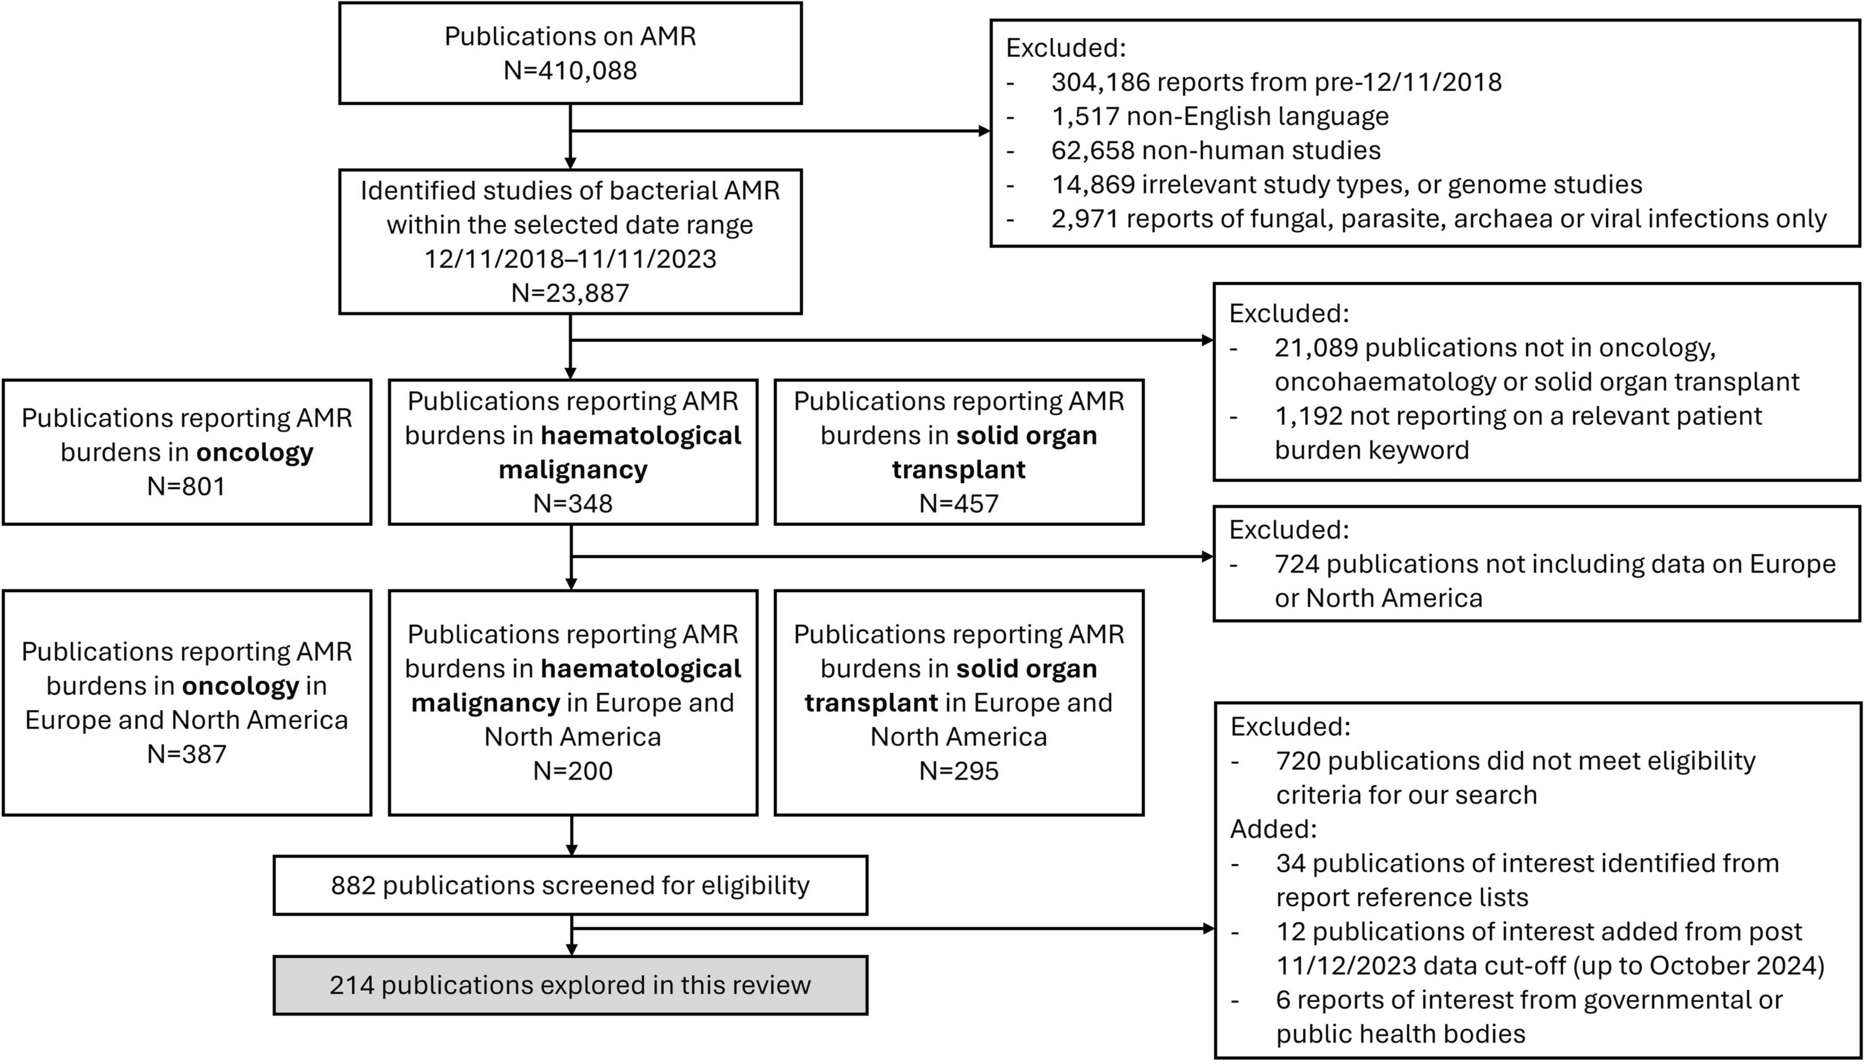
Network Structure and GeometryIn this network meta-analysis, we assessed multiple outcome measures following drug treatment, including survival rate, HBV-DNA levels, HBV-DNA clearance rate, MELD score, ALT, TBIL, eGFR, and cr levels. Figure 2 displays the network geometry of the studies, with TAF, TDF, and ETV represented as nodes. The lines connecting the nodes represent the comparisons between the drugs. The size of the blue nodes is proportional to the number of patients who received that specific drug treatment, and the width of the black lines reflects the number of studies used to compare the two drugs.
Fig. 2
Geometry for the network meta-analysis. Figure parts a–h represent studies of a survival rate, b hepatitis B virus deoxyribonucleic acid clearance rate (HBV-DNA clearance rate), c hepatitis B virus deoxyribonucleic acid level (HBV-DNA level), d model for end-stage liver disease score (MELD score), e alanine aminotransferase (ALT), f total bilirubin (TBIL), g estimated glomerular filtration rate (eGFR) and h creatinine (cr). ETV entecavir, TDF tenofovir disoproxil fumarate, TAF tenofovir alafenamide
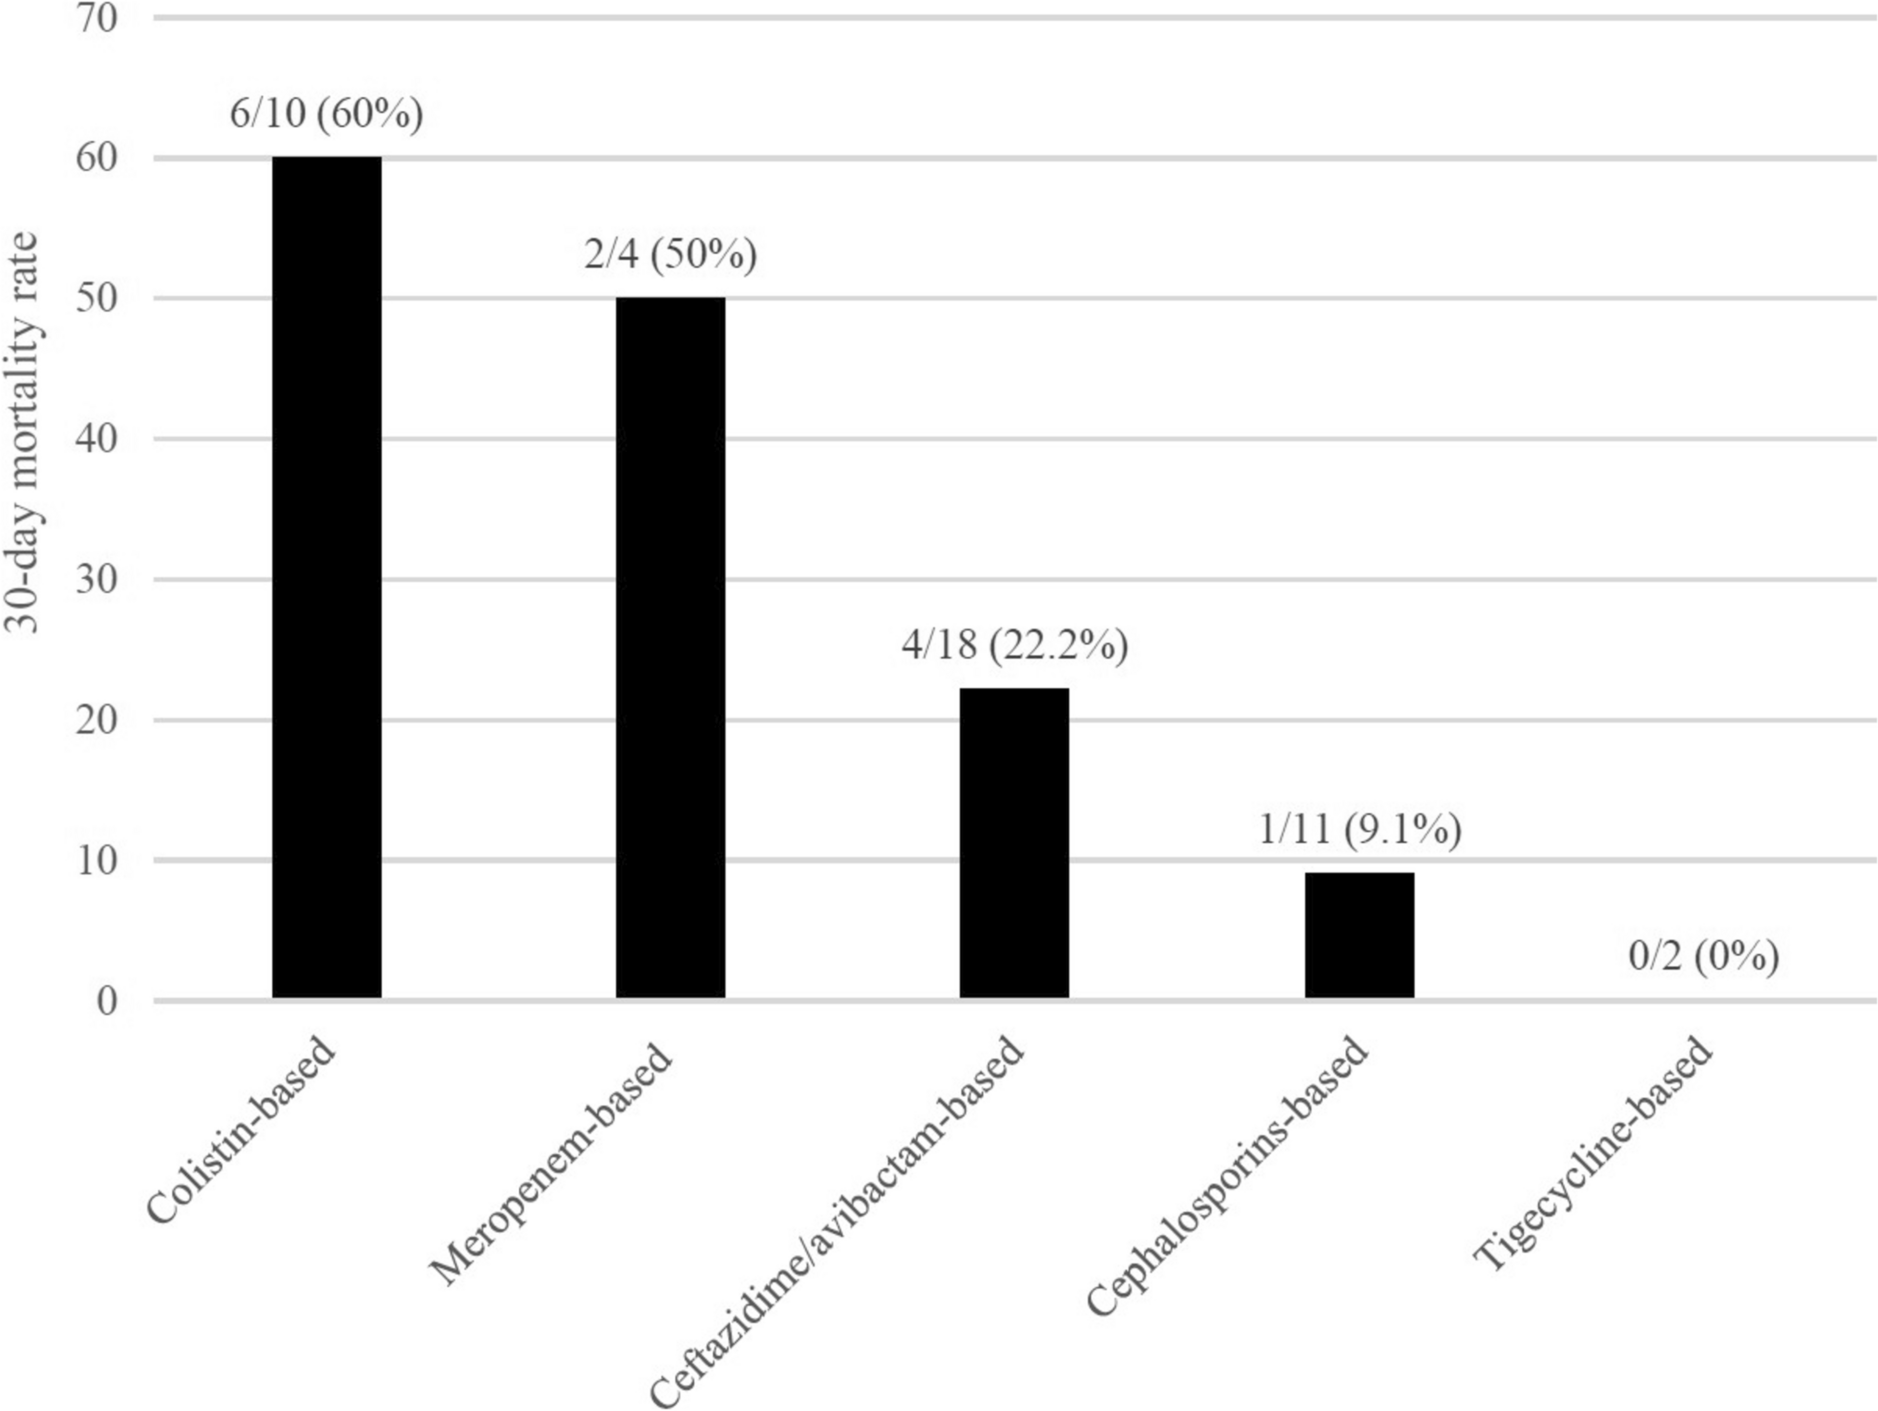
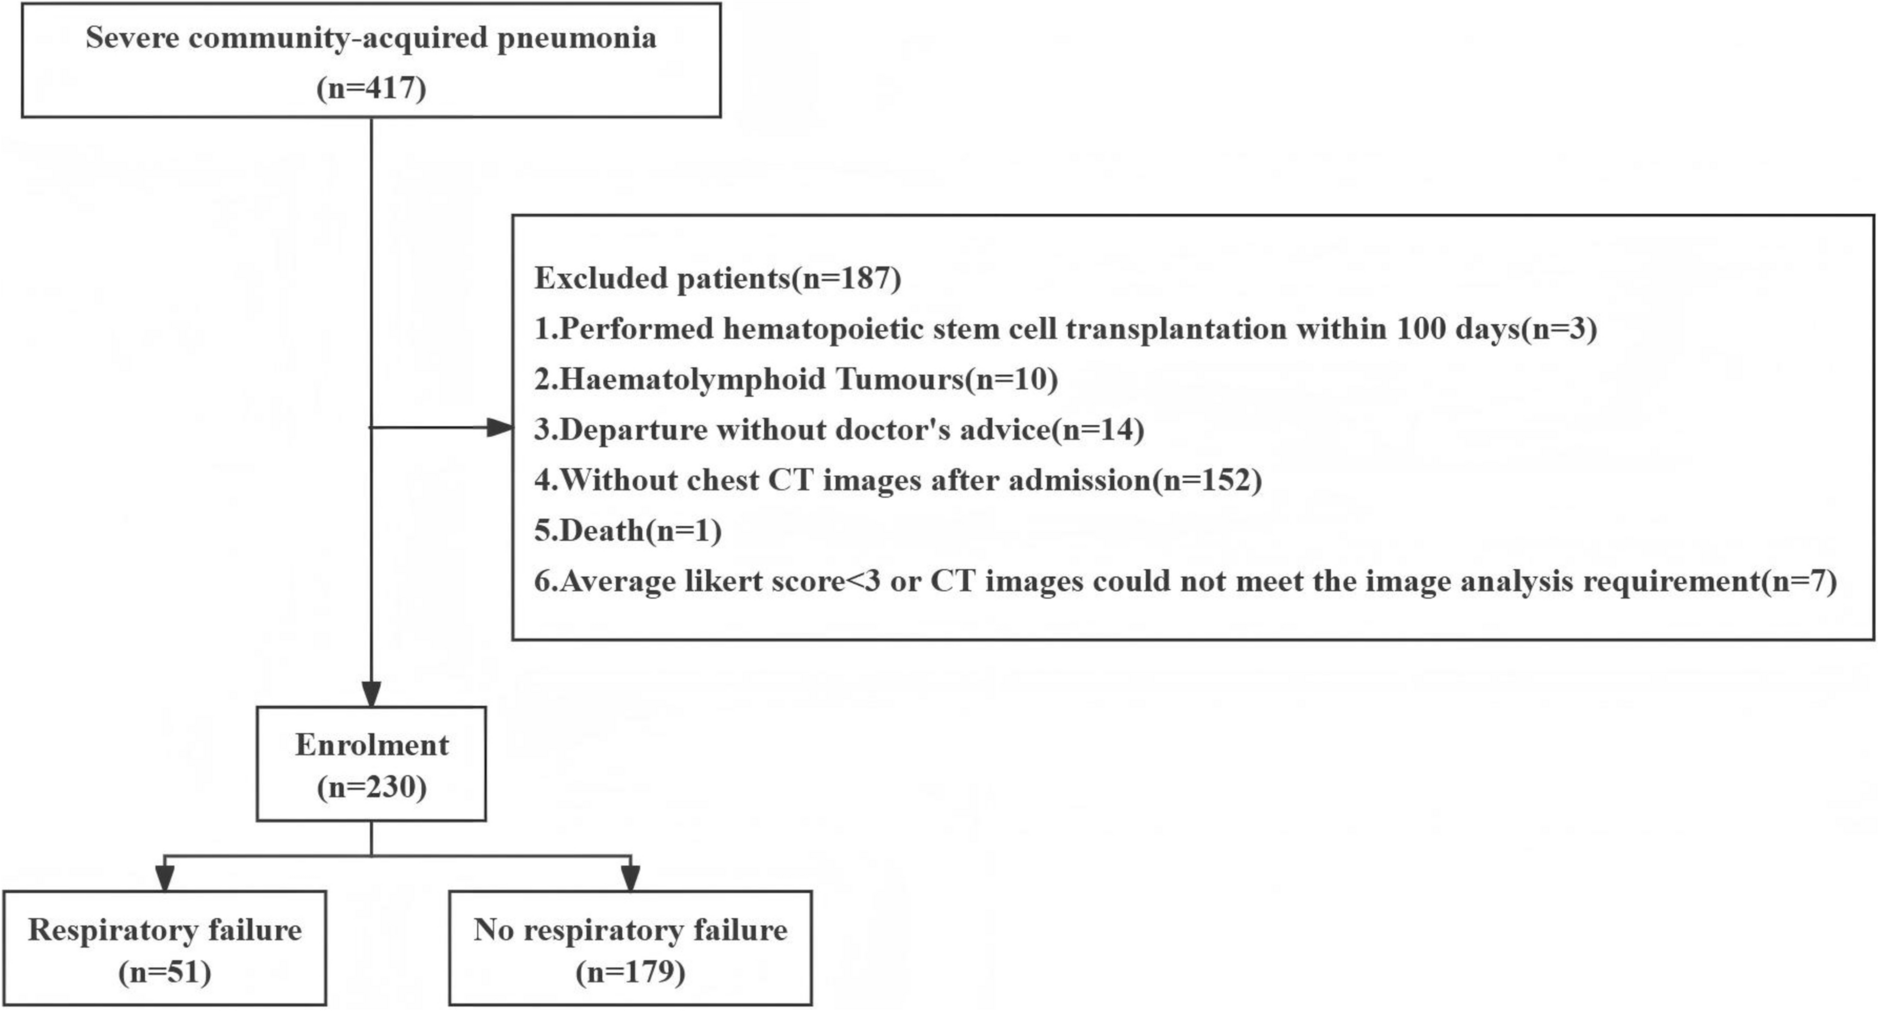
Efficacy and Safety OutcomesSurvival RateBased on the forest plot (Fig. 3a), no significant difference was found between ETV and TAF (SMD = 0.10; 95% CI − 0.09 to 0.29) or between TDF and TAF (SMD = − 0.11; 95% CI − 0.23 to 0.02). However, TDF was significantly superior to ETV, with a statistically significant difference (SMD = − 0.21; 95% CI − 0.36 to − 0.06). Consistently, the SUCRA (Fig. 4a) rankings further supported these findings, showing TDF (SUCRA 92.9%) ranked highest, followed by TAF (SUCRA 54.5%) and ETV (SUCRA 2.6%).
Fig. 3
Forest plot of pairwise comparisons between two drugs. Figure parts a–h represent studies of a survival rate, b hepatitis B virus deoxyribonucleic acid clearance rate (HBV-DNA clearance rate), c hepatitis B virus deoxyribonucleic acid level (HBV-DNA level), d model for end-stage liver disease score (MELD score), e alanine aminotransferase (ALT), f total bilirubin (TBIL), g estimated glomerular filtration rate (eGFR) and h creatinine (cr). ETV entecavir, TDF tenofovir disoproxil fumarate, TAF tenofovir alafenamide
Fig. 4
Surface under the cumulative ranking (SUCRA) analysis for the efficacy of tenofovir alafenamide (TAF), tenofovir disoproxil fumarate (TDF), and entecavir (ETV) across multiple outcome measures. Figure parts a–h represent studies of a survival rate, b hepatitis B virus deoxyribonucleic acid clearance rate (HBV-DNA clearance rate), c hepatitis B virus deoxyribonucleic acid level (HBV-DNA level), d model for end-stage liver disease score (MELD score), e alanine aminotransferase (ALT), f total bilirubin (TBIL), g estimated glomerular filtration rate (eGFR) and h creatinine (cr)
HBV-DNA Clearance RateRegarding HBV-DNA clearance rate, the forest plot (Fig. 3b) showed no significant difference between TDF and TAF (SMD = − 0.11; 95% CI − 0.52 to 0.31) or between ETV and TDF (SMD = − 0.29; 95% CI − 0.64 to 0.06), while ETV was significantly less effective than TAF, with a notable difference (SMD = − 0.40; 95% CI − 0.77 to − 0.02). The SUCRA analysis (Fig. 4b) showed that TAF was the most effective in clearing HBV-DNA (SUCRA 83.5%), followed by TDF (SUCRA 63.3%), and ETV was the least effective (SUCRA 3.2%).
HBV-DNA LevelsIn terms of lowering HBV-DNA levels, no significant statistical differences were observed in pairwise comparisons between the three drugs (Fig. 3c). However, the SUCRA analysis (Fig. 4c) indicated that TAF was more effective than both ETV and TDF in reducing HBV-DNA levels, with the following ranking: TAF (SUCRA 72.2%) > ETV (SUCRA 49.1%) > TDF (SUCRA 28.8%).
MELD ScoreFor the MELD score, no significant difference was observed between ETV and TAF (SMD = 0.67; 95% CI − 0.31 to 1.65) or between TDF and TAF (SMD = − 0.38; 95% CI − 1.48 to 0.73). However, TDF was significantly superior to ETV, with a statistically significant difference (SMD = 1.05; 95% CI 0.15 to 1.94), as shown in Fig. 3d. Correspondingly, the SUCRA values suggested a higher probability of MELD score improvement with TDF (SUCRA 86.4%) than with ETV (SUCRA 5.0%) (Fig. 4d).
Liver Function ImprovementWe extracted ALT and TBIL as indicators for liver function improvement. The forest plots (Fig. 3e and f) showed no statistically significant differences in pairwise comparisons between the three drugs for both markers. However, the SUCRA analysis (Fig. 4e and f) indicated that ETV performed the best in improving liver function, followed by TAF, and TDF showed the lowest probability of liver function improvement.
Renal Function Side EffectsTo assess the side effects related to renal function decline, we extracted eGFR and cr as indicators. According to the SUCRA analysis (Fig. 4g and h), TAF had the lowest probability of eGFR decline and serum creatinine increase, while ETV had the highest probability of eGFR decline and cr increase. The analysis of eGFR (Fig. 3g) showed that ETV had a significantly greater impact on eGFR compared to TAF (SMD = − 0.35; 95% CI − 0.52 to 0.18), while no significant differences were observed between TDF and TAF or between ETV and TDF for eGFR (SMD = − 0.10; 95% CI − 0.40 to 0.21 and SMD = − 0.26; 95% CI − 0.56 to 0.04, respectively). Regarding serum creatinine (Fig. 3h), both TDF and ETV had a greater impact on cr increase compared to TAF (SMD = 0.29; 95% CI 0.00–0.57 for TDF; SMD = 0.30; 95% CI 0.09–0.51 for ETV), while no significant difference was observed between ETV and TDF regarding cr increase. In summary, TAF had the least renal side effects, indicating higher renal safety, while ETV had the most significant negative impact on renal function.
Publication BiasThe funnel plots for the efficacy and safety of the three drugs across different outcome measures are shown in Fig. 5. The funnel plots for survival rate, HBV-DNA clearance rate, MELD score, TBIL, and eGFR exhibited symmetry, indicating a well-distributed inclusion of studies. In contrast, the funnel plots for HBV-DNA levels, ALT, and cr displayed asymmetry, suggesting a higher likelihood of publication bias in the studies related to these outcome measures.
Fig. 5
Funnel plots for efficacy and safety of three drugs across various outcome measures. A represents tenofovir alafenamide (TAF), B represents tenofovir disoproxil fumarate (TDF), and C represents entecavir (ETV). HBV-DNA clearance rate hepatitis B virus deoxyribonucleic acid clearance rate, HBV-DNA level hepatitis B virus deoxyribonucleic acid level, MELD score model for end-stage liver disease score, ALT alanine aminotransferase, TBIL total bilirubin, eGFR estimated glomerular filtration rate, cr creatinine
Comments (0)