
Remember me
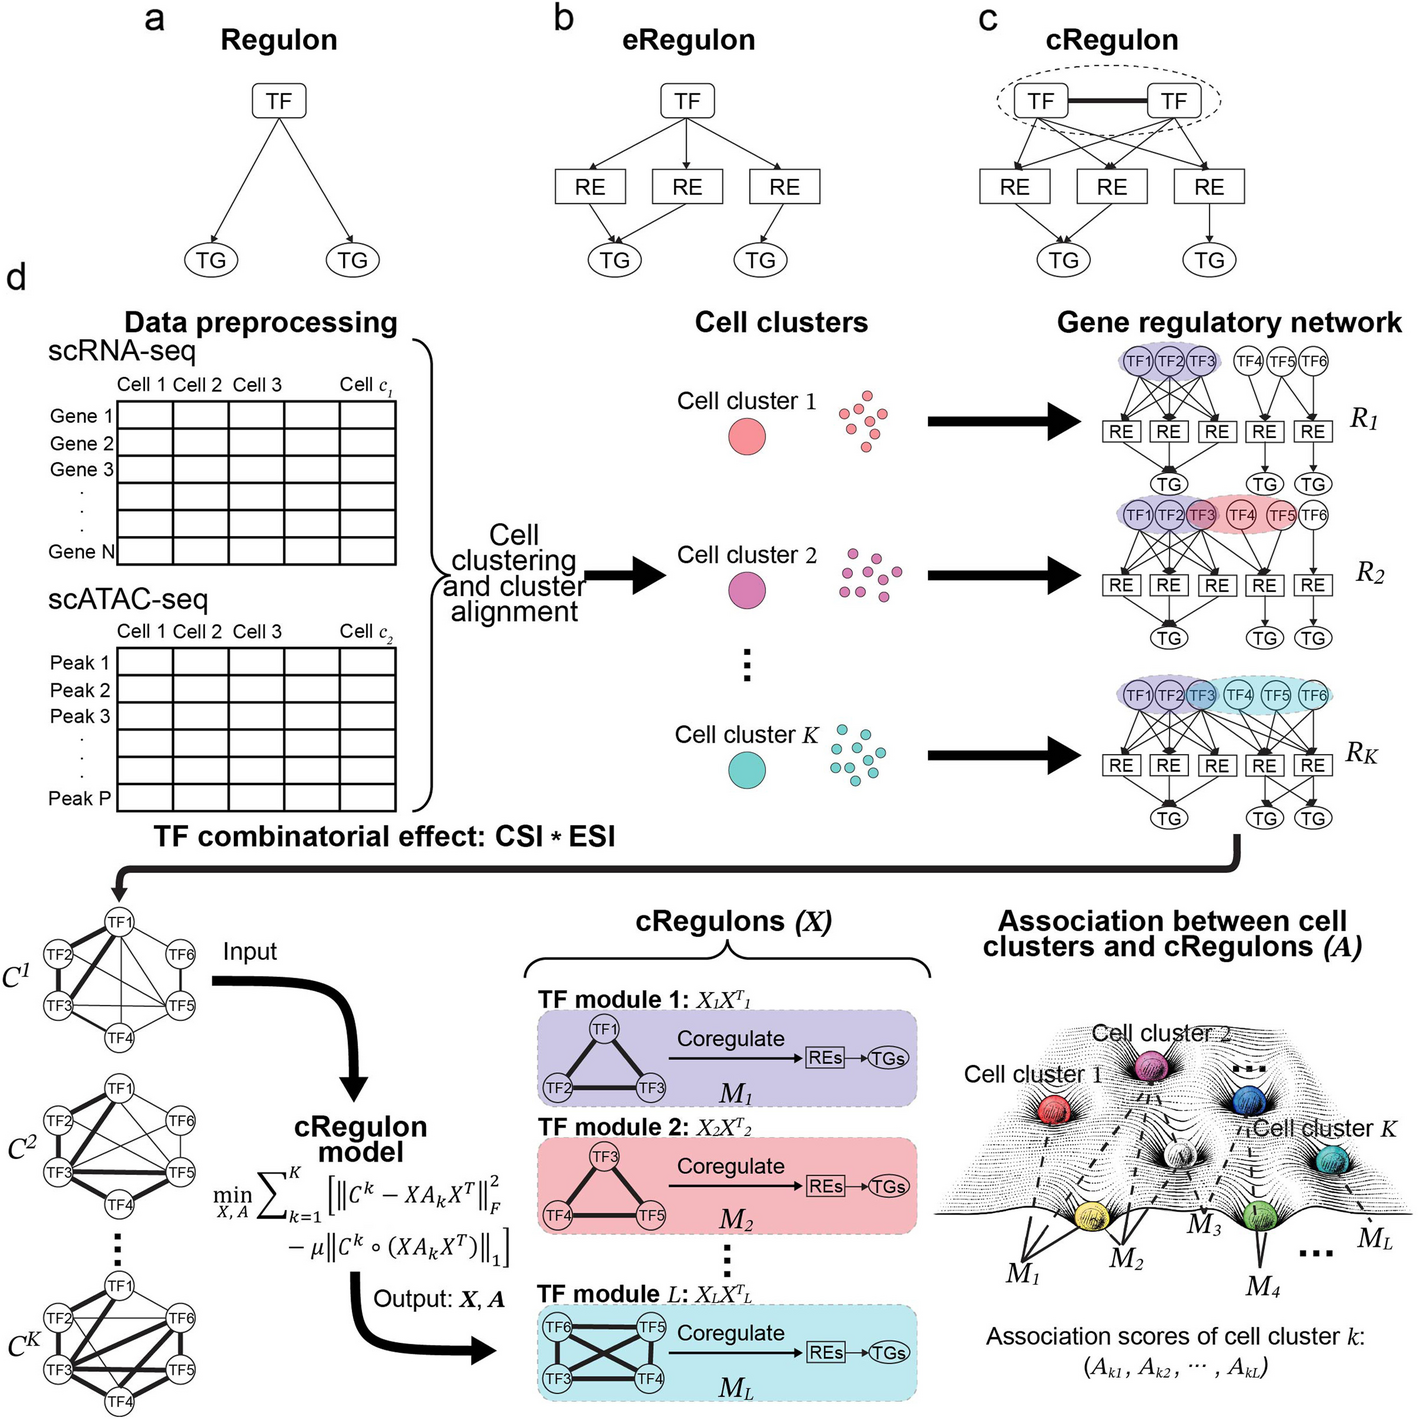

cRegulon is introduced as a concept to integrate gene expression and epigenome state into regulatory units of gene regulation underlying cell types. It is formally defined as the TF combinatorial module as well as the RE that they bind to and the TGs that they regulate. We developed an optimization model to simultaneously infer cRegulons and their associations with cell types (depicted in Fig. 1d).
The initial step involves data preprocessing, followed by clustering the single-cell data into K cell clusters. For single-cell data that are not paired at the cell level, cell clusters from the two data modalities should be aligned first, so that we can obtain the pseudo-bulk RNA-profile and the ATAC profile for each aligned cell cluster. This can be achieved by integrative clustering tools like Seurat [82] and CoupledNMF [83]. Subsequently, in tandem with the paired pseudo-bulk RNA-seq and ATAC-seq data of each cell cluster, we construct its regulatory network using specialized GRN construction tools, such as PECA2 [52]. The cluster-specific regulatory networks are encapsulated in the TF-TG regulatory strength matrices \(^\),\(^\),\(\cdots\), \(^\), where \(K\) denotes that number of cell clusters.
GRNs are believed to be modular [33, 34]. We assume that the modularity of a GRN is induced by TF combinatorial modules, which can be shared by GRNs of many cell clusters or specific to certain cell clusters. Therefore, we conduct a joint analysis of the GRNs from all the cell clusters to infer TF combinatorial modules. For cluster \(k\), we first perform pairwise assessments of TF combinatorial effects. In the definition of the combinatorial effects for a pair of TFs in a cell cluster, we have two considerations: (1) TFs should have high ability to co-regulate other TGs in this cluster, i.e., they should have high connection specificity index (CSI) [84]; (2) TFs should have specific activity in this cluster relative to other clusters, i.e., they should have high expression specificity index (ESI). Then, the combinatorial effect of a pair of TFs is the product of the CSI score and the ESI scores of these two TFs:
$$\beginC_^k=_^k\cdot_i^k\cdot_j^k\end$$
(1)
Here \(_^\) is connection specificity index of \(i\) th TF and \(j\) th TF in cluster \(k\), \(_^\) is expression specificity index of \(i\) th TF in cluter \(k\). High combinatorial effect is an indication of strong co-regulation by two TFs with specific activities in the cell cluster. This procedure generates \(K\) combinatorial effect matrices \(^\),\(^\),\(\cdots\), \(^\) from \(K\) TF-TG regulatory strength matrices \(^\),\(^\),\(\cdots\), \(^\), where \(^\) contains the pairwise combinatorial effects (among the TFs) in cluster \(k\). See “Methods” for details of the computation of the \(C\) matrices from the \(R\) matrices.
Then, an optimization model is developed to identify \(L\) TF combinatorial modules underpinning K combinatorial effect matrices \(^\),\(^\),\(\cdots\), \(^\). Formally, our optimization model is formulated as follows:
$$\begin\underset}\sum\nolimits_k\left[^T\Arrowvert}_F^2-\mu^T\right)\Arrowvert}_1\right]\end$$
(2)
$$\begins.t.X\ge 0;__^\le 1;__\le 1;l=\text,\cdots L,i=\text,\cdots M\\ _=diag\left(_,_,\cdots ,_\right);_\ge 0;__=1;k=\text,\cdots K\end$$
The first term decomposes the TF combinatorial effect matrices in terms of TF modules. The \(\) th column of \(X\) corresponds to the \(\) th TF-module in the sense that its large non-zero components indicate the key TFs in the module. The diagonal elements of the association matrix \(_\) indicate the relative importances of the different TF modules in the combinatorial effect matrix for cell cluster \(k\). The second term is a regularization term to encourage extracting TF modules with large combinatorial effects. Solving the optimization problem yields a solution represented by two variables \(X\) and \(A\). The TF modules can be obtained by thresholding the columns of \(X\). Our method further extracts co-regulated REs and TGs for each TF module, culminating in the formation of \(L\) different cRegulons. Furthermore, the association scores in the diagonal elements of \(_,\) which represent the strengths of associations between cRegulons and cell clusters, can serve as valuable tools for annotating cell types, individual cells, or defined cellular groupings. In essence, the collective representation of cRegulons, coupled with the association matrix, provides a useful picture of the cell type landscape (Fig. 1d).
Further details of data preprocessing, combinatorial effect definition, optimization model as well as algorithm, construction of TF modules and cRegulons, and the cell type annotation through cRegulon combinations can be found in the “Methods” section.
Benchmarking cRegulon’s performance using synthetic regulatory modules and cell typesWe first used an in-silico simulation as proof of concept to show cRegulon can identify modular regulatory units and their associations with preset cell types (Fig. 2a). Briefly, we manually created two TF combinatorial modules (M1: TF1/TF2/TF3, M2: TF3/TF4/TF5) with one overlapped TF (Additional file 1: Fig. S2a, b) and simulated three cell types’ GRNs (TF-TG regulatory strength matrix) with different weights of two TF modules (SimC1: 0.8 M1 & 0.2 M2; SimC2: 0.5 M1 & 0.5 M2; SimC3: 0.2 M1 & 0.8 M2, Additional file 1: Fig. S2c-g). Then we use SERGIO [85] to simulate scRNA-seq data for each cell type from their GRN (Additional file 1: Fig. S2h). Details of simulation can be found in “Methods.” We used the simulated dataset and its true TF modules and true cell type composition (Fig. 2b) to validate cRegulon alongside other methods, focusing on two key aspects: (1) the ability to accurately reconstruct TF modules and (2) the capability to reveal the module composition within each cell type.
Fig. 2
Benchmark with synthesized dataset. a The process of simulating cell type specific GRN and scRNA-seq data with different compositions of TF modules. b The true TF modules and cell type-TF module associations. With cell type-specific GRN as input, c the cRegulon predicted TF modules and d predicted cell type-TF module associations; e the Louvain method predicted TF modules for each cell type. With the input of simulated GRNs and scRNA-seq data, f the cRegulon predicted TF modules and g predicted cell type-TF module associations; h Averaged SCENIC TF activity across three cell types; i the SCENIC TF activity-based prediction of TF modules and j cell type-TF module associations
Since TF modules detection in GRN can be seen as a traditional community searching problem in graph, we first compared cRegulon with Louvain method, which is a commonly used algorithm to detect modules. We applied cRegulon directly to the simulated TF-TG regulatory strength matrices (Additional file 1: Fig. S2e-g) of the three cell types to compute the CSI matrices for each cell type. Then we used cRegulon to identify two TF modules and their associations with the three cell types. It was important to note that this was not the formal version of cRegulon, as the formal approach combined CSI and TF activity to define the \(C\) matrix. Figure 2c displays the \(X\) matrix output by cRegulon, illustrating the weights of TFs in the two TF modules. We observed that cRegulon-identified TF module 1 (cM1) consisted of TF1, TF2, and TF3, while cM2 comprised TF3, TF4, and TF5. This perfectly reconstructed the TF modules as simulated. Figure 2d shows the cRegulon-predicted association between TF modules and cell types. We found that SimC1 was dominated by cM1, SimC3 was dominated by cM2, and SimC2 had relatively balanced weights of cM1 and cM2, which aligns with the truth (Fig. 2b). These findings demonstrated that cRegulon can accurately identify TF modules and their relationships with cell types. We compared cRegulon’s performance with community detection algorithms by applying the Louvain algorithm [86] from the “networkx” package to the simulated R matrices. To obtain two TF modules, we increased the resolution parameter of Louvain algorithm from 0.05 with a step of 0.05 and stopped when two modules were identified (Fig. 2e). For SimC1, the Louvain method incorrectly identified TF1 and TF4 as a module and TF2/TF3/TF5 as a module, failing to capture the fact that TF1/TF2/TF3 function as a cohesive module dominating SimC1. In the case of SimC2, the Louvain method incorrectly put TF4 into the same module of TF1-TF3. Only the TF modules of SimC3 seemed reasonable, where TF1 and TF2 were in the same module and TF3, TF4, and TF5 were in the same module. These results indicated that accurate inference of TF modules cannot be achieved by directly applying existing module detection methods to the cell type-specific GRNs.
Another widely used method for scRNA-seq data analysis is SCENIC [44], which constructs regulons for TFs and employs AUC scores to assess TFs’ activity in individual cells. Next, we compared cRegulon to SCENIC with additional expression data as input. In our formal model of cRegulon, the TF activity specificity is combined with the CSI matrix to define the final \(C\) matrix. Using the simulated scRNA-seq data, we calculated TF specificity across different cell types and input this data into cRegulon. Incorporating TF specificity allowed cRegulon to produce results that were more closely aligned with the truth. For example, cRegulon still identified that cM1 consisted of TF1, TF2, and TF3, while cM2 comprised TF3, TF4, and TF5. Moreover, the scores of TF2 and TF4 were closer to 1.0. And the scores of TF3 were more balanced between the two modules (closer to 0.5) (Fig. 2f). Additionally, with TF specificity factored in, annotation to SimC1 (0.9 cM1 and 0.1 cM2) was more consistent with the fact that it had a large strength of M1 (0.8) and small strength of M2 (0.2). This improvement was also observed from SimC3’s annotation (0.95 cM2 and 0.05 cM1), which was more consistent with a large strength of M2 (0.8) and small strength of M1 (0.2) in our simulation (Fig. 2g). Thus, incorporating TF’s specificity into cRegulon clarified TF modules and their associations with cell types. For a fair comparison, we modified the SCENIC workflow by replacing the GRN and regulon construction steps with pre-defined regulons from simulated GRNs. We then used the “AUCell” function to calculate the activity scores of these regulons in each cell, averaging the results across cell types (Fig. 2h). The resulting TF regulon activity matrix was decomposed using non-negative matrix factorization (NMF) to identify TF modules and cell types’ TF module compositions. However, the regulon-based approach did not provide as precise TF modules as cRegulon. For example, in Fig. 2i, TF2 exhibited similar scores across both rM1 and rM2, making it difficult to determine which module it belonged to. Furthermore, TF5, which should not be included in rM1, had a high score in rM1. In addition, the regulon-based method failed to accurately capture the association between cell types and TF modules, particularly in cases of cell type with mixed TF modules. As shown in Fig. 2j, the regulon-based approach incorrectly predicted that SimC2 had a two-fold higher score for rM1 compared to rM2, whereas SimC2 should have balanced contributions from both modules.
In summary, our in-silico simulation and benchmark show cRegulon’s unique advantages over existing methods in two aspects: (1) cRegulon identifies more accurate TF modules and (2) cRegulon accurately reveals the composition of TF modules in each cell type.
Benchmarking with real single cell dataTo show cRegulon can reveal better biologically meaningful regulatory units, we simulated another dataset by mixing single-cell data from four distinct cell lines—BJ (fibroblasts), H1-ESC (embryonic stem cells), K562 (erythroleukemia), and GM12878 (lymphoblastoid)—to simulate data including both similar cellular contexts (K562 and GM12878) and dissimilar contexts (BJ and H1-ESC). We intended to evaluate the ability of cRegulon to reveal biological characteristics of regulatory units and to compare its performance against alternative methods.
The application of cRegulon to this simulated dataset derived 7 cRegulons associated with 4 cell lines. Scrutinizing these 7 cRegulons (termed as M1-M7) and their association plot (Fig. 3a) with 4 cell types (Methods), we found cRegulon prioritized pivotal TFs within their respective TF modules (Fig. 3b), which had consistent functions with their associated cell types. Some cRegulons displayed specificity toward cell types. For instance, M1 was exclusively associated with K562. It featured GATA1/2 and JUN/D/B, which are well-known regulators for K562. M2 demonstrated specificity toward BJ and was marked by FOS TF family (FOSB, FOS, FOSL2). The TGs of M2 were enriched in “collagen fibril organization,” “supramolecular fiber organization,” and “epithelial to mesenchymal transition” (Additional file 2: Table S1), which were consistent with functions of BJ. M3 only exhibited association with H1-ESC, featuring NANOG and POU5F1 within its TF module [87]. M4 was specific to GM12878 and prominently showcased IRF8 and FLI1, which are important lymphocyte regulators. Conversely, some cRegulons showed shared associations across different cell types. M5 showed a marked presence of the E2F TF family—E2F5/2/6/3—known for its role in regulating the cell cycle [88]. Additionally, ESRRB, which is associated with cell cycle processes [89], also appeared as one of the top TFs within M5. M5 exhibited associations across all four cell lines, a plausible observation given the necessity of cell cycle regulation in maintaining cell lines. Similarly, M6 displayed associations with all four cell lines and a closer affinity to BJ. M6 had KLF family (KLF9/4/5/7), and its TGs also enriched in fibroblast functions and extracellular matrix organization, such as “collagen fibril organization,” “extracellular matrix organization,” and “elastic fiber assembly” (Additional file 2: Table S1). M7 encompassed the E2F1, GLI family (GLI1/2/3), and ZIC family (ZIC2/3), suggesting that M7 be involved in cell lineages in the early gastrulation [90,91,92]. M7 was also linked to cell cycle and cell division control [93,94,95,96], which make M7 to be associated with most cell lines. Overall, the functions of the modules are well aligned with those of the cell types to which they are associated with.
Fig. 3
Benchmark with real dataset by mixing four cell lines. a The association plot between 4 cell lines and 7 inferred cRegulons. The thickness of lines indicates the association score. Only association scores larger than 0.02 are plotted. b Heatmap of marker TFs’ combinatorial effect shows cRegulon can precisely capture the landmark TFs of cell types. c Comparison of averaged functional concentration for BP, CC, and MF. d Validation of TF combinations with ChIP-seq, ChIA-PET, PPI, and combined dataset. e TF module of M1, specific to K562. f The unique and validated TF combinatorial regulation in M1. The squared frame indicates predicted TF combination. Circle label indicates this TF combination can only be predicted by cRegulon, without presence in other methods’ predictions. Star indicates this TF combination is validated by TF ChIP-seq data, ChIA-PET loops, or PPI dataset of K562. g Comparison of unique-validation rate, the proportion of validated TF pairs in uniquely identified TF pairs. h Combinatorial regulatory network of GATA1 and TAL1 on NFE2. i Genomic tracks show the REs, GATA1 ChIP-seq, TAL1 ChIP-seq, and Hi-C loops that support the coregulation of TAL1 and GATA1
We next evaluated if the identified cRegulons revealed characteristics of regulatory units and made comparison with other methods. On the one hand, regulatory unit is expected to have specific functions or biological processes in the cell, and its associated TFs should show concentrated enrichment in GO terms related to those functions and processes. We used the GOSemSim package to compute the similarity of enriched GO terms as an approximation for functional concentration. From the association plot (Fig. 3a), we found M1 was specific to K562, M2 specific to BJ, M3 specific to H1-ESC, and M4 specific to GM12878. We compared GO term similarities inferred from cRegulon with cell type-specific TFs from alternative methods, including GRN, ChromVAR, SCENIC, and SCENIC + (Methods). From Fig. 3c, we observed that, on average of four cell lines, cRegulons had higher functional similarity than other methods, showing a better functional concentration characteristic of regulatory units. On the other hand, to achieve combinatorial regulation, the TFs in a regulatory module are expected to interact with each other in various ways. We used several independent datasets to validate putative interactions between pairs of TFs within a TF module. In the physical realm, TFs may cooperate or interact via co-binding at REs, chromatin loop linkages, and protein interactions. Therefore, we utilized K562 as an example and employed ChIP-seq, ChIA-PET, and PPI data to establish ground truths for co-binding, loop-connected, and protein interaction TF pairs. We also constructed a combined ground truth by integrating evidence from three resources (Methods). We compared cRegulon with 4 baseline methods (abbreviated as ChromVAR, SCENIC, SCENIC + and GRN, details in Methods). Briefly, the first three methods came from the TF module identification pipeline described in Suo et al. [80] and are based on TF activity scores computed by ChromVAR, SCENIC, and SCENIC + respectively; the fourth method directly utilized GRN TF mutual regulatory strength to identify TF modules [56, 97]. We obtained the K562’s TF combinatorial effect and calculated AUPR ratio (Methods) as metric to evaluate the accuracy of TF combinations from different methods. From Fig. 3d and Additional file 2: Table S2, only ChromVAR performs better than cRegulon in the situation of PPI, and for the other ground truth, including the combined ground truth, cRegulon performs best among the five methods. We can use Gamma distribution assumption on TF combinatorial effect and P-value 0.05 as threshold to obtain a set of TF pairs of different methods (Methods). cRegulon predicted 199 TF pairs in M1, which was specific to K562. GRN, ChromVAR, SCENIC, and SCENIC + predicted 76, 211, 138, and 234 TF pairs for K562, respectively. From Additional file 1: Fig. S3, only on for ChIA-PET, SCENIC + performs best for recall and F1 score, and for all other comparison scenarios, cRegulon is the best for precision, recall, and F1 score. TF combinations could also be inferred by combining TFs’ motif similarity with identified TFs, which can derive four additional methods: GRN + Motif, ChromVAR + Motif, SCENIC + Motif, and SCENIC + + Motif (Methods, Additional file 1: Fig. S4a). We compared cRegulon with them on K562 and found cRegulon still had the best performance (Additional file 1: Fig. S4b). These validations and comparison unequivocally established the efficacy of cRegulon model in recovering two important aspects of regulatory units: functional specificity and combinatorial regulation via TF interactions.
Many of the TF combinations detected by cRegulon are unique and not discovered by any other methods. For example, there are 78 TF combinations in the K562-specific module M1 (Fig. 3e), and 64 of them were only identified by cRegulon. And among these uniquely identified TF combinations, 14 TF pairs were validated by ChIP-seq data, ChIA-PET loop, or PPI dataset (Fig. 3f). To evaluate the ability of a method for identifying novel TF combinations, we defined its unique-validation rate as the validation rate of the set of TF pairs uniquely identified by this method (i.e., not identified by any of the other competing methods). cRegulon gave a much higher unique-validation rate (0.22) than other methods (Fig. 3g), indicating superiority in finding novel TF combinatorial regulations. We also noticed that some TF pairs were not validated because we do not have their ChIP-seq data in K562. For example, no ChIP-seq data are available for JUN and FOXL2, one un-validated but unique TF pairs of cRegulon. Additional ChIP-seq or other types of data could potentially validate these predicted TF combinations. For instance, Thomas M. Norman et al. constructed combinatorial overexpression libraries involving 112 genes and calculated a genetic interaction (GI) score to assess the epistatic effects of gene pairs [98]. Their findings revealed that the JUN-FOSL2 had a significant epistatic effect, with an absolute z-score of 1.8 for the GI score. We also observed that the TF combinations uniquely identified by cRegulon are relevant to the cancer state and erythroid state of K562. For example, the STAT5 family members (STAT5A and STAT5B) were included in M1, which are known for their roles in anti-apoptosis and tumorigenesis [99]. On the other hand, GATA1 and TAL1 are key TFs defining the erythroid identity: GATA1 is a marker of K562 [100, 101]; TAL1 is involved in myeloid cell differentiation and is a positive regulator of erythrocyte differentiation [102]. Previous studies have demonstrated a precisely organized complex formed by TAL1 and GATA1 [103] and our finding recapitulated this. In the regulatory network of K562, the regulations of TAL1 and GATA1 were largely shared (Additional file 1: Fig. S5a). TAL1 and GATA1 bound to 6720 and 15,553 REs, respectively, with 6528 REs being shared between the two TFs, yielding a Jaccard similarity of 0.41 and a significant p-value of 0.029 by permutation test. Moreover, TAL1 regulated 3018 TGs, and GATA1 regulated 6227 TGs, with a Jaccard similarity of 0.48 and a significant permutation test p-value of 0.030 among their common TGs. Among their 2991 common TGs, NFE2 emerged as one of the top co-regulated genes, and the cRegulon model provided intricate insights into the combinatorial regulatory network orchestrating the co-regulation on NFE2 by TAL1 and GATA1 (Fig. 3h). TAL1 bound to 3 REs to regulate NFE2 and GATA1 had 9 REs for NFE2, where 3 REs were shared. This combinatorial regulatory network was supported by substantial independent evidence. For example, TAL1 and GATA1 have strong protein interaction potential to form complex [104, 105]. The 3 shared REs are supported by common ChIP-seq peaks of TAL1 and GATA1 (Fig. 3i), suggesting their capability to bind to the same genomic regions for co-regulation. Additionally, for the non-shared RE, GATA1 at chr12:54,214,690–54215091 was observed to form chromatin loops with TAL1 at chr12:54,286,014–54,286,241; and chr12:54,307,044–54,307,567 of GATA1 had a chromatin loop with chr12:54,295,768–54,296,027 of TAL1 (Fig. 3i), implying that while TAL1 and GATA1 might bind to different REs connected by long-range chromatin loops. These examples illustrate the potential of detecting biologically relevant TF combinations by cRegulon.
Finally, in the Additional file 1:Supplementary Texts, we analyzed the impact of incorporating more cellular contexts into cRegulon analysis (Additional file 1: Fig. S5b-h), conducted ablation studies to show the importance of cRegulon’s components (Additional file 1: Fig. S6), designed experiments to show the robustness of cRegulon to cell clustering (Additional file 1: Fig. S7) and single-cell data that are not paired for same cell (Additional file 1: Fig. S8) and showed cRegulon’s extensiveness to study RE combinations (Additional file 1: Fig. S9).
Application to human fetal atlas reveals regulatory units decoding both spatial and temporal states of early human developmentTo assess the utility of our method in large-scale single-cell data analysis, we applied our model to the human fetal atlas with 4,979,593 scRNA-seq cells and 720,613 scATAC-seq cells. We balanced the cell numbers across different cell types using a sampling strategy [10] and obtained a dataset comprising 329,464 scRNA-seq cells and 68,944 scATAC-seq cells covering 54 distinct and well annotated cell types derived from 15 organs. From this data, our method inferred 25 cRegulons that can be used as regulatory units to elucidate the landscape of early human developmental processes (Fig. 4a).
Fig. 4
cRegulon reveals the landscape of early human development. a Application to human fetal atlas gives 25 cRegulons underpinning 54 cell types of 15 organs. b Association plot shows the relationship between 25 cRegulons and 54 cell types. The thickness of lines indicates the association score. Only cell type-cRegulon association scores that are no less than 0.1 are displayed. c The GO BP similarity scores of TFs from cRegulon, GRN, ChromVAR, SCENIC, and SCENIC +. d The GO BP similarity score of cRegulon genes (TFs + TGs) and DEGs. e cRegulons’ spatial influence shows both specificity and commonality. The y-axis is the number of associated cell types. f cRegulons’ temporal influence predicts intermediate states of excitatory neurons (x-axis, Additional file 1: Fig. S11g), which show significant and consistent differences in embryo ages (y-axis).
These 25 cRegulons, denoted as M1-M25, exhibited diverse functionalities, which might serve as modular regulatory units that could be used in different ways in different cellular contexts (Table 1). To understand the roles and functions of a cRegulon, we examined the functions of the top TFs in the module and performed functional enrichment analyses of both TFs and TGs within the cRegulon (Additional file 2: Table S3). Using this approach, M1 to M8 were seen to be predominantly associated with neural states: M1 portrayed the neural progenitor state; M2 delineated postmitotic early neurons; and M3 depicted postmitotic late neurons. Furthermore, M4 was characterized by the VAX, RAX, and VSX families, known markers for ocular and retinal development [106,107,108]; M5 was responsible for the neuroglia; M6 was related to sympathetic system; M7 and M8 were also marked by neural TFs, such as NEUROD1 and NEUROG1, and demonstrated associations with neural functions in non-CNS organs, such as the neuroendocrine and neuromuscular systems. M9 and M10 showed enrichments in pancreatic exocrine and exocrine functions, respectively. M11 (immune cells), M12 (hemopoiesis), and M13 (cytokine signals) manifested functionalities associated with hematopoietic and immune roles. Additionally, M14 (muscle organ development) and M15 (muscle structure) were distinctive to muscular states. The spectrum of functions encompassed by M16-M22 spanned mesodermal and endodermal organs: M16 and M17 included a cluster of HOX genes linked to anterior–posterior patterning of internal organs and skeletal muscles, respectively; M18 was associated with liver functions, including lipid and glucose homeostasis as well as transport activity; M19 with kidney development; M20 with adrenocortical functions; M21 with placental functions and M22 with angiogenesis in the cardiac system. Finally, three cRegulons were identified to be associated with epi-endothelial functions, namely M23 and M24 responsible for epithelial transport and structure, and M25 enriched in endothelial tissues.
Table 1 Twenty-five cRegulons for human fetal atlas, as well as their top TFs and enriched biological functionsThe association analysis between 25 cRegulons and 54 cell types portrayed a comprehensive landscape of early human development. UMAP visualization based on the cRegulon annotation vectors of the cell types revealed that cRegulons effectively recapitulated both anatomical and functional classifications (Fig. 4b, Additional file 1: Fig. S10a). For instance, neural, retinal, and glial cell types, constituting the central nervous system, were governed by M1-M5, aligning well with their neural functionalities. The peripheral nervous system, encompassing ENS neurons, ENS glia, Schwann cells, sympathoblasts, and chromaffin cells, was clustered together. M6, which was a cRegulon specific to the sympathetic system, controlled this system: M6 had strong association scores (> 0.3) with sympathoblasts and chromaffin cells (Fig. 4b); and it also had associations (> 0.01) with ENS neurons, ENS glia, and Schwann cells (Additional file 2: Table S3). Additionally, hematopoietic cell types and immune cell types clustered closely due to their association with M12 and M13, indicative of hematopoiesis and immune functions. Muscular cell types showed close associations owing to the annotation of M14 and M15, dedicated to muscular states. Similarly, the association of cell types with meso-endoderm cRegulons (M9/10/18/19) demonstrated the diverse functions observed in pancreas, liver, stomach, and intestine cell types. Epithelial cell types, such as intestinal epithelial cells, bronchiolar-and-alveolar epithelial cells, and ciliated epithelial cells, were together and governed by M23 and M24. Notably, endothelial cell types and mesenchymal cell types shared closer relationships mainly governed by M25, M22, M16, and M17. M25 and M22 tended to be responsible for endothelial functions, while M16 and M17 were more related to anterior–posterior pattern. This distribution of cell types was consistent with the previously published human fetal atlas [10], wherein our model further revealed the cRegulons as the underlying functional units contributing to the early human developmental landscape.
The annotation by cRegulon can capture specific characteristics of cell types. We hypothesized that the genes in a good functional annotation should have strong concentration in functional enrichment, which means genes are enriched in GO terms that are closely placed in the GO hierarchy. GOSemSim [109] can evaluate the similarities of associated GO terms for genes to access their concentration in functional enrichment. Using GOSemSim (Methods), we first compared the functional enrichment concentration of TFs in cRegulon with TFs inferred by GRN, ChromVAR, SCENIC, and SCENIC +. We found that cRegulon TFs exhibited a higher concentration of functional enrichment than TFs from other methods across biological pathways (BP, Fig. 4c), cellular components (CC, Additional file 1: Fig. S11a), and molecular functions (MF, Additional file 1: Fig. S11b). Next, we compared the entire gene sets of cRegulon (TFs and TGs) with gene sets inferred by differential expression (DEG genes). In the biological process hierarchy of GO, cRegulon genes showed significantly higher concentration than DEGs across every cell type (Fig. 4d, Additional file 1: Fig. S11c). Similarly, for CC and MF, cRegulon also exhibited higher functional similarity scores compared to DEGs (Additional file 1: Fig. S11d, e). This observation underscores cRegulon’s superior concentration of functional enrichment compared to conventional methods. The enhanced functional enrichment annotation of cRegulon can be further demonstrated in detail in the following two examples. In the first example, we examined the association score of hematopoietic stem cells (HSCs) and found that it is strongly annotated with M12. We checked the functional enrichment of M12’s top 20 TFs in its TF module and top 200 TGs. M12 was enriched in many immune and hematopoietic pathways, such as “erythrocyte differentiation,” “eosinophil differentiation,” “myeloid cell apoptotic process,” and “negative regulation of myeloid cell apoptotic process” (Additional file 2: Table S4). However, in the top enriched pathways of HSCs’ top 200 DEGs, no immune terms were found. For top 20 TFs identified by ChromVAR, we observed one immune cell associated pathway: “negative regulation of erythrocyte differentiation”. For top 20 TFs identified by SCENIC, only one pathway (“definitive hemopoiesis”) was consistent with the cell type’s functions. For the top 20 TFs identified by SCENIC +, there are no enriched immune pathways. In the second example, we examined the annotation of Syncytiotrophoblasts-and-villous-cytotrophoblasts (SVCs) and found that this cell type was only associated with M21. M21’s Top 20 TFs and Top 200 TGs were enriched in “embryonic placenta development,” “positive regulation of fat cell differentiation,” and epithelial functions (“epithelial cell maturation” and “mammary gland epithelial cell differentiation”) (Additional file 2: Table S5), which were highly relevant functions of placenta cell type SVCs. In contrast, the other methods resulted in much less relevant functional enrichment: DEG and SCENIC analysis led to enrichment only in fatty acid associated functions; ChromVAR and SCENIC + failed to reveal any functions related to placental development. These comparisons demonstrate that cRegulon provides more specific functional annotations than alternative methods.
The 25 cRegulons exhibited different degrees of specificities in their association with cell types. Figure 4e provided a ranking of these cRegulons based on the number of their associated cell types showing their diverse ranges of impacts. Some cRegulons were specific to only one or two cell types, signifying their usage was highly cell-type-specific. For instance, M5, with neuroglial functions, exhibited specificity toward astrocytes; M19 was exclusively present in “PAEP MECOM positive cells,” thereby linking this cell cluster with nephritic functions. In contrast, some cRegulons were associated with multiple cell types, but were limited to certain organs or tissues. For instance, M1 was associated with 13 cell types, all exclusively neural; M21 was linked to 12 cell types, predominantly placental. Moreover, most enriched cell types for M9, M24, and M12 were from pancreas, stomach, and immunity, respectively. Finally, there were some cRegulons (such as M25, M16, and M17) that have very low degree of cell-type-specificity. They were associated with a minimum of 1/4 of the cell types, spanning many organs (9 organs for M17, and 4 for M16, Fig. 4b, e, Additional file 1: Fig. S10b). This indicated their spatially broader influence on human embryos compared to other cRegulons. Examination of their top 50 TFs revealed that all three cRegulons featured a set of HOX genes (Additional file 1: Fig. S11f), known for their multifaceted roles in early development [110], potentially explaining the wider cell type associations of M25, M16, and M17 (Fig. 4b).
Some of the cRegulons from the human fetal atlas are informative on developmental stages. We considered the cRegulon M1 as an example, which was broadly associated with all neuron cell types (Fig. 4b). Since M1 was enriched in progenitor functions, we attributed its broad associations to the presence of progenitors in the various neural cell types. To validate this hypothesis, we examined the excitatory neurons, which were strongly associated with M1 (Fig. 4b, Additional file 1: Fig. S10a). To reveal the early and intermediate role of M1, we categorized excitatory neurons into early, middle, and late groups based on their M1 and M3 association (Methods, Additional file 1: Fig. S11g). Subsequent observation revealed that the early group cells exhibited the smallest developmental age of the fetal samples, the middle group featured intermediate age, and the late group displayed the largest age, demonstrating significant differences among these groups by t-test analysis (Fig. 4f). These findings underscored the capacity of our model in identifying regulatory units relevant to developmental stages.
cRegulons from human fetal atlas provide useful annotation for new cell subtypesThe panel of regulatory units from atlas-scale dataset can be used to facilitate precise annotations for cell types from new datasets. This annotation further allows us to compare the cell type/state by revealing differential TF modules and cRegulon compositions. Such analysis should be conducted in biologically (e.g., developmental divergence) and technical (e.g., dataset heterogeneity) relevant dataset. Given that human fetal and adult β cells exhibit high conservation of core transcri
Comments (0)