EpiCHAOS provides a quantitative metric of cell-to-cell epigenetic heterogeneity, complementing single-cell epigenomics studies of cancer and development. We have shown that epiCHAOS offers an excellent approximation of stemness and plasticity in various developmental contexts, as well as in cancer. Comparison of epiCHAOS scores at different genomic regions highlighted increased heterogeneity of polycomb targets and developmental genes. EpiCHAOS is applicable to a variety of single-cell epigenomics data types including measurements of chromatin accessibility, DNA methylation, and histone modifications.
MethodsCalculating epiCHAOS scores
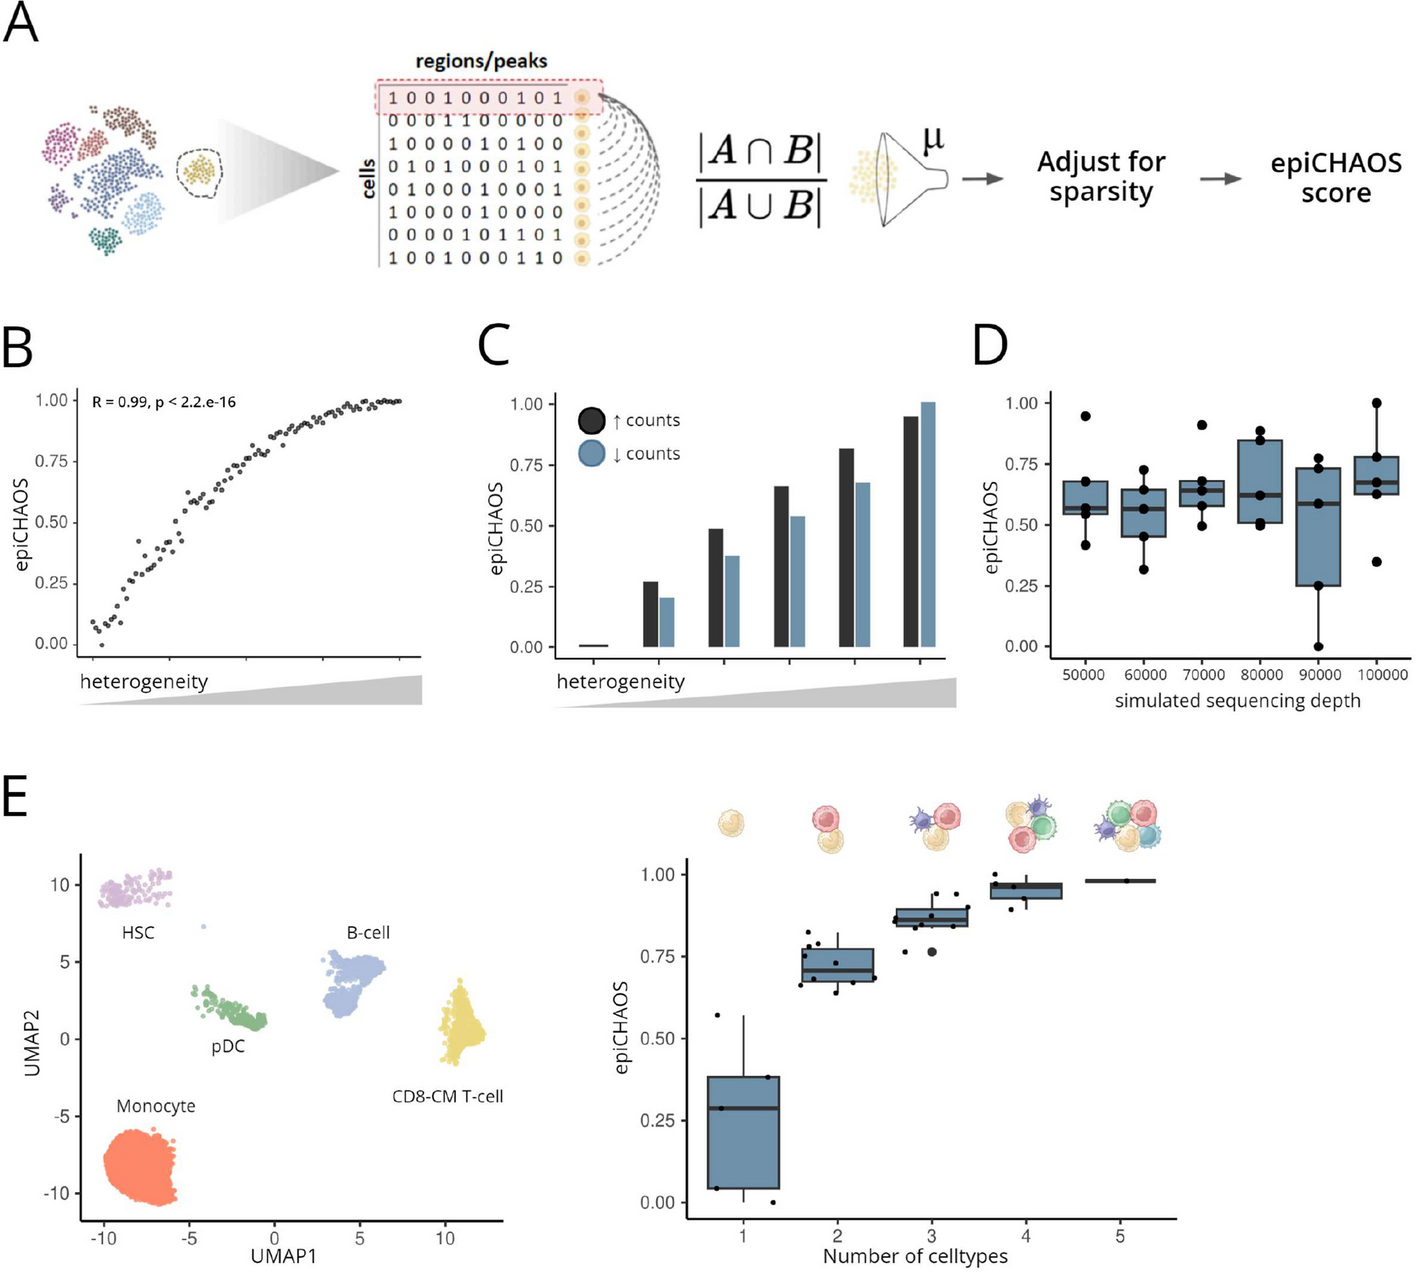
Heterogeneity scores were calculated for each given cluster or otherwise defined group of cells using a binarized matrix of scATAC or other single-cell epigenomics data. First pairwise distances were calculated between all cells within the cluster using a chance-centered version of the Jaccard index which controls for differences in the relative number of ones and zeros [26]. Afterwards, the mean of all pairwise distances per cluster was computed. To remove any further effect of sparsity a linear regression model of the raw heterogeneity scores was fitted against the total number of detected accessible peaks, averaged across cells in the respective cluster, and the residuals of this model were taken as the adjusted scores. Finally, the scores were transformed to an interval of 0–1, and subtracted from 1 to convert the similarity metric to a distance metric.
ScATAC-seq data from the Hep-1 liver cancer cell line [50] was used to test whether epiCHAOS scores correlate with measures of technical noise. Cells were stratified into bins (20 bins of 100 cells each) based on various quality control metrics: FRIP scores, TSS enrichment scores, and nucleosome ratio, which were calculated using ArchR [51].
DNA CNAs were inferred in the Hep-1 cell line using epiAneuFinder [52] with a windowSize = 100,000 and minFrags = 20,000. To investigate the influence of CNAs on epiCHAOS scores, the most prominent examples of large subclonal copy number gains (gain on chromosome 5) and deletions (deletion on chromosome 13) were selected by visual inspection, and cells were stratified based on the presence or absence of each alteration. EpiCHAOS scores were calculated across peaks in the affected chromosome and compared between cells with diploid or alternative states. To correct for CNAs when applying epiCHAOS to cancer datasets, a per-chromosome count-corrected epiCHAOS score was derived, where epiCHAOS scores were calculated per chromosome, implementing a linear regression-based adjustment for the total coverage on that chromosome, and then the average of per-chromosome scores was taken as the global epiCHAOS scores.
Unless otherwise specified, epiCHAOS was calculated using the entire peaks-by-cells matrix. To allow a more robust comparison between groups, epiCHAOS scores were calculated on five random subsamples of 100 cells from each group/cluster, except in groups/clusters which contained fewer than 100 cells. Since the scNMT-seq data contained fewer than 100 cells in most groups, epiCHAOS scores were calculated only once for each cell type. ENCODE Transcription Factor Binding Site (TFBS) regions from the LOLA core database [53] were used for comparisons of heterogeneity at different genomic regions, for which scATAC peaks matrices were subsetted to obtain peaks overlapping with each genomic region. Similarly, for comparisons across gene sets, data were subsetted for peaks overlapping with promoters of each gene set using the GO:BP gene sets from MsigDB [54].
Generating synthetic datasets with controlled heterogeneity
To test the performance of epiCHAOS, synthetic datasets were generated in silico in a way that simulates the structure of binarized scATAC-seq peak matrices. First, a series of 100 synthetic datasets with controlled heterogeneity was created, in which each dataset has an equal total count. To do this a random binary matrix was created, which would represent the first dataset in the series. In each subsequent dataset, homogeneity was incrementally introduced by removing a set number of 1’s from selected n rows and adding them to different selected n rows, in such a way that a constant number of 1’s is maintained, while heterogeneity decreases.
To test situations where the genome-wide chromatin accessibility is increasing or decreasing, binarized data from an example scATAC-seq dataset were perturbed to create datasets of increasing heterogeneity with either addition or removal of 1’s. Specifically, 10, 20, 30, 40, and 50% of 1’s were selected at random and replaced by 0’s, and corresponding numbers of 0’s were selected at random and replaced by 1’s.
To test that epiCHAOS is not influenced by differences in sparsity, a series of 100 random binary datasets was generated with each dataset having equal dimensions and incrementally increasing the total number of 1’s. Their epiCHAOS scores were then computed and tested for a correlation with their total count.
As an additional validation approach, semi-synthetic scATAC-seq datasets were created by mixing data from distinct cell types. Using scATAC-seq data from human bone marrow [28], five cell types were selected: HSCs, monocytes, CD8-CM T cells, B-cells, and plasmacytoid DCs. The top 500 differentially accessible peaks for each cell type were identified and used to create in silico mixtures of two to five cell types in all possible combinations.
Simulating scATAC-seq data with varying sequencing depth
The scReadSim package was used to simulate scATAC-seq data of varying sequencing depths [27]. A subset of scATAC-seq data from HSCs from the Granja et al. dataset was used as input [28]. Data were reduced to 10,000 randomly selected peaks for ease of processing. Simulated scATAC-seq matrices comprising each 500 cells were generated with sequencing depth ranging from 50,000 to 100,000 counts, in increments of 10,000. EpiCHAOS scores were calculated across matrices on five subsamples of 100 cells from each condition.
scATAC-seq data processing and analysis
Publicly available scATAC-seq datasets for human hematopoiesis [28], mouse gastrulation [30], drosophila embryogenesis [55], breast cancer [13], liver cancer [34], ependymoma [36], HSC aging [39], and liver cancer cell lines [50] were downloaded from the respective publications. For analyses in developmental datasets and in ependymoma processed counts matrices were used as provided by the authors, where cell types were previously annotated. For breast and liver cancer datasets fragments files were downloaded, processed, and analyzed using ArchR [51]. Cells with TSS enrichment scores less than 4 or a number of fragments higher than 1000 were removed, and doublets were filtered out using default parameters. Iterative LSI was performed followed by clustering using the Seurat method. Gene score matrices were generated using ArchR and used for subsetting cancer datasets for epithelial cells based on epithelial cellular adhesion molecule (EPCAM) scores. After reclustering epithelial cells, peak calling was performed using macs2 [56]. To assign gene set/pathway scores to each cluster, gene set annotations were obtained from MSigDB using the msigdbr R package [54]. Gene scores were first averaged across all cells within each cluster, and then the mean score of all genes within a given gene set was computed to assign gene set scores per cluster.
Differential heterogeneity analysis
Differential heterogeneity analyses were performed for each region using a permutation approach, whereby the difference in epiCHAOS scores between two selected cell types was compared with that between pairs of 1000 randomly computed groups sampled from the same pool of cells. P-values were calculated as the quantile of the distribution of sampled permutations for which the difference in heterogeneity scores was greater than that between the two test groups.
DNA methylation variation
Enhanced reduced representation bisulfite sequencing data (ERRBS) from Adelman et al. [57] was used to calculate DNA methylation variability by computing variance per CpG site in HSC-enriched lineage-negative (Lin − CD34 + CD38 −) samples across the eight male donors. To address the issue of data sparsity, a maximum quantile threshold of 0.005 was established for missing values per site. Any sites that surpassed this threshold were removed. For each ENCODE TFBS, the average of variances was calculated for all CpG sites overlapping with the respective regions.
scRNA-seq analyses
Publicly available scRNAseq datasets for human hematopoiesis [28], mouse gastrulation [30], and drosophila embryogenesis [55] were downloaded from the respective publications and analyzed using Seurat. Cell-to-cell transcriptional heterogeneity was calculated by computing pairwise Euclidean distances according to the methods of Hinohara et al. [19]. Developmental potential was calculated per cell using CytoTRACE [33] and assigned as a mean per cell type for downstream analyses. Transcriptional noise per gene was estimated using the coefficient of variation as previously described [58]. A list of PRC2-target genes used for comparison of transcriptional noise was obtained from Ben-Porath et al. [59].
scCHIP-seq analysis
scCHIP-seq counts matrices representing 50 kb non-overlapping bins of H3K27me3 from human breast cancer patient-derived xenograft cells that were sensitive or resistant to Capecitibine (HBCx-95 and HBCx-95-CapaR) were downloaded from GSE117309 and processed as described by Grosselin et al. [45]. Cells having a total number of unique reads in the upper percentile were removed as outliers, and genomic regions not represented in at least 1% of all cells were filtered out. Data corresponding to non-standard chromosomes and the Y chromosome were excluded. Cells with a total number of unique reads less than 1600 were removed. Counts matrices were binarized and cells from each condition were subsampled to select ten groups of 100 cells each for epiCHAOS calculation.
scNMT-seq and scTAM-seq analysis
scNMT-seq DNA methylation and ATAC data from mouse gastrulation [42], summarized across promoters, gene bodies, and CpG islands, were accessed using the SingleCellMultiModal R package. scTAM-seq data from mouse hematopoiesis were obtained from Scherer et al. [44], downloaded from https://figshare.com/ndownloader/files/42479346, and analyzed using Seurat.


Comments (0)