
Remember me

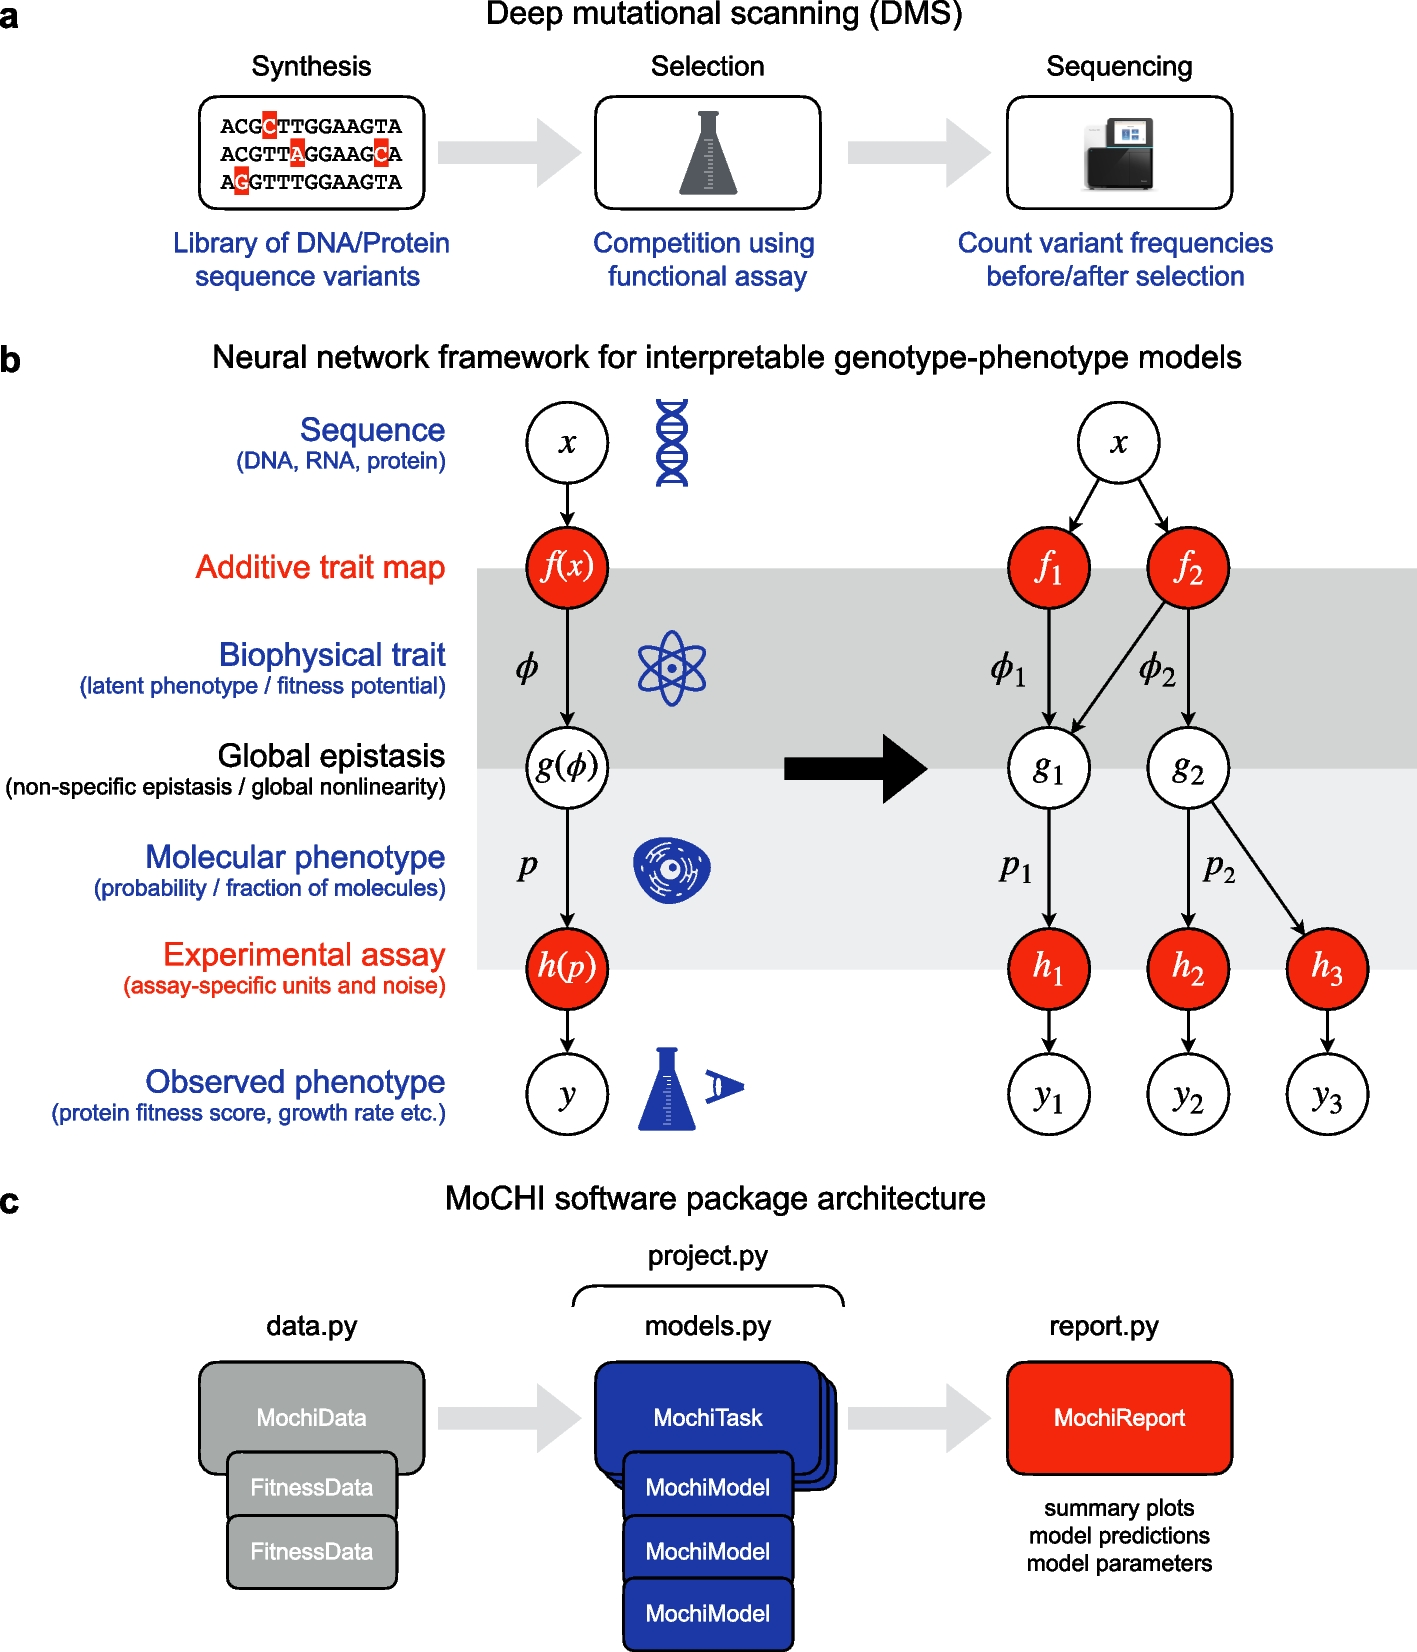
MoCHI uses the data generated by DMS experiments to learn simple models that accept a genotype sequence \(x\) (DNA, RNA, protein) as input and output a quantitative phenotypic prediction \(\widehat = F(x)\) (enrichment ratio, growth rate, cellular fluorescence etc.; Fig. 1b). In contrast to DL models, the inferred parameters of the model \(F\) are directly interpretable.
In the simplest scenario, the effects of single nucleotide/AA substitutions in the wild-type (reference) sequence contribute independently to the final prediction. In other words, when single mutant effects are additive in multi-mutants, the phenotypic score of an arbitrary sequence variant \(i\) (of any mutational order) relative to the wild-type sequence is simply the sum over nucleotide- or residue-specific effects. This assumption is implicit in a linear model where variant sequences are one-hot encoded and the phenotypic effects of single substitutions correspond to the coefficients of the model.
However, there are two main reasons why such naïve models tend to perform poorly at the task of accurately predicting quantitative scores from DMS experiments. First, results from empirical work suggest that pairwise (and possibly higher-order) genetic interactions are abundant in biological sequences [34,35,36]. The mechanistic origins of specific epistasis—where the effect of a given mutation depends on the specific genetic background in which it occurs—is an active field of research, but there is evidence that it is enriched between sequence positions involved in physical interactions [29,30,31, 37].
Second, the relationship between the biophysical effect of a mutation and the measured (observed) phenotype is typically nonlinear. Sources include the thermodynamics of protein folding and binding as well as the cooperativity and competition of molecular interactions such as transcription factors with DNA. Molecular phenotypes often have finite upper and lower limits, for example the quantitative level of inclusion of an alternatively spliced exon in an mRNA transcript can only occur in the range 0–100% [38]. In addition, many experimental phenotypes such as cellular growth, fluorescence intensity, gene expression level, and metabolic flux are subject to analogous upper and lower limits [26]. The consequence of these nonlinearities is that the phenotypic outcome of the sum of mutation effects at the biophysical level is not equal to the sum of their individual phenotypic effects. This “surprise” outcome of mutations—based on their magnitudes and the parameters affected but not their specific identities—is known as global epistasis or non-specific epistasis. Technical nonlinearities in the relationship between a molecular phenotype and observations thereof can also be introduced by the experimental measurement process itself [39]. Regardless of its source, it is important to properly account for global epistasis as it can dramatically improve model performance, generalizability, and interpretability, reducing the number and type of genetic interaction terms (model features/variables) required to explain phenotypic effects, a phenomenon referred to as phantom epistasis [38].
MoCHI allows the explicit simultaneous modeling of these two types of epistasis (global and specific) by formulating the genotype–phenotype map \(F(x)\) as a graph consisting of sequential transformations. In the additive trait map \(f(x)\), the effects of individual mutations and mutation combinations (genetic interactions) combine additively at the energetic level. The resulting sum or inferred biophysical trait \(\phi = f(x)\) can be interpreted in some models as the total Gibbs free energy of the system [5,6,7, 12, 15, 16]. However, as this quantity is typically unobserved, it is also commonly referred to as the latent phenotype or fitness potential (Fig. 1b, left). Importantly, \(f\) maps sequences to an unbounded physical quantity \(\phi\) representing the ultimate mechanistic basis of mutation effects, and therefore its parameters can provide deep insight into the system under study.
The molecular phenotype \(p =g(\phi ) = g(f(x))\) is modeled as a nonlinear transformation of the biophysical trait \(\phi\) and represents how changes at the energetic level affect the probability of molecular events, for example the fraction of molecules in a given state (folded, bound, cleaved, spliced, etc.). The mathematical formulation of the function \(g\) is either determined a priori or it can be estimated directly from the data, an approach termed global epistasis (GE) regression originally developed in the evolution literature [27, 28, 39, 40] and increasingly implemented using neural networks [7, 17, 18, 20].
Finally, the observed phenotype \(y = h(p) = h(g(f(x)))\) is modeled as an affine transformation (two parameter scale and shift) of the molecular phenotype \(p\). The key assumption here is that the DMS experimental assay provides a quantitative score for each variant that is linearly correlated with the molecular phenotype of interest albeit on a different scale or arbitrary units. Therefore, \(h\) simply represents a conversion between these two unit systems. In order to account for the uncertainty in experimental measurements, MoCHI applies an empirical noise model by weighting the objective function with experimental error estimates when available.
A key advantage of MoCHI is the graph-like nature in which custom genotype–phenotype models are implemented as neural networks permitting an arbitrary number of measured phenotypes to report on an arbitrary number of inferred additive traits (Fig. 1b, right). Practically, this allows models to be fit simultaneously to multiple DMS datasets that result from assaying/phenotyping the same (or overlapping) variant libraries. For example, the architecture in the right panel of Fig. 1b describes two related molecular phenotypes \(_\) and \(_\), where each is assumed to be a different nonlinear function of two underlying biophysical traits (\(_\) and \(_\)) as determined by the global epistasis functions \(_(_,_)\) and \(_(_)\). Furthermore, the molecular phenotype \(_\) is assayed independently in two separate experiments, as denoted by \(_\) and \(_\), where any systematic (linear) differences between the resulting scores are captured in the inferred parameters of the transformations \(_\) and \(_\), thereby obviating the need for any explicit inter-experiment normalization prior to modeling.
MoCHI is implemented as a python package and relies on the PyTorch machine learning framework for model inference (Fig. 1c), with a “no-coding” option provided via a command-line tool. The package is divided into modules for DMS data management (sequence feature extraction, definition of cross-validation groups), learning tasks (model architecture definition, hyperparameter tuning and fitting), and reporting of results (model performance and diagnostics). A fourth module handles project workflows involving multiple learning tasks including sparse model inference. In what follows, we provide examples of MoCHI’s functionality on various empirical datasets.
Fitting biophysical models to DMS data with MoCHIAlthough DMS involves perturbations of biomolecules at the biophysical level (by varying their sequences), functional assays of mutant effects typically involve the quantification of a convenient proxy (e.g., fluorescence score) or higher-level phenotype (e.g., cell growth rate, Fig. 1b). Mechanistic models that explicitly take into account the global nonlinear relationship between the measured (observed) phenotype and the biophysical basis of mutation effects have advantages over both linear models in terms of generalizability and DL models in terms of interpretability.
Although MoCHI imposes no restrictions on the choice/definition of the global epistasis function, equilibrium thermodynamic models provide a useful approximation of protein states under natural conditions. At thermal equilibrium, the Boltzmann distribution relates the probability that a system will be in a given state \(k\) to the (Gibbs) free energy \(_\) of the state and the temperature of the system \(T\):
where \(Z=_^^_/RT}\) is the partition function—with the summation over all possible states \(M\) (e.g., distinct protein conformations and/or interactions)—and R is the gas constant. We first consider the simplest possible thermodynamic model of protein binding, i.e., a two-state unbound/bound model, where we denote the sum of energies of all possible unbound states with the reference value of zero (i.e., \(_=0\)), the fraction of molecules in the bound state is then:
$$_ = \frac^_}}} = \frac^_}}}$$
where \(Z=1+^_}}\) and \(\Delta _\) is the energy difference between unbound and bound states. Importantly, \(\Delta _\) implicitly depends upon the AA sequence. Figure 2a summarizes the experimental details of a DMS study in which mutations were introduced in FOS and JUN amino acid sequences, two disordered proto-oncoproteins that interact through their leucine zipper domains forming the AP-1 transcription factor complex upon heterodimerization [41]. In leucine zippers, like FOS and JUN, dimerization occurs through the formation of an alpha-helical coiled coil in a two-state process, i.e., the proteins fold upon binding and there exists no significant population of structured monomers [42, 43] (Fig. 2a). The effects of mutation combinations on protein binding were quantified by “BindingPCA” (bPCA), a method in which the proximity of two fragments of a reporter enzyme (DHFR) that are fused to the two respective proteins under study is coupled to yeast cell growth.
Fig. 2
Fitting biophysical models to DMS data with MoCHI. a Library design and yeast growth-based functional assay used to interrogate the effects of single AA substitutions on the heterodimerization of FOS and JUN via BindingPCA (bPCA) [41]. Red cross, yeast growth defect; DHF, dihydrofolate; THF, tetrahydrofolate. b Library design and mRNA display-based in vitro assay used to interrogate the effects of all single and double AA substitutions in the IgG-binding domain of protein G (GB1) [31]. c, d Two- and three-state equilibria, thermodynamic models, neural network architectures, and corresponding MoCHI model design tables used to infer the binding and folding free energy changes (∆∆Gf, ∆∆Gb) of the mutant libraries depicted in panels a and b, respectively. ∆Gb, Gibbs free energy of binding; ∆Gf, Gibbs free energy of folding; Kb, binding equilibrium constant; Kf, folding equilibrium constant; c, standard reference concentration; pb, fraction bound; g, nonlinear function of ∆Gb (panel c) or ∆Gf and ∆Gb (panel d); R, gas constant; T, temperature in Kelvin. e Nonlinear relationship (global epistasis) between observed BindingPCA fitness and inferred changes in free energy of binding. Thermodynamic model fit shown in red. f Performance of two-state biophysical model. R2 is the proportion of variance explained. g Nonlinear relationship between observed mRNA display fitness and inferred changes in free energies of binding and folding. h Performance of three-state biophysical model. i Violin plots showing the distributions of binding free energy changes for mutations in different structural/heptad positions in the FOS-JUN heterodimer (see legend). j Comparisons of confident model-inferred free energy changes to previously reported in vitro measurements [31, 44]. Error bars indicate 95% confidence intervals from a Monte Carlo simulation approach (n = 10 experiments). Pearson’s r is shown
Figure 2c indicates a particular instance of the general genotype–phenotype framework (Fig. 1b), where a neural network is used to fit a two-state thermodynamic model (Fig. 2c, global epistasis function, \(g\)) to the bPCA data (Fig. 2c, bottom, target variable, \(y\)), thereby inferring the causal changes in free energy of binding (Fig. 2b, left inset, weight coefficients) associated with single AA substitutions (Fig. 2c, top, input values, \(x\)). Importantly, we assume that these energies are additive, meaning that the total free energy change (\(\Delta \Delta G\)) of an arbitrary variant \(i\) (of any mutational order, e.g., double mutant) relative to the wild-type sequence is simply the sum over residue-specific energies (\(\Delta \Delta g\)) corresponding to all constituent individual (i.e., lowest order) AA changes:
$$\Delta \Delta _=_^\Delta \Delta _}$$
where \(\Delta \Delta _\) denotes the binding free energy change of constituent single AA substitution \(j\) of variant \(i\) relative to the wild type. We can therefore express the absolute (rather than relative) free energy of binding of an arbitrary variant \(i\) as:
$$\Delta _=\Delta _}+_^\Delta \Delta _}$$
where \(\Delta _\) is the binding free energy of the wild type.
The only configuration information strictly required to run MoCHI is a plain text model design file that defines the neural network architecture, and which additionally includes a path to the pre-processed DMS data for each observed phenotype (table rows), including fitness and empirical error estimates as provided by tools such as Enrich2 [45], DiMSum [46], mutscan [47], or Rosace [48] (see the “Methods” section). MoCHI conveniently handles all low-level data manipulation tasks required for model fitting including the definition of training-test-validation data splits and 1-hot encoding of sequence features from AA sequences. By default, MoCHI optimizes the trainable parameters of the neural network using the PyTorch machine learning framework and stochastic gradient descent on a loss function based on a weighted and regularized form of mean absolute error (see the “Methods” section). Optionally, the user can restrict model fitting to randomly downsampled subsets of the data and/or variants of a given mutation order, an example of which is presented in Extended Data Fig. 3a of Ref. [15]. Model coefficients can also be randomly downsampled. MoCHI estimates the confidence intervals of model-inferred coefficients and free energies using a Monte Carlo simulation approach (see the “Methods” section).
Fig. 3
Fitting biophysical models to DMS data assaying mutant effects on multiple phenotypes. a Library design and doubledeepPCA (ddPCA) functional assays (BindingPCA, bPCA and AbundancePCA, aPCA) used to interrogate the effects of all single and a subset of double AA substitutions on the cellular abundance and binding of PSD95-PDZ3 to its cognate ligand (CRIPT) [15, 16]. Green tick mark, yeast growth; red cross, yeast growth defect; DHF, dihydrofolate; THF, tetrahydrofolate. b Identical to panel a except ddPCA was applied to the oncoprotein KRAS to interrogate the effect of mutations on interactions with six different binding partners [15]. c, d Three-state equilibria, thermodynamic models, neural network architectures, and corresponding MoCHI model design tables used to infer the binding and folding free energy changes (∆∆Gf, ∆∆Gb) of the mutant libraries depicted in panels a and b, respectively. Target variable predictions for the three library blocks assaying KRAS-RAF1 bPCA are depicted; the additional 15 (5 × 3) observed phenotypes corresponding to the other 5 binding partners are not shown for simplicity. ∆Gb, Gibbs free energy of binding; ∆Gf, Gibbs free energy of folding; Kb, binding equilibrium constant; Kf, folding equilibrium constant; c, standard reference concentration; pb, fraction bound; pf, fraction folded; gf, nonlinear function of ∆Gf; gfb nonlinear function of ∆Gf and ∆Gb; R, gas constant; T, temperature in Kelvin. e Nonlinear relationship between observed bPCA fitness and inferred changes in free energies of binding and folding. Thermodynamic model fit shown in red. f Performance of three-state biophysical model predictions of bPCA fitness. R2 is the proportion of variance explained. g, h Similar to panels e and f but corresponding to KRAS-RAF1 bPCA fitness for block 1. i Nonlinear relationship between observed aPCA fitness and inferred changes in free energy of binding. j Performance of two-state biophysical model predictions of aPCA fitness. k, l Similar to panels e and f but corresponding to KRAS aPCA fitness for block 1. m, n Comparisons of confident model-inferred free energy changes to previously reported in vitro measurements [49,50,51]. Error bars indicate 95% confidence intervals from a Monte Carlo simulation approach (n = 10 experiments). Pearson’s r is shown
This extremely simple thermodynamic model provides an excellent fit to the FOS-JUN data, faithfully capturing the nonlinear relationship (global epistasis) between changes in binding free energy and the observed phenotype scores (Fig. 2e) and explaining nearly all of the variance in bPCA fitness (Fig. 2f, R2 = 0.94 on held out test data), strongly supporting the assumption that most changes in free energy of binding are additive in double amino acid substitutions. Plotting the distributions of binding free energy changes separately for residues in the core, solvent-exposed surface (far side) and salt bridge positions shows that mutations in core positions comprising the hydrophobic binding interface between FOS and JUN subunits tend to have strongly destabilizing effects as expected (Fig. 2i). Salt bridge positions are also more biased towards disrupting binding than far side mutants, consistent with their structural role in stabilizing the heterodimer (Fig. 2i).
These results show that MoCHI can fit simple mechanistic models to DMS data, but to what extent do they reflect biophysical reality? How accurate are the MoCHI-inferred free energy changes? We address this question using previously published in vitro DMS data for the binding of nearly all single and double amino acid substitutions of protein G domain B1 (GB1) to IgG-Fc [31, 44] (Fig. 2b). For globular proteins like GB1, protein binding can be most simply modeled as a three-state equilibrium with unfolded, folded, and bound energetic states, where mutations can alter the concentration of the bound complex via their effects on fold stability, binding affinity, or both (Fig. 2d). The probability of the unfolded and bound state is assumed to be negligible. Although many different combinations of folding and binding free energy changes could in theory result in the same observed binding phenotype of a particular variant, the high depth of double mutant data (singles measured in different genetic backgrounds) allows biophysical ambiguities to be resolved [1, 52].
The three-state thermodynamic model fit by MoCHI accurately predicts the binding fitness of double mutants held out during training (R2 = 0.94, Fig. 2g, h), again suggesting that mutation effects overwhelmingly combine additively at the energetic (biophysical trait) level. We also find excellent agreement between the MoCHI-inferred folding free energy changes and in vitro measurements [31, 44] (Pearson’s r = 0.8–0.92, Fig. 2j), similar to previous analyses [7, 52].
Multimodal DMS dataThe architectural flexibility of neural networks is a major advantage when dealing with more complicated DMS experimental designs. MoCHI can easily be configured to fit models to multiple DMS datasets reporting on the same or related phenotypes in which different or partially overlapping variant libraries are assayed.
We have shown previously that an approach called “multidimensional mutagenesis”—whereby the effects of mutations are quantified for multiple molecular phenotypes and in multiple genetic backgrounds—is an efficient experimental strategy to infer en masse the causal biophysical effects of mutations [15, 16]. In a similar way that double mutants are useful to constrain mechanistic models [52] (Fig. 2), measuring the effects of mutations on multiple phenotypes helps to disentangle the underlying free energy changes [1].
In Fig. 3, we summarize the results of applying a specific implementation of this approach (doubledeepPCA or ddPCA) to map the energetic and allosteric landscapes of two well-studied proteins. The effects of all singles and a “shallow” subset of double AA substitutions were quantified on binding and intracellular concentration of the free proteins using bPCA and a second related assay (AbundancePCA, aPCA) in which only one of the interacting proteins is expressed, with the other DHFR fragment being highly expressed (Fig. 3a,b). In aPCA, functional DHFR is reconstituted by random encounters, and yeast growth is proportional to the intracellular concentration of the fusion protein over more than three orders of magnitude [53]. Whereas mutations destabilizing either binding or folding result in a growth defect in bPCA, only those affecting fold stability are detrimental to cell growth in aPCA (Fig. 3a, b).
The experimental design, thermodynamic model, and neural network architecture corresponding to ddPCA applied to the third PDZ domain from the adaptor protein PSD95 (also known as DLG4) binding to the C-terminus of the protein CRIPT is depicted in Fig. 3a, c [15]. In MoCHI, additional measured phenotypes are configured by simply adding extra rows in the model design file, in this case specifying a neural network architecture where mutation effects on folding free energy are captured in a single shared biophysical trait (\(\Delta _\)) that underlies predictions of both aPCA and bPCA fitness scores (Fig. 3c). ddPCA was subsequently applied to assay the effects of > 26,000 mutations in the oncoprotein KRAS on abundance and binding to six different interaction partners: three KRAS effector proteins RAF1, PIK3CG, and RALGDS, the guanine nucleotide exchange factor (GEF) SOS1, and two DARPins, K27 and K55 [16]. KRAS mutagenesis libraries were constructed in three consecutive partially overlapping blocks along the full protein sequence and each assayed independently by aPCA and bPCA resulting in a total of \(7\times 3=21\) DMS datasets. Figure 3d showcases the capabilities of MoCHI in allowing models to be fit simultaneously to large numbers of DMS datasets, taking advantage of many independent measurements to constrain the inferred folding and binding free energy changes.
Although DMS data from multiple experiments corresponding to the same measured phenotype can optionally be normalized to each other explicitly before modeling, MoCHI obviates the need for this by inferring the parameters of an affine transformation between molecular phenotype and measured phenotype (Fig. 3d).
For both proteins, MoCHI fits the DMS data very well and exhibits high predictive performance on held out test data for bPCA (R2 = 0.83 and 0.91 for PSD95-PDZ3 binding to CRIPT and KRAS binding to RAF1 respectively, Fig. 3e–h) and aPCA (R2 = 0.76 and 0.74 for PSD95-PDZ3 and KRAS respectively, Fig. 3i–l). The high correlations of inferred binding and folding coefficients with independent in vitro measurements for PSD95-PDZ3 [49, 50] (Pearson’s r = 0.7–0.89, Fig. 3m) and KRAS [51] (Pearson’s r = 0.95–0.98, Fig. 3n) validates MoCHI as a tool to quantify energetic terms from DMS data.
Furthermore, by analyzing the resulting energetic landscapes in the context of structural information, specific mutations and residues enriched for large effects on binding affinity despite their distance to the binding interface can be readily identified. In both PSD95-PDZ3 and KRAS, these maps reveal both known and novel allosteric sites [15, 16]—representing the transmission of information spatially from one site to another. In addition to their biotechnological and medical value (for the prioritization of pockets for drug development), comprehensive energetic and allosteric maps provide deep insight into protein regulatory mechanisms.
Inferring the shape of global epistasis and pairwise genetic interactionsAlthough mechanistic models have advantages in terms of interpretability (as shown above), the causes of global epistasis are often not well understood. In these situations, MoCHI allows global nonlinearities to be estimated directly from DMS data. We use two previously published combinatorial DMS datasets to demonstrate that global and specific sources of epistasis can be correctly distinguished and inferred simultaneously without prior hypotheses. In the first study, the authors assayed the effects on splicing of all combinations of 12 mutations that occurred during the evolution of an alternatively spliced human exon, exon 6 of the FAS gene [38]. A minigene library of \(^\times 3 = \text\) exon mutant sequences was transfected and expressed in HEK293 cells, whereafter FAS exon 6 inclusion levels were determined by RT-PCR and deep sequencing (Fig.
Comments (0)