
Remember me
For a given GOI, the optimal Log(Vp) and optimal % full were not always achieved with the same plasmid ratios (Fig. 1), varying across the experimental space. This discrepancy introduces challenges in the optimization process, as focusing only on productivity for optimization may lead to suboptimal full-to-empty ratio in the selected optimum.
Fig. 1: Graphical representation of experimental spaces, showing how % full (red), Log(Vp) (green) and viability (blue) change at different ratios. Ratios are calculated in mass (µg/mL).
The shadowed areas represent the experimental space that is below the selected threshold for each of the three responses; green for Log(Vp), blue for viability and red for % full. The dotted lines represent the selected thresholds for each response. The threshold values are indicated in their corresponding colours. The white areas represent the experimental space where the three responses exceed the thresholds, meaning that they are optimal areas. The threshold values were determined by the desirability function (Eq. 5) to have equal weight of the three responses. The table on the bottom left corner shows the limits in coded notation (from 0 to 1) of the MD and FCCD models for each variable. A Mixture profiler in MD plasmid optimization for egfp-expressing rAAV for the responses of % full, Log(Vp) and viability. Chosen point is 0.4:0.25:0.35 (pHelper:pRepCap:pGOI). B FCCD contour plot for total DNA and FV optimization for egfp-expressing rAAV. Chosen point is -1,1 (DNA,FV). C Mixture profiler in MD plasmid optimization for msh2-expressing rAAV for the responses of % full, Log(Vp) and viability. Chosen point is 0.2:0.6:0.2. D FCCD contour plot for total DNA and FV optimization for msh2-expressing rAAV. Chosen point is 1,-1 (DNA,FV). E Mixture profiler in MD plasmid optimization for bdnf-expressing rAAV for the responses of % full, Log(Vp) and viability. 2 points were chosen. Point 1 aims to optimize Log(Vp) and is 0.5:0.4:0.1 (pHelper:pRepCap:pGOI). Point 2 aims to optimize % full and is 0.2:0.2:0.6 (pHelper:pRepCap:pGOI). F FCCD contour plot for total DNA and FV optimization for bdnf-expressing rAAV (case 1- Log(Vp) focused). Chosen point is -1,-1 (DNA,FV). (G) FCCD contour plot for total DNA and FV optimization for bdnf-expressing rAAV (case 2- % full focused). Chosen point is 1,-1 (DNA,FV).
When using egfp as the GOI, MD revealed that Log(Vp) is higher with high pHelper and pRepCap levels and low pGOI levels, while cell viability decreased in these conditions (Fig. 1A). In contrast, optimal values for the % full response were found in regions where neither Log(Vp) nor viability were maximized simultaneously (Fig. 1A). Due to the significant reduction in viability where Log(Vp) and % full responses were the highest and, considering the potential impact of low viability on product quality, we selected a plasmid ratio of 0.4:0.25:0.35 (pHelper:pRepCap:pGOI) as the optimal condition considering the three different responses. This was followed by further optimization of the total DNA and transfection reagent quantities. In the subsequent FCCD, it was found that viability did not limit the optimal values. Log(Vp) was higher when FV levels were low and DNA levels were high, or when FV levels were high, and DNA levels were low. However, % full was found to be higher when FV levels were high, and DNA levels were low. Thus, -1,1 (DNA,FV) was chosen as the optimal point. (Fig. 1B).
In the case of msh2 as a GOI, a different pattern emerged. The optimal conditions for all three responses (Log(Vp), % full, and viability) were found when pHelper and pGOI levels were lower and pRepCap levels were higher, with an optimal plasmid ratio of 0.2:0.6:0.2 (Fig. 1C). In the FCCD, lower concentrations of the transfection reagent FV significantly improved the % full response, with DNA levels having a minimal impact. However, for high FV levels, higher DNA concentrations reduced the % full response. Log(Vp) increased as FV concentrations decreased, with maximum values observed when both FV and DNA were at their lower limits. Despite this, high Log(Vp) was still supported when total DNA was high and FV was low (Fig. 1D). Considering the effect on viability, which peaked when FV was low and DNA was high, the 1,-1 (DNA, FV) conditions were chosen as optimal (Fig. 1D).
The optimization landscape for bdnf was more complex. A saddle point was observed for viability, but it did not severely limit the selection of optimal values. However, the other two responses, Log(Vp) and % full, moved in opposite directions across the experimental space (Fig. 1E). Log(Vp) was higher at high pHelper and pRepCap levels and decreased as pGOI increased. In contrast, the % full response improved with higher pGOI and lower pHelper and pRepCap levels. To accommodate these conflicting trends, two distinct FCCD designs were implemented for each of the two optimal ratios. One design focused on optimizing Log(Vp) (Fig. 1F), while the other targeted optimization of the full-to-empty capsid ratio (Fig. 1G). All responses were measured in both designs. In both cases, low FV levels optimized all responses. However, in the Log(Vp)-optimized design, low DNA levels yielded higher values across all responses. Therefore, -1,-1 (DNA, FV) was chosen as the optimal point to optimize Vp (Fig. 1F), whereas in the % full optimized design, higher DNA levels led to the best outcomes leading to 1,-1 (DNA, FV) being chosen as optimal for % full (Fig. 1G).
These findings demonstrate that the optimization process is highly dependent on the specific GOI, as each one influences the plasmid ratios and conditions required to achieve optimal responses. Furthermore, the optimal values for one response do not necessarily coincide with those for another response, highlighting the need for tailored optimization strategies for each GOI.
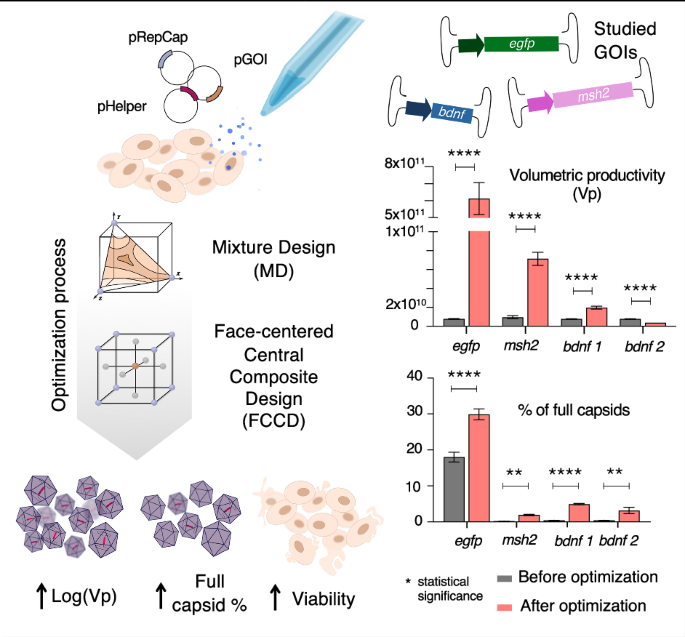
Optimizing viral particle production reveals GOI-specific variability in percentage of full rAAV capsidsThe optimal values achieved in the experimental runs for Log(Vp) were relatively consistent across the three different GOIs. In terms of Log(Vp), the optimal values in the MD ranged from 9.2 for bdnf to 10.46 for egfp, while after optimizing FCCD for Log(Vp), the range improved from 9.6 for bdnf to 12.6 for egfp (Fig. 2A). This suggested that viral particle production, as measured by Log(Vp), is less sensitive to the specific GOI, observing a more uniform response in this parameter across the experimental space. However, the full-to-empty ratio showed substantial differences depending on the GOI. In the MD, optimal values varied significantly, from as low as 0.18% for msh2 to 49% for egfp, while after the FCCD, the range extended from 4.2% for bdnf to 54% for egfp (Fig. 2B). These larger deviations highlight that the formation of full viral particles is highly dependent on the GOI. The differences observed, particularly in the % full response, emphasize the need for GOI-specific optimization strategies, suggesting that the efficiency of packaging full viral genomes is more variable, likely due to the distinct biological characteristics of each GOI. To get a further understanding of factors potentially affecting rAAV genome encapsidation that are distinct for each GOI, we performed an in silico analysis of the DNA sequence flanked by the ITRs in each rAAV construct. This analysis included GC sequence content, predictions of ∆G, the rAAV genome secondary structure and construct length. While GC content, ∆G and construct length did not show any correlation to rAAV genome encapsidation efficiency, our analysis revealed that wider secondary structures (msh2, bdnf) are correlated with lower % full values (Fig. 3D), suggesting that rAAV genome secondary structure might affect the formation of full viral particles.
Fig. 2: Optimal values achieved within the experimental runs.
A Optimal values achieved for Log(Vp) for efgp/msh2/bdnf-expressing rAAV for MD and FCCD. B Optimal values achieved for % full for efgp/msh2/bdnf-expressing rAAV for MD and FCCD.
Fig. 3: Structure of rAAV constructs.
A msh2-expressing rAAV construct. B bdnf-expressing rAAV construct. C egfp-expressing rAAV construct. D Secondary structure of studied rAAV constructs and features of GC content and ΔG. Left: secondary structure of msh2-expressing vector genome, center: secondary structure of bdnf-expressing vector genome, right: secondary structure of egfp-expressing vector genome.
FCCD can improve Log(Vp) and % full for three different GOIsIn our previous work, we highlighted the ability of FCCD to improve Log(Vp) and viability of cell producing egfp-expressing rAAV. Here, we focused on the response of Log(Vp) and % full and showed that FCCD can be used to improve Log(Vp) and % full responses not only for egfp-expressing rAAV, but for two more GOIs, after optimization with a MD. The highest Log(Vp) values obtained for egfp-expressing rAAV was 12.6 after FCCD, compared to 10.46 after MD, while for msh2-expressing rAAV, FCCD runs (Supplementary Table S1) reached 9.85, compared to 9.1 after MD. When optimizing for Log(Vp) for bdnf-expressing rAAV, the highest Log(Vp) values after FCCD (Supplementary Table S3) reached 9.6, while after MD the highest value was 9.2 (Fig. 2A).
Similarly, we obtained 54% full egfp-expressing rAAVs after FCCD (Supplementary Table S2), 5% higher than after MD. The highest % full value for msh2-expressing rAAVs during FCCD runs was 4.22%, a 23-fold increase compared to the optimal values obtained with MD. When optimizing for high % full for bdnf-expressing rAAVs, the highest achieved value with FCCD was 26.2%, compared to 5.13% obtained with MD, a 5-fold improvement (Fig. 2B).
Model validations and process improvementTo validate the predicted responses of the optimal values from each DOE model, validation runs were performed, with the results demonstrating that the predicted outcomes closely align with the observed responses for most genes and responses, with no significant differences, supporting the robustness of the MD + FCCD approach. For Log(Vp), the expected and obtained values were highly consistent for all genes, with only minimal, non-significant deviations observed, indicating strong predictive accuracy for this parameter (Fig. 4A). In terms of viability, all constructs maintained high cell viability, with no significant differences between the expected and obtained values (Fig. 4B). For the % full response, the predictions were also closely aligned with the observed values in most cases. However, for bdnf 2, the predicted value deviated significantly from the obtained. The results indicate that the optimal conditions do not achieve the expected response for % full (Fig. 4C). Interestingly, the tested condition of 1,-1 (DNA,FV) in bdnf 2 FCCD - which corresponded to run 6 - showed a more accurate outcome for % full, with predicted values closely aligning with the obtained response. The other two responses were also predicted accurately from the model (Supplementary Fig. 1), only Log(Vp) was lower than the predicted optimal presented in Fig. 4B. Therefore, these conditions should be utilized for optimizing only % full response, in case this is the only response of interest, as it yields better performance compared to the initially predicted optimal condition.
Fig. 4: Experimental validations.
Predicted and actual experimental values for all validated conditions for all models regarding (A) log(Vp), (B) viability and (C) % full. Significant differences (p < 0.05, unpaired t test) were found only between the expected and obtained values for bdnf-expressing rAAV, in the case of % full optimizing FCCD model, validating most models. Vp and full % improvement across all tested constructs are presented in (D) and (E), respectively. In most cases significant improvement (p < 0.05, unpaired t test) was observed. The data are presented as the mean ± SD (*p < 0.05, **p < 0.01, ***p < 0.001). bdnf 1 represents the optimal value to maximize Vp and bdnf 2 represents the optimal value to maximize % full.
Lastly, we compared our improved conditions with conditions before optimization (plasmid ratio 1:1:1 for pHelper:pRepCap:pGOI and 1:1 DNA:FV), Our results underscored the versatility of the MD + FCCD approach for achieving overall optimization from non-optimized to fully optimized production. Specifically, the final optimization using MD + FCCD led to substantial increases in both Vp and % full particle production compared to non-optimized transfection conditions. For egfp-expressing rAAVs, the Vp improved by almost 100-fold (Fig. 4D), and the full % increased by 1.6-fold (Fig. 4E). The case of msh2-expressing rAAVs showed significant improvements, with a tenfold increase in Vp (Fig. 4D), accompanied by a tenfold increase in full % (Fig. 4E), demonstrating effective optimization of both particle production and packaging efficiency. Notably, in the case of bdnf 1, which focuses on optimization of Vp, there was a significant threefold improvement in the Vp (Fig. 4D), together with a 12-fold improvement in % full (Fig. 4E). In the case 2 of bdnf, where the optimization was focused on increasing % full particle production, a decrease in Vp was observed (Fig. 4D), which was anticipated given the emphasis on packaging efficiency, together with a significant 7.8-fold improvement for % full response (Fig. 4E). This case underscores the importance of integrating both Vp and % full as parallel objectives during the optimization process, as reduction in Vp optimization could be observed when prioritizing only full %, compromising the total yield and efficacy of the final product.
Comments (0)