Patient samples
This study was approved by the Bloomsbury Ethics Committee (no. 08H071382). CD34 + HSC were obtained from the bone marrow of a 3-month-old severe DADA2 patient presenting with Pure Red-Cell Aplasia (PRCA) (genotype ADA2 p.G47W/p.G47W). Healthy donor HSC were obtained from leukapheresis provided from the Antony Nolan laboratories with consent (no. CGT125, 2 healthy donors: age 21 and 31 years old, one male, one female).
Mice
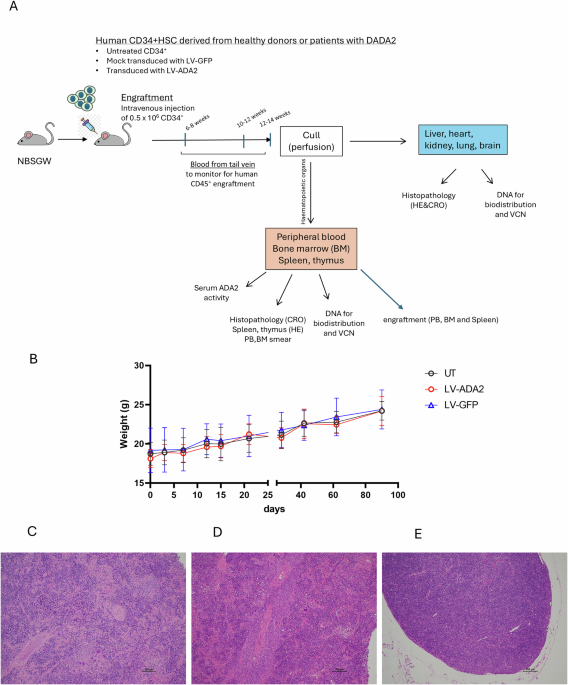
NBSGW mice were obtained from the Jackson Laboratory. Procedures were approved by the UCL Biological Services Animal Welfare and Ethical Review Board and licensed by the Home Office under the UK Animals (Scientific Procedures) Act 1986, Amendment Regulations 2012 (ASPA). Transplanted mice were monitored daily during the first 2 weeks after transplantation and then weekly to record body weight. After 8- and 12-weeks post-transplantation, mouse peripheral blood from tail vein was stained with anti-human CD45-APC antibody (clone H130, Biolegend) to evaluate human CD45+ engraftment by flow cytometry. Mice showing weight loss of 20% or more, or signs of distress were humanely sacrificed following the NC3R recommendations.
CD34+ HSC isolation, transduction, cell differentiation and colony forming unit (CFU) Assay
CD34 + HSC were isolated from mobilised peripheral blood for healthy donor cells (apheresis product, n = 2), and the bone marrow aspirate of a patient with DADA2 using magnetic separation following the manufacturer’s protocol (Miltenyi Biotec, UK). CD34+ cells were seeded in growth medium (SCGM + 1% human serum albumin, 20 ng/ml IL-3, 300 ng/ml stem cell factor [SCF], 300 ng/ml fms-like tyrosine kinase 3 ligand [FLT3L], and 100 ng/ml thrombopoietin [TPO]; Peprotech, UK) at a density of 1 × 10⁶ cells/ml and pre-stimulated overnight. CD34 + HSC transduction experiments were carried out by using a third-generation lentiviral vector on a pCCL backbone containing codon-optimized human ADA2 cDNA driven by the elongation factor 1α short (EFS) promoter, internal ribosomal entry site (IRES), and enhanced green fluorescent protein (eGFP), or eGFP alone (EFS-ADA2-eGFP; EFS-eGFP). Vectors were produced by transient transfection of HEK293T cells as previously described [10, 14].
Cells were transduced with the lentiviral vector at MOI 30 in the presence of 4μg/ml of Protamine Sulphate and 1 mg/ml of LentiBOOST (GMP grade Kolliphor P338, BASF) for 16–18 h. After transduction, cells were frozen in CryoStor@CS10 (Stem Cell Technology, UK) for the transplantation experiment. Some cells were maintained in liquid culture in the growth medium for cell proliferation and viral copy number (VCN) assay, or grown as progenitors in semi-solid Methocult medium (STEMCELL) for 2 weeks as described previously [10]. Colony forming units (CFU) were enumerated by manual counting on day 14 post-plating, discriminating BFU-E (burst forming units-erythroid), CFU-GM (colony forming units granulocyte-macrophages) and CFU-GEMM (colony forming units granulocyte, monocyte, megakaryocyte). Total colonies counted were more than 50, using a density of 250 LV-GFP or LV-ADA2-GFP transduced cells in a total volume of 1.1 mL per well of a 6-well plate. Vector copy number (VCN) of LV-transduced cells was between 1.6 and 4.0.
Western blotting
Cells were lysed in RIPA buffer (Thermo Fisher Scientific, Waltham, Mass) with 1% proteinase inhibitors (Roche Diagnostics). Lysates were boiled in the presence of 2 X Laemmli Buffer. Protein concentrations were measured using Pierce BCA Protein Assay (Thermo Fisher Scientific, UK). A total of 20 μg total protein was subjected to SDS-PAGE analysis and electrotransferred onto polyvinylidene difluoride membranes (Millipore, Temecula, Calif). Membranes were blocked with milk, probed with primary and secondary antibodies, and visualized with the enhanced chemiluminescence detection system (Amersham Pharmacia Biotech, Little Chalfont, United Kingdom). The following antibodies were used: ADA2 (ab154619, Abcam), ACTN (MAB 1501R; Merck Millipore, Burlington, Mass), Goat anti-Rabbit IgG, HRP (ThermoFisher) and Rabbit anti-mouse IgG, HRP (ThermoFisher).
Transplantation into NBSGW Mice
Frozen untransduced/transduced CD34 + HSC were thawed, washed and resuspended in 200 μl of PBS (0.5 ×10⁶ per mouse) and injected via tail vein into NBSGW mice with a 29-gauge ×0.5 inch needle. A total of 21 mice (6 weeks old, females) were used in this study. Table 1 summarises the different experimental groups and conditions studied. Of note one mouse (transplanted with untransduced healthy donor HSC) was ultimately excluded from the study because of its mega-spleen and hyperactivity.
Table 1 Experimental groups of NBSGW mice and treatments received.Engraftment studies and ADA2 Expression
A total of 50 μl blood sample was drawn into heparin-coated capillary tubes from the tail vein of all animals and processed for flow cytometric analysis. At 12-weeks post engraftment, serum, bone marrow, spleen, thymus, liver, lung, heart and brain were collected.
Flow cytometry
Detection of engrafted cells
Human cell engraftment was assessed by staining peripheral blood (PB), bone marrow (BM) and spleen cell suspension with the anti-CD45-APC antibody (clone H130, Biolegend). Cells were recorded on the CytoFLEX flow cytometer (Beckman Coulter, Buckinghamshire, UK), and data were analysed using FlowJo software (TreeStar, Ashland, OR, USA). The LOQ was set at >1% CD45+ cells.
Lineage distribution in NBSGW mice
Cell suspensions from BM, spleen and PB (~2 × 10⁵ cells) were co-stained in 50 µl MACS buffer with 0.5 µl of each of the following antibodies: CD45-APC, CD19-PE-Cy7 (Clone HIB19, Biolegend)), CD3-Pacific Blue (Clone OKT3, Biolegend), and CD33-PE (Clone VM53, Biolegend). Prior to acquisition, samples were stained with 2 µl of the viability dye DAPI. Samples were analysed on the CytoFLEX flow cytometer (Beckman Coulter, Buckinghamshire, UK), and data were analysed using FlowJo software (TreeStar, Ashland, OR, USA).
ADA2 enzyme activity
A commercial assay kit was used to quantify serum ADA2 enzyme activity according to the instructions of the manufacturer (Diazyme, USA). The assay quantifies the adenosine-dependent generation of ammonia by coupling to the Glutamic Dehydrogenase (GDH)-catalysed reaction of NH3 with α-ketoglutarate in the presence of NADH. ADA2 activity is distinguished from total ADA with the use of the selective inhibitor of ADA1, 100 nM EHNA (erythro-9-Amino--hexyl--methyl-9H-purine-9-ethano hydrochloride). The kinetics of each reaction were analysed using an Optima Microplate Reader (BMG Labtech, UK).
Histopathology
Formalin-fixed samples of thymus, spleen, liver, lung, liver and brain from 21 mice were processed by Great Ormond Street Hospital, Department of Histopathology. Slides from each of the samples were dewaxed in xylene, hydrated through a series of graded alcohols and rinsed in running tap water. The slides were then stained in Mayer’s haematoxylin before counter staining with aqueous eosin. Stained slides were then scanned on the Hamamatsu Nanozoomer 2.0 HT at 20x magnification to produce whole slide digital scans. Each of the 78 digital scans were evaluated by the study pathologist using the NDP.view2 viewing software. Each H&E section was thoroughly examined histologically, and lesions observed were recorded in an Excel spreadsheet, their severity graded (minimal, mild, moderate, or severe). Their distribution was also characterized (focal, multifocal, focally extensive or diffuse), as well as their localisation. Examination was performed in a blinded manner without knowledge of animal age, sex, strain, and/or treatment.
Biodistribution studiesGenomic DNA extraction
gDNA from blood samples and/or haematopoietic organs (bone marrow, blood, spleen, thymus, kidney, lung, heart and brain) was extracted using the DNeasy Blood and Tissue Kit (QIAGEN) following the manufacturer’s protocol. DNA concentration for each sample was determined by Nanodrop (Thermo Scientific, USA).
VCN by qPCR
Average vector copy number/cell (VCN) was calculated as previously described [10]. The set of primers and probes used are listed below: psi copies/hAlb copies *2.
HIV-PSI Forward 5’ CAG GAC TCG GCT TGC TGA AG 3’, HIV-PSI Reverse 5’ TCC CCC GCT TAA TAC TGA CG 3’, HIV-PSI Probe 5’ FAM-CGC ACG GCA AGA GGC GAG G TAMRA-3’, H Albumin Forward 5’ GCT GCT ATC TCT TGT GGG CTG T 3’, H Albumin Reverse 5’ ACT CAT GGG AGC TGC TGG TTC 3’, H Albumin Probe 5’ VIC-CCT GTC ATG CCC ACA CAA ATC TCT CC-TAMRA 3’.
The limit of Detection (LOD) was set at >0.001 copies per µl, and the Limit of Quantification (LOQ) was fixed at <4 copies of human albumin per µl for vector copy number.
Statistical analysis
All data were assembled and analysed using GraphPad Prism software version 10. Results were expressed as mean and standard error of the mean, or median and range. ANOVA and T-test were used for group comparisons. P values of less than 0.05 were considered significant.

Comments (0)