
Remember me
Bulk cultures of male JHU106i iPSC were differentiated to 3D HLC spheroids as previously described expressing markers of pluripotency and hepatocytes, respectively [29, 30]. Cultures were infected with 2nd generation HIV-1 based LV vectors carrying native LTR (pHV) or SIN LTR (pHR) configurations, respectively, and use an SFFV internal promoter to drive GFP expression (Fig. S1A, B). Flow cytometry was used to measure infection by GFP expression in iPSC at 90% and single cell dissipated 3D HLC at 85%, as previously described [31]. Normalised vector copy number (VCN), measured via TaqMan™ qPCR (n = 3 biological samples, each sample read in triplicate) on infected samples ranged between 1.5–9.0 VCN/cell. Significantly higher VCN was found in HLC infected with pHV compared to pHR, which contrasted the infection of iPSC (Fig. S1C).
LV insertion site analysisAs integration in specific sites have been shown to contribute towards genotoxicity, insertion site (IS) analysis of LV was performed by Extension Primer Tag Selection Ligation-Mediated Polymerase Chain Reaction (EPTS/LM-PCR) [32] after infection. Biological replicates (n = 3) were used for each condition (i.e. timepoint and cell type). iPSC were harvested at two time points, 3 and 30 day post infection by LV whereas HLCs were harvested day 3 post infection for analysis due to their quiescent nature. In total, 412,786 integration sites (IS) were detected, with percentages normalised to the total number of IS across the genome. IS profiling of gene density, chromosome location, proximity to CpG islands and GC content and position within the gene transcription unit in both iPSC and HLC genomes were identified (data not shown) and appeared as previously reported for HIV-1 LV integration [3]. Locations within the transcription units was defined by regions transcribed into mRNA. Analysis of IS in non-cancer and cancer genes shows vector distribution in introns, 3’ untranslated regions (UTR), 5’ UTR and in exons (Fig. S2). To investigate the distance between IS and transcription start sites (TSS) in transcriptional units, the mean distance across each data set was plotted in the scale of 0–1 (exon or intron; normalised against gene length) or Log10 (3’ or 5’ UTR; value in base pairs). IS appeared evenly distributed in introns. IS identified in exons mainly congregated at 3’ end of genes (median insertion sites at 82.8% of averaged gene length). On average, inserts identified in 5’ UTRs were 27.9 kbp upstream of the ATG coding region and in 3’ UTR regions, inserts were 29.6 kbp downstream from the stop codon respectively.
For all genes, the IS number is highest in introns most likely because of size. There is a reduction in IS identified in iPSC cultures over the 30 day time period. This occurred for both vectors independent of LTR configuration and target site selection in the transcription unit (Fig. S2). A reduction in IS in non-cancer and cancer genes appears consistent between the two time points of 3 and 30 days after infection. Reduction in the number of IS found could be due to clonal selection or as a result of cell death due to insertions detrimental to cell survival. To examine for cell outgrowth, longer periods of culture would be necessary to study differences in IS selected by the vector that may influence cellular proliferation.
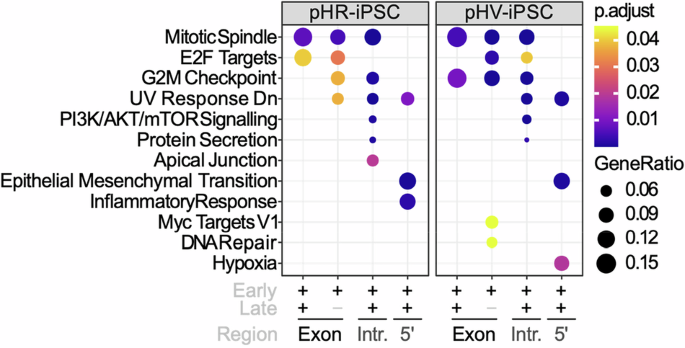
LV IS associate with pathways representing cellular proliferative potentialTo gain insight into the enrichment of genes targeted by each LV involved in cancer pathways, hallmark pathway analysis was performed using the integration site analysis data from iPSC cultures obtained 3 days and 30 days post infection (Fig. 1). The level of enrichment is shown by dot sizes and colour intensity. Enrichment was found for IS in exons, introns, 5’ UTR but not 3’UTR regions. For both LV configurations, IS that were identified 3 days post infection enriched in exons for genes in significant pathways (p < 0.05) associated with cell cycle i.e. E2F targets, G2M checkpoint and DNA repair, were not identified at the later 30-day harvest time point. At the later time point, IS positioning in enriched genes appeared predominantly in introns and UTR regions of these genes and associated with the PI3K-AKT/MTOR pathway and pathways for epithelial mesenchymal transition. Between the two LV, differences in enrichment of genes were found for pathways involved in the inflammatory response (pHR) or hypoxia (pHV), respectively. Next, we looked into which genes were represented in each pathway. Interestingly, we found that most of the targeted genes were tumour suppressor genes. Compared to the pHR infected iPSCs, many of the tumour suppressor genes-associated inserts were identified in introns or UTRs in the pHV infected iPSCs at both early and late time points as opposed to these insertions being only present in early time point in pHR infected iPSCs. Targeted oncogenes were mainly identified in PI3K/AKT/mTOR signalling pathway. Compared to the infected iPSCs, HLCs exhibit enriched genes for the TNFα signalling pathway via NF-kB upon pHV infection with insertions in the 5’UTR and for the androgen response pathway in introns (Fig. 2). Fewer targeted genes associated with oncogenes or tumour suppressor genes was found in the infected HLCs. From these data, we concluded that both vectors are capable of insertion into genes important to oncogenesis and that the pHV with native LTR configuration appears to reside mainly in 5’UTR and introns over time where the LTR promoter may have greater influence on control of gene expression.
Fig. 1: Pathway analysis of enriched hallmark gene sets in pHR or pHV infected iPSCs.
Dot plots representing the most enriched signalling pathways within Hallmark gene sets for IS in pHR- or pHV-infected cells in early stage post infection or a combination of both across distinct regulatory regions, as denoted by + or −. Gene enrichment percentages are indicated by dot size. Benjamini–Hochberg adjusted p values are indicated by colour gradients (p < 0.05).
Fig. 2: Pathway analysis showing enriched Hallmark gene sets in LV infected HLC.
Dot plots of the enriched signalling pathways within Hallmark gene sets for insertion sites identified in pHR or pHV infected HLCs, harvested 3 days post infection, across distinct regulatory regions. Expression percentages of gene sets are indicated by dot sizes. The Benjamini–Hochberg adjusted p values are indicated by colour gradients (p < 0.05).
Clonal tracking IS in iPSC exposes genes associated with clonal outgrowthSince lentiviral insertion occurs in a semi-random manner, we looked at sequence count changes (SCC) in IS for all genes, regardless of positioning, using iPSCs between the early and late sampling timepoints. We used differential absolute SCC of ≥2-fold (Benjamini-Hoberg corrected p value p < 0.05) to represent only significantly enriched genes (n = 3 biological replicates) between the early and late assay timepoints. Differential analysis identified 717 targeted genes that included 23 oncogenes (10 pHR and 13 pHV) and 35 tumour suppressor genes (15 pHR and 20 pHV). Oncogenes and tumour suppressor genes that were identified in iPSC with SCC between early and late harvests were identified for both LV (Table S1).
The IS identified were always positioned in introns or UTR regions of genes. These were associated with eukaryotic translation, cell cycle regulation, kinases associated with protein phosphorylation and RNA export from nucleus. Once again, this identifies genes potentially involved in clonal outgrowth associated with insertions by both pHR or pHV LV.
Analysis of gene expression changes in isolated iPSC clones infected by LVTo analyse directly the effect of LV integration on IS gene expression, single iPSC clones from pHR and pHV infections were isolated and expanded. DNA and RNA was then extracted for IS identification and qPCR analyses, respectively. Measurement of gene expression changes associated with each IS were compared to the expression of each respective gene in non-infected iPSC. For pHR and pHV, 27 and 29 IS genes, respectively, were identified significantly upregulated (> 2 fold) (Fig. S3). None of these genes were found to be downregulated, indicating positive vector influence on gene expression by both LV regardless of LTR configuration.
For further analysis of transcript identity beyond qPCR expression studies, we analysed the RNA Seq data derived from these isolated single cell iPSC clones. This identified a number of vector-host fusion transcripts. Of these transcripts, several were associated with LV insertion sites (Table S2). Mapping transcripts to each vector showed these to contain intron sequences suggesting gene splicing or readthrough may be the cause of altered gene expression. Further analysis of each fusion transcript is intended to identify regions common to each LV used for splicing events and quantify the ratio of splicing to readthrough by each LV.
Differential expression of genes (DEG) in infected cells aligns with unique signatures representative of biological processes critical for oncogenesisTo determine the global changes in gene expression upon infection by LV, RNASeq on infected bulk cultures was used to provide an unbiased transcriptome wide DEG profile against control uninfected cells. Compared to uninfected cells, when assessing infected iPSC (regardless of harvest timepoint), a total of 1011 DEG were associated with pHV with increases in 14 oncogenes and decreases in 14 tumour suppressor genes. Of 871 DEG associated with pHR, we identified increases in 10 oncogenes and decreases in 20 tumour suppressor genes. Those that were dysregulated by the greatest significance (p.adj < 0.01) and highest log2 fold change (absolute LogFC >1) are shown in red as upregulated and blue as downregulated in Fig. 3A, B. Common to both LV, GO term analysis of DEG identified annotated biological functions for signalling pathways that involve RNA transcription and protein modification. Between both vectors, common classes of signalling pathways were enriched including for autophagy, protein catabolism and protein modification, with unique classes enriched for each vector, including cell cycle (pHR) and DNA damage response (pHV) (Fig. 3C, D). Further, DEG were associated with strong immune signatures with cells displaying active cytokine production early after infection. In pHV-infected iPSCs, quite a few upregulated DEGs are implicated in methylation (n = 11; NSUN7, PRDM15, SMYD4, CMTR2, CARNMT1, FAM86C2P, MTAP, METTL3, METTL15, METTL7A, TPMT) and WNT signalling (n = 12; LYPD6, PRDM15, SMURF2, ADGRA2, DAAM2, EDA, ROR2, RECK, SEMA5A, TTC21B, TGFB1, ZEB2), partially characteristic of cancer development. In pHR-infected iPSCs, quite a few upregulated DEGs are implicated in response to DNA damage stimulus (n = 21; BCL3, BCL6, CDKN2AIP, CTC1, DDX11, DCLRE1B, POLK, POLQ, FANCF, FAM111A, MICA, RAD52, SETD7, SLF1, SUV39H1, WRN, HROB, IRF7, MCM8, VAV3, ZC3H12A) and activation of GTPase activity (n = 11; GMIP, RUNDC1, TBCK, TBC1D2, TBC1D22B, USP6NL, WNT5A, NEDD9, SGSM1, SLC27A4, SYDE1), partially suggestive of protection against cancer progression [33]. These data suggest LV with native LTR configuration associates with different cellular response to infection than SIN configuration LV suggesting greater genotoxic potential.
Fig. 3: Investigation of gene expression changes in iPSC after lentivirus infection reveals mechanistic implications for oncogenesis.
A, B Volcano plots illustrate genes that are upregulated (right, LogFC > 1) and downregulated (left, LogFC < −1) in infected iPSC, independent of sampling time, compared to uninfected controls. The volcano plot shows the most upregulated genes are on the right and the most downregulated genes are on the left. These genes are shown in boxes. A pHR and B pHV. Statistical significance is indicated in different colours. Highly significant genes have been labelled. C, D The top pathways with statistical significance and higher averaged expression levels of the genes characteristic of each pathway are shown. Dot plots reveal the main biological processes enriched in infected cells. C pHR and D pHV. Mean Log2 fold changes are indicated by colour gradients. The Benjamini–Hochberg adjusted p values for all graphs are indicated by dot sizes (p < 0.01).
To determine whether the two differing LTR configurations are associated with DEG indicative of biological pathways towards cellular proliferation, DEG in cells infected by each LV configuration was compared between to control samples (Fig. 3). Compared to uninfected cells, pHR LV infected iPSC showed 419 DEG comprising 22 oncogenes and 10 tumour suppressor genes. These were implicated in tyrosine kinase receptor signalling and cellular senescence pathways. In contrast, 472 DEG were associated with pHV LV infected iPSC that comprised of 20 oncogenes and 13 tumour suppressor genes, representative of p13K and MAPK signalling pathway activation.
When comparing DEG in infected iPSC at the early stage for both LV, these cells exhibit active cytokine production (Fig. 4C, D). To compare DEG between the early and later time points cells, we used volcano plots to show the most upregulated and downregulated genes. These are shown for pHR and pHV where the genes on the right are most upregulated and the most downregulated genes are shown on the left, presented in boxes (Fig. 4A, B). For both LV configurations, DEG of MECOM and LMO2 genes, known to be associated with clonal dominance, were also identified. Biological pathways for DEG are presented in Fig. 4C, D. Dot plots illustrating enriched gene sets characteristic of Hallmark pathways between early and later time points are shown where the major difference between pHR and pHV infected iPSCs is characterised by DEG corresponding to the p53 pathway responding to DNA damage in pHR infected cells versus DEG corresponding to the inflammatory response in pHV infected iPSCs (Fig. 5). These results confirm differences in global gene expression involving cancer genes occurs upon LV infection by either LTR configuration.
Fig. 4: Investigation of gene expression changes in early vs. late harvested iPSCs post-lentivirus infection shows activated immune response with distinct pathway implications.
A, B Volcano plots illustrate the upregulated (right, LogFC > 1) and downregulated (left, LogFC < −1) genes in pHR (A) and pHV-infected (B) iPSCs, comparing late to early harvest post-infection. Significance levels are represented by colour variations. Highly significant genes have been labelled. The volcano plot shows the most upregulated genes are on the right and the most downregulated genes are on the left. These genes are shown in boxes. C, D Dot plots reveal the main biological processes enriched in pHR and pHV infected iPSCs for both early and late harvests. In early harvested samples, both pHR and pHV infections show immune signatures, especially in cytokine production. Distinctly, late-harvested pHR-infected iPSCs predominantly show pathways related to DNA damage responses, while pHV infections are characterised by inflammatory pathways. For both LV configurations, DEG of MECOM and LMO2 genes, known to be associated with clonal dominance were identified Mean Log2 fold changes are indicated by colour gradients. The Benjamini–Hochberg adjusted p values are indicated by dot sizes.
Fig. 5: Pathway analysis reveals activated DNA damage response, EMT and inflammatory response in iPSCs post-lentivirus infection by Day 30.
Dot plots illustrate enriched gene sets characteristic of Hallmark pathways between Day 3 and Day 30. Specifically, pHR-infected iPSCs at Day 30 are associated with genes characteristic of DNA damage response, EMT and coagulation pathways, while pHV-infected iPSCs are associated with inflammatory response. Expression percentages of gene sets are indicated by dot sizes. The Benjamini–Hochberg adjusted p values are indicated by colour gradients.
HLC infected by each vector was harvested only at the early 3 day time point and DEG were identified and compared with uninfected cells. Analysis in HLC infected by pHR LV found 569 DEG of which 37 were oncogenes and 51 tumour suppressor genes. In contrast, infection by pHV LV resulted in identification of 3762 (seven-fold increase) DEG of which 81 oncogenes and 82 tumour suppressor genes, that included MECOM, LMO-2 and BRAF genes previously associated with genotoxicity [8, 15, 24]. These were not present in the pHR DEG suggesting stronger genotoxic potential by the native LTR configuration vector. Chi square test analysis reveals no significant difference between the number of oncogenes and tumour suppressor genes differentially expressed by pHR or pHV LV in HLC (Chi-Square = 1.0523, p value = 0.305). GO term analysis of these data showed genes mainly associated with tyrosine kinase signalling (n = 23 genes) and protein phosphorylation (n = 19 genes) and their related pathways, such as ERK1/2 cascade and PI3K/AKT/mTOR pathway. For pHV infected cells, GO term analysis of the upregulated DEG also identified pathways involving chemotaxis (n = 23 genes) and cancer signalling pathways (n = 36 genes), including NF-kB (n = 69 genes), MAPK (n = 54 genes), Wnt (n = 39 genes), JNK (n = 38 genes) and PI3K/AKT. In contrast, pHR infected cells show pathways characterised by groups of genes protective against viral infection such as interferon-associated genes (n = 5), DNA damage (n = 35 genes), p53-mediated apoptotic proteins (n = 3), zinc finger proteins (n = 3) and autophagy (n = 25). These results indicate the oncogenic shift in gene expression after gene transfer appears greater for the native LTR vector.
Weighted gene co-expression network analysis (WGCNA) reveals distinct LV associated gene expressionWGCNA is a systems biology approach used to identify transcriptome-wide relationships of all genes rather than individual genes in isolation. Genes with similar expression patterns, that may be up or downregulated in their expression or belong to pathways with similar functionality, are placed into modules. Genes that are expressed and belong to these modules may also be analysed for enrichment. Hence, to better understand biological processes that may be influenced by LV infection, we profiled unique gene expression programmes across iPSCs or HLCs particular to each LV using transcriptomic data for this unbiased approached. Firstly, RNASeq was used to identify the expression of 1000 genes from the LV infected samples that could be grouped as co-expressed genes (Fig. 6A). Those with high significance were then placed into co-expression modules. These modules are indicated by colour codes, gene numbers (g), and percentage of shared inserted target genes (Table S3). We found that modules coloured in Brown, Turquoise, and Green are associated with higher proportions of shared inserted target genes and tumour suppressor genes (TSG). These modules were further found to be associated with pHR and pHV infected iPSC or HLC using Pearson’s correlation (Fig. 6B). The functional implications of each module were assessed and shown as dot blots (Fig. 6C). We found that these modules are associated with biological processes critical for protein modification (Brown), cellular metabolism (Turquoise), synaptic signalling (Blue), stimulus and immune response (Green), epithelial cell differentiation (Red), RNA metabolism (Magenta), phagocytosis (Pink), cellular respiration (Yellow). High scores indicate high similarity, whilst low scores indicate little correlation.
Fig. 6: Identification and characterisation of co-expression modules through weighted correlation network analysis (WGCNA).
A Transcriptomic data from 1000 genes from all LV infected samples were analysed through WGCNA and grouped into common co-expression modules. The heatmap shows the main co-expression modules which were identified, each representing different biological functions. B 6 co-expression modules were found to be highly significant across all LV infected samples. A heatmap of these modules are shown for each sample using Pearson’s correlation. This highlights differences between each sample, with an association generally shown after LV infection regardless of vector configuration. The brown, turquoise, and green modules particularly have a significant overlap of genes, including those preventative of tumourigenesis. C Dot plots showing the main biological implications of each co-expression module in protein modification (brown), cellular metabolism (turquoise), synaptic signalling (blue), stimulus and immune response (green), epithelial cell differentiation (red), RNA metabolism (magenta), phagocytosis (pink) and cellular respiration (yellow) indicating crossover in biological processes targeting by the vector for IS preference. The Benjamini–Hochberg adjusted p values in −Log10 are indicated by dot sizes.
For pHR infection, protein modification, cellular metabolism and stimulus and immune response were associated with high proportions of shared genes including tumour suppressor genes, although in general there is a shift to an increased association with these modules after infection regardless of the LV used (Fig. 6B). A greater shift of association occurred in infected HLCs compared to iPSCs where there is a small decrease in association over time. Interestingly, there is a greater shift of association with these modules after pHR infection compared to pHV.
These data show that each LV is clearly associated with dysregulation of critical biological processes that are known implicated in oncogenesis [34,35,36,37,38,39], however it is difficult to quantify the contribution of these changes to genotoxicity.
Gene splicing with LV and the human genome in infected cellsGene splicing and readthrough is known to occur between LV and the targeted host genome and aberrant splicing is also known to cause changes in cancer gene expression [40]. Once again RNASeq of total RNA transcripts was used to identify novel fusion transcripts. We identified a total of 763 fusion genes across all iPSC and HLC infected cells involving both vectors of which 69 contained both vector and host sequences (Fig. 7A). The majority of these fusions showed vector integration within intron gene regions. Mapping of these fusions back to the vector genome is intended to determine common sites used by the vector for splicing with host genes and quantify the ratio of splicing to readthrough associated with each LV.
Fig. 7: Analysis of fusion genes highlights their role in differential gene expression and lentiviral insertion patterns associated with key biological processes.
A Bar charts showing the total number of fusion genes in pHR/pHV-infected iPSCs or HLCs harvested on Day 3 or 30 before analysis for vector/host fusions. SEM shown between three replicates analysed. B Table summarising specific fusion genes containing vector and host sequences identified for each treatment, with asterisks indicating those genes also differentially expressed and associated with insertion sites. C Scatter plots highlighting the significance of fusion genes within each co-expression module. Genes with high connectivity (i.e., central genes) are pivotal to the module biological function, compared to those with less connectivity (i.e., peripheral genes). Vector host fusion genes identified are predominantly present in the turquoise (cellular metabolism), brown (protein modification), and green (immune response) modules (n = gene number).
Of these DEG for both LV, 38 genes were also found as fusions and represented as IS (Fig. 7B). These triple positives (fusions genes, IS and DEG) were present as a smaller proportion in infected HLC (46%) compared to iPSC (79%), most likely due to higher gene expression in iPSC. Once again, the fusion genes identified were associated with cellular metabolism (n = 39), protein modification (n = 14), and stimulus and immune response (n = 6) module categories (Fig. 7C). Whereas the majority of pHR genes are associated with pathways involving the immune response, those associated with pHV are predominantly involved in metabolism with several highly relevant to cancer, suggesting this vector to have higher genotoxic potential.
Transcriptome changes that align with cancer-specific gene signatures suggest trends in LV associated genotoxicityTo profile LV host interactions with carcinogenesis probability, we firstly defined highly relevant cancer-specific signatures to several cancer types using differential gene expression analysis compared to their normal tissues before LV infection. Through pathway analysis, using GO terms or hallmark gene sets, we found these signatures associated with enriched pathways involving nucleic acid synthesis/metabolism, active transcription, cell proliferation, E2F targets and the G2M checkpoint (Fig. 8A). These significant signatures were then used to score against the transcriptomes of infected iPSC or HLC from early or late harvest data analysis (p > 0.05, Fig. 8B). The average overall cancer signature score across all cancer profiles highlights differences between samples (Fig. 8C). Importantly, the cancer signature scores provide initial insights into vector-associated genotoxicity by indicating exploratory trends rather than statistically significant differences.
Fig. 8: Evaluation of the potential carcinogenic impact of pHR or pHV lentiviral infection.
A Dot plots of the most significantly enriched signalling pathways within Hallmark gene sets for cancer specific molecular signatures. Expression percentages of gene sets are indicated by dot sizes. The majority of these pathways are shown to be significant (p.adjust < 0.05). B Heatmap illustrating the cancer-specific scores for uninfected (control) and infected iPSCs and HLCs. C Average cancer signature scores, shown with SEM, to identify trends in data. Overall, a shift towards oncogenic gene signatures is demonstrated subsequent to LV infection. Notably, iPSCs generally exhibit higher cancer propensity scores than HLCs, potentially due to their higher proliferation. At Day 3 post-infection, pHR infected cells demonstrate elevated cancer-specific scores relative to pHV infected cells, consistent with earlier observations. By Day 30, however, pHV infected iPSCs exhibit higher scores than their pHR infected counterparts, suggestive of carcinogenesis.
In general, infected iPSCs are characterised by higher cancer scores than infected HLC as expected due to their proliferative status. At the early harvest time point, pHR infected iPSC or HLC have higher cancer scores than pHV infected cells, in agreement with the IS and DEGs we identified earlier. However, after continued iPSCs culturing, sample harvesting at day 30 clearly associated pHV infected cells with higher cancer scores than pHR late cultures, revealing possible differences in the genotoxicity potential of the pHV vector (Fig. 8B). Focussing on liver cancer using HLC data, scores were different for the association between HLC infected with pHV and pHR at 0.2 and 0.29, respectively, compared to HLC CTRL (uninfected control) at 0.07. Further validation in future studies with established control vectors would be required to provide reliable genotoxic significance to compare vector genotoxicity potential.
Epigenetic analysis reveals unique lentivirus-induced methylation profilesDNA methylation is known to be associated with cancer [23]. We investigated whether epigenetic changes, in the form of DNA methylation could be used as an indicator of genotoxic potential for each LV. To do this, we analysed differentially methylated regions (DMR) in iPSC harvested at the late time point after LV infection. Hyper or hypomethylation of regions of regulatory elements were quantified and indicated using different colour codes in Fig. S4A. iPSC infected with pHV LV were characterised with increased hyper and hypo methylated regions compared with the pHR vector. The numbers of differentially methylated CpG island together with other regulatory elements including open-sea, shelf, and shore were found to peak at the gene body and reduce elsewhere. These remained higher in hypermethylated regions than hypomethylated regions. This trend was similar in pHR infected iPSC and HLC, suggesting both LV capable to induce general hypermethylation.
By focussing on CpG island hyper or hypomethylated promoter regions (TSS1500 or TSS200), there was a marked increase in the number of hypermethylated genes corresponding to pHV infection of iPSC (n = 210) than pHR infected iPSC (n = 24) or HLC (n = 28) (Fig. S4B, C). Through pathway analysis, we found hypermethylated signalling molecules associated with intracellular signal transduction enriched in these pHV infected iPSC (Fig. S4D). Several pathways, such as regulation of neurotransmitter levels and chemical synaptic transmission, known to be associated with cancer genes were found hypermethylated in pHV infected iPSC. Collectively, these data clearly suggest once again pHV with higher potential for genotoxicity than pHR.
Multi-omics analysis shows pathways associated with cancer-related genes are shared between assay data setsWe next investigated, using assay data sets for both LV, whether cancer genes with IS could also be found with altered DMR and DEG in LV infected iPSC (Fig. 9). No genes were found overlapping in data sets for all three, however, some genes for cancer pathways were shared for LVs: methylomic and genomic (n = 3); methylomic and transcriptomic (n = 15) and genomic and transcriptomic (n = 166). Between the different data sets, pathways were enriched concerning cell signalling and associated with cell adhesion. Specifically, to methylomic and transcriptomic data, pathways were enriched for DNA repair of double strand breaks and for transcriptomic and IS data, enrichment pathways for apoptosis were observed. Closer examination of these pathways revealed them prominently to involve tumour suppressor genes important to carcinogenesis.
Fig. 9: Omics data analysis between cancer genes commonly shared between DNA-seq (IS), RNA-seq and methylation data sets.
Gene numbers are shown in a logarithmic scale. A delta beta value of greater or less than 0.2 was used to indicate hyper or hypo-methylation of each methylated region, respectively, and quantified the number of counts in log2 across each sample with regulatory elements. This highlights genes that have been identified as IS, differentially expressed and differentially methylated to identify trends between analyses. While no gene shares characteristics between all three data sets, common trends are identified between two data sets, highlighting the genotoxic potential of genes.
To assign these pathways to each vector as a measure of genotoxicity, GO term or KEGG enrichment analysis on these tumour suppressor genes in IS data (n = 717) identified DNA repair pathways important to DNA damage mainly enriched in pHR infected iPSC in contrast to pHV iPSC or HLC infected cells. In pHV infected iPSC, tumour suppressor genes were enriched that were characteristic of positive regulation of autophagy (Day 3) and negative regulation of cell proliferation (Day 30), suggesting a protective role against carcinogenesis. Importantly, hepatocellular carcinoma-associated tumour suppressor gene pathways were found enriched only in pHV infected HLC only, again indicating genotoxic potential for this vector (Fig. S5).
Comments (0)