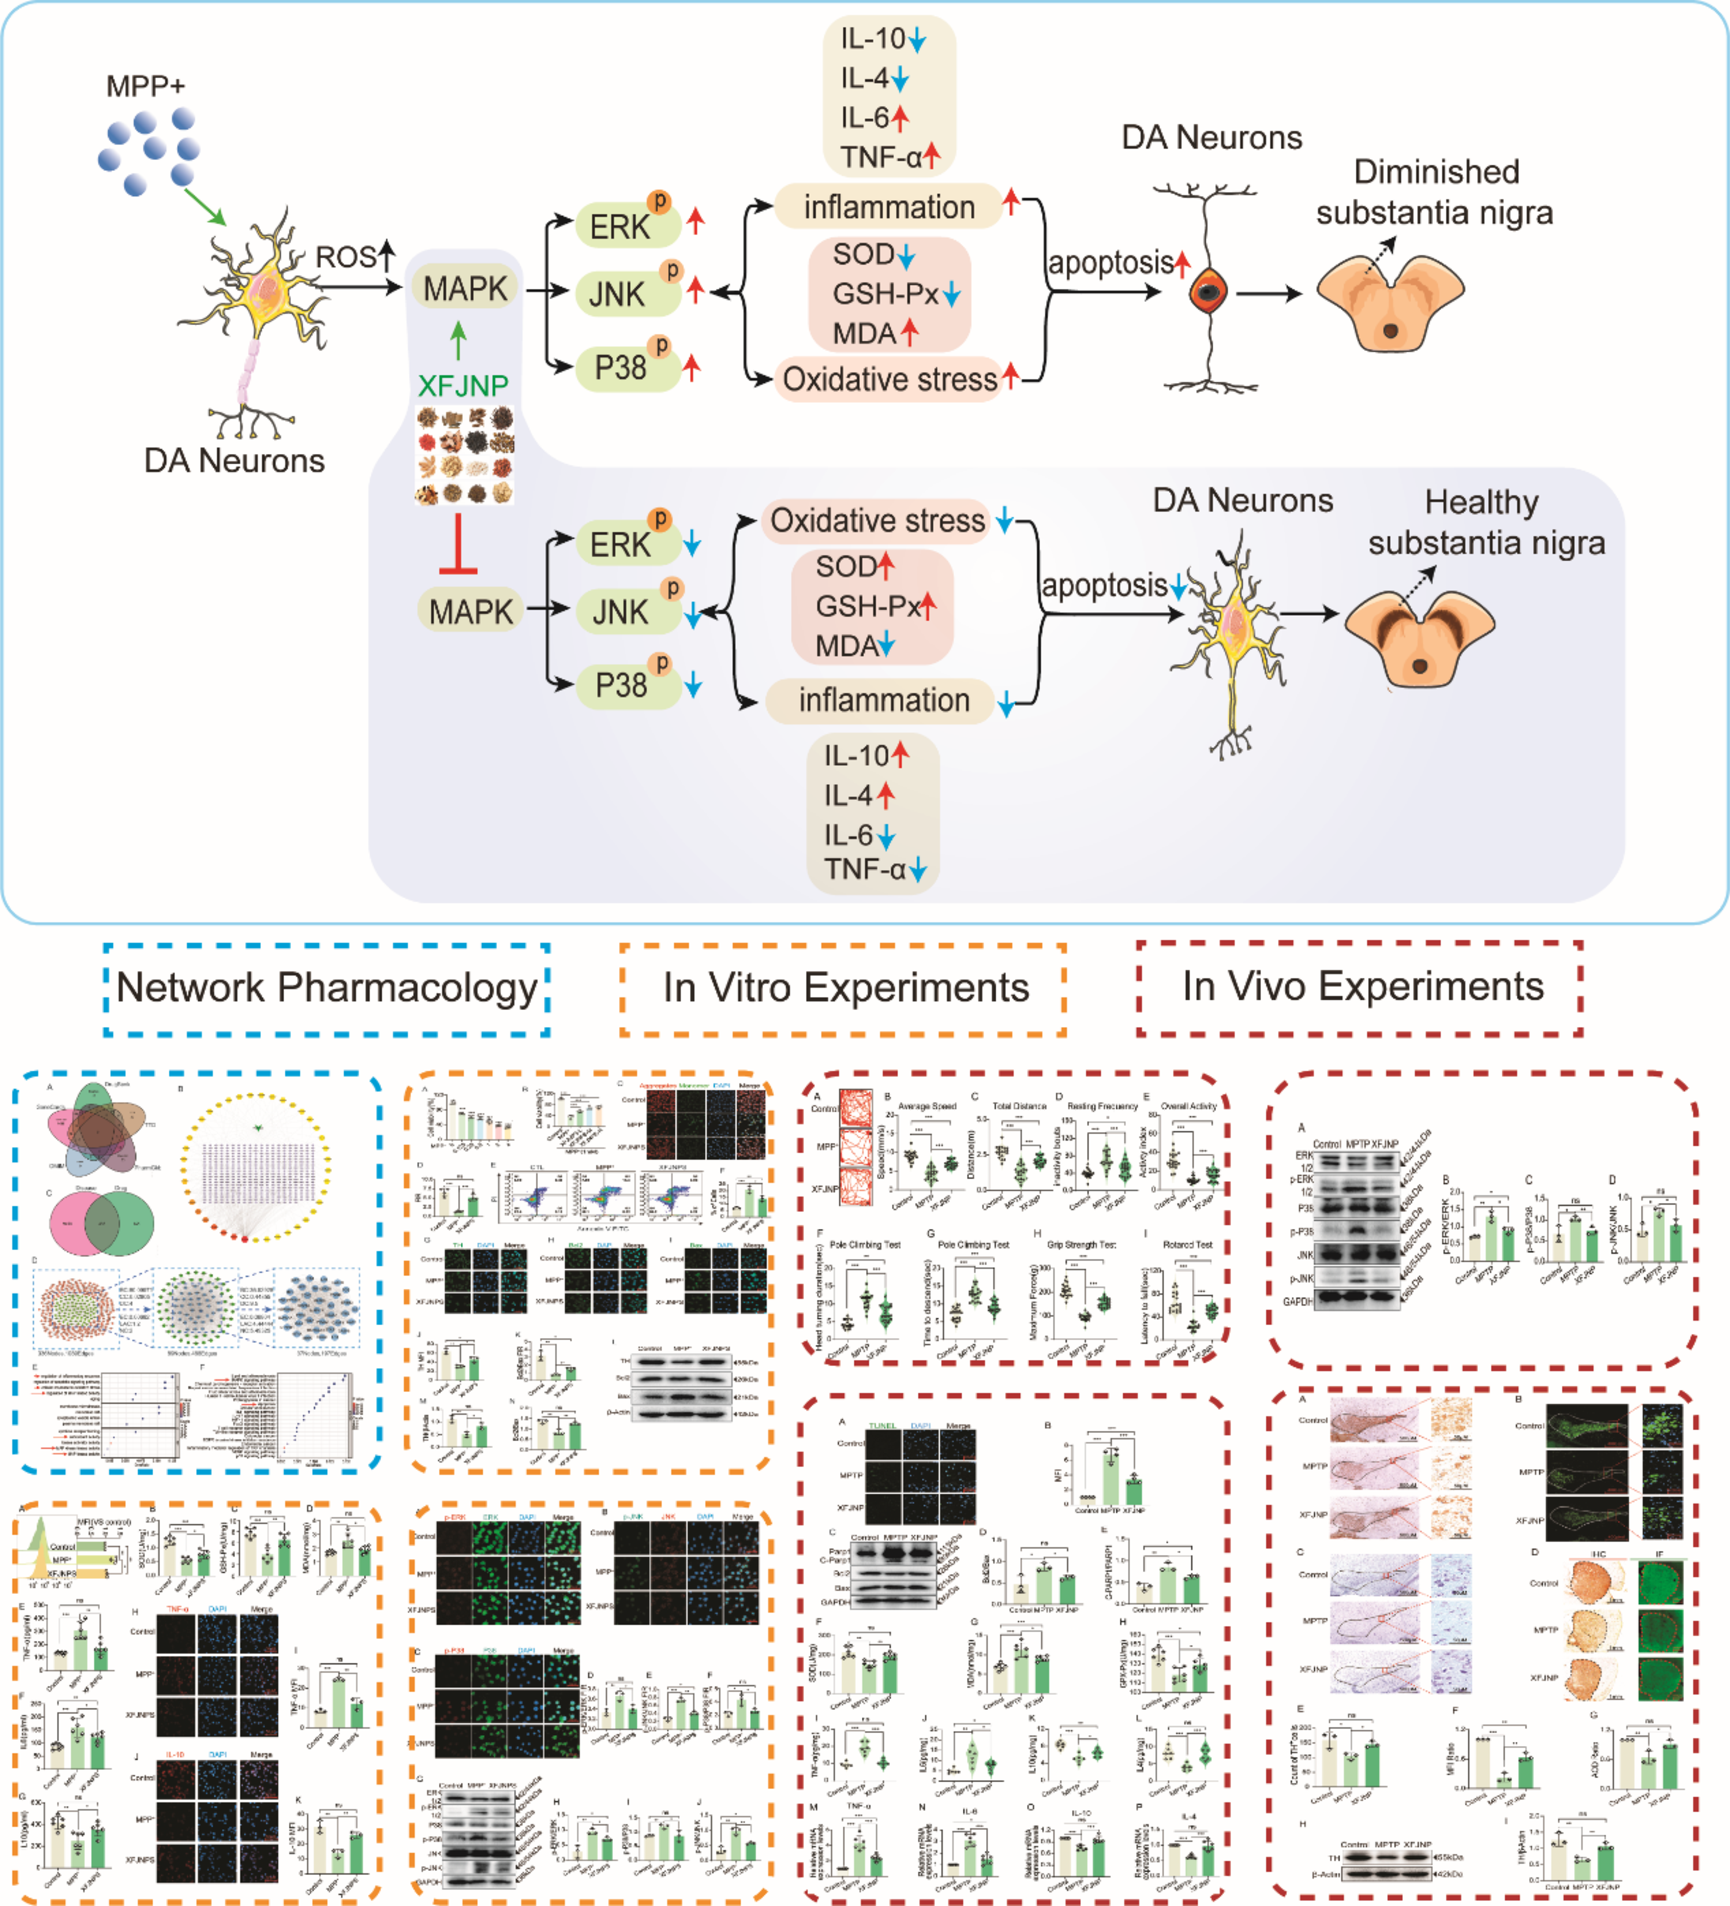
Network pharmacology analysis of XFJNP for PD
Identification of Active Components and Targets of XFJNP: Active components of Di Long, Hong Jing Tian, and Shi Jue Ming were obtained from the SYMmap database (http://www.symmap.org/), while data for He Huan Pi and Tian Ma were sourced from the Herb database (http://www.herb.org/). SMILES (Simplified Molecular Input Line Entry System) identifiers were retrieved from the PubChem database (https://pubchem.ncbi.nlm.nih.gov) and used in Swiss Target Prediction (http://www.swisstargetprediction.ch) to predict potential biological targets. Additional active components were identified using the TCMSP platform (http://lsp.nwu.edu.cn/tcmsp.php) based on the criteria of oral bioavailability (OB) ≥ 30% and drug-likeness (DL) ≥ 0.18. Protein targets were subsequently annotated through the UniProt database (https://www.uniprot.org), and duplicates were removed to create a refined list of target proteins for analysis.
Prediction of PD-Related Targets: Multiple databases, including GeneCards (https://www.genecards.org/), DrugBank (https://go.drugbank.com/), OMIM (https://www.omim.org/), the Therapeutic Target Database (TTD, https://db.idrblab.org/ttd/), and PharmGKB (https://www.pharmgkb.org/), were utilized to identify targets associated with Parkinson’s disease. The search keyword “Parkinson’s Disease” was applied, and duplicate entries were excluded to establish a comprehensive list of PD-related targets.
Intersection Target Identification: Intersection targets between active components and PD-related targets were identified using the Venny tool (https://bioinfogp.cnb.csic.es/tools/venny/).
Component-Target Network Analysis: Compound-gene network files were created and imported into Cytoscape 3.10.2 for network topology analysis. The visualization parameters, including node color and size, were adjusted according to Degree values to construct a TCM component-target network diagram.
Construction and Topological Analysis of Protein-Protein Interaction (PPI) Network: Intersection genes were imported into the String database (https://string-db.org/) with the organism specified as Homo sapiens and a confidence threshold of 0.900 to establish PPI relationships. The resulting PPI data were imported into Cytoscape 3.10.2, where the Network Analyzer tool was used to calculate topological features such as Betweenness, Closeness, Degree, Eigenvector, Local Average Connectivity, and Network. Nodes with all six topological features exceeding the median were identified as core nodes, forming the PPI network diagram.
GO and KEGG Enrichment Analysis: The Bioconductor open-source platform (http://www.bioconductor.org/) within the R software environment was used to perform Gene Ontology (GO) and Kyoto Encyclopedia of Genes and Genomes (KEGG) functional enrichment analysis via the clusterProfiler, Stringin, and Pathview packages.
Reagents
XFJNP was sourced from Traditional Chinese Medicine Hospital of Binhai New Area(Tianjin, China)。.
Cell culture
SH-SY5Y cells, as a subclone derived from the neuroblastoma cell line SK-N-SH, exhibit neuron-like properties in terms of morphology, physiology, and biochemical functions. Their sensitivity to neurotoxins associated with PD, such as MPTP and 6-hydroxydopamine, allows them to mimic the neurodegenerative processes observed in this condition (Pandey et al. 2024). Consequently, we selected SH-SY5Y cells as our in vitro research model. The SH-SY5Y cells were purchased from Wuhan Pricella Biotechnology Co., Ltd. (Wuhan, China). SH-SY5Y cells were maintained in Dulbecco’s Modified Eagle Medium (DMEM) supplemented with 10% fetal bovine serum (FBS), 100 IU/mL penicillin, and 100 µg/mL streptomycin. The cells were cultured in a humidified incubator with 5% CO2 at 37 °C. All cell culture reagents were obtained from Life Technologies/Gibco Laboratories Co., Ltd. (Grand Island, New York). MPP+ was prepared as a 1 M stock solution in PBS and then diluted to the desired concentration with the culture medium for treatment. SH-SY5Y cells were seeded at a density of 1.0 × 10^5 cells/mL and treated with XFJNPS at concentrations of 5%, 10%, and 20% for 1 h. Subsequently, MPP+ (Shanghai Yuanye Bio-Technology, Shanghai, China) was added to the culture medium to achieve a final concentration of 1 mM (excluding CCK-8 assays). The cells were then exposed to MPP+ for an additional 24 h before conducting further cell assays.
Animal models
Male C57BL/6 mice (24–27 g, 8 weeks old) were obtained from Sipeifu Biotechnology Co., Ltd. (Beijing, China) and allowed to acclimate for one week prior to the experiments. The mice were housed five per cage with unrestricted access to standard chow and water. They were kept under controlled conditions with a constant temperature of 23 ± 1 °C and humidity of 60 ± 10%, on a 12-hour light/dark cycle (lights on from 07:30 to 19:30). All experimental procedures adhered strictly to the 3R principles and were conducted in accordance with the guidelines of the Institutional Animal Care and Use Committee of our institution.
Induction of PD animal model
PD was induced in mice by intraperitoneal injection of MPTP (Beyotime Biotechnology, Shanghai, China). MPTP was dissolved in sterile saline and administered at a dose of 30 mg/kg once daily for 5 consecutive days. Seven days after the last injection, the mice were randomly assigned to two groups (n = 20 per group): the MPTP model group and the XFJNP treatment group. Mice in the XFJNP group received oral XFJNP at a dose of 3.3 g/kg/day for 4 weeks. The control and model groups were given an equivalent volume of sterile saline.
Preparation of XFJNP-containing serum (XFJNPS)
The preparation of XFJNPS was adapted from a recent study (Liu et al. 2019). Briefly, 20 SPF-grade SD rats were administered XFJNP at a dose of 2.3 g/kg by gavage twice daily, with each dose being 1 mL. The control group received an equivalent volume of saline. The dosage was calculated using the “conversion of the initial dose to equivalent dose” method as described in the Experimental Methodology of Traditional Chinese Medicine Pharmacology (based on a human adult weight of 60 kg). After 7 days of treatment, blood was collected from the abdominal aorta within 1 h of the final gavage. Blood samples from all rats were pooled and centrifuged at 3000 rpm for 10 min at 4 °C. The serum was then filtered, inactivated at 56 °C for 30 min, and stored at −80 °C for future use.
Behavioral testsOpen field test
The open field test was conducted in a 30 cm × 30 cm arena (Beijing Zhishu Duobao Biotechnology Co., Ltd., Beijing, China). At the start of the test, each mouse was placed in the center of the arena, and its movements were recorded by a video camera for 5 min. After the experiment, the video recordings were analyzed to measure total distance traveled, average speed, activity index, and the number of resting bouts.
Pole test
Mice were placed head-up on a vertical pole (1 cm in diameter and 50 cm in length). The mice were trained to turn downward and climb down the entire length of the pole. Training sessions were conducted three times daily, with a 1-hour interval between sessions, for three consecutive days before the end of the treatment. After the treatment, the time taken for each mouse to turn downward and the time required to climb down the entire pole were recorded. Each mouse was tested three times, and the average of these trials was calculated as the final result.
Grip strength test
The grip strength of the mice’s forelimbs was measured using a grip strength meter (Beijing Zhishu Duobao Biotechnology Co., Ltd., Beijing, China). Each mouse was placed on the grip bar of the meter with its forelimbs. Once the mouse had a firm grip, it was gently pulled backward by the tail until it released the grip bar. The force exerted was recorded as the grip strength. This procedure was repeated three times for each mouse, and the average of the three measurements was calculated as the final result.
Rotarod test
During training, the rotarod (Beijing Zhishu Duobao Biotechnology Co., Ltd., Beijing, China) apparatus was set to a speed of 10 rpm for a duration of 5 min. Each mouse underwent training three times daily, with 1-hour intervals between sessions, for three consecutive days before the end of the treatment. For the actual test, the rotarod was programmed with a total test duration of 5 min, starting at an initial speed of 5 rpm and accelerating to 40 rpm over 2 min. The time each mouse remained on the rotating rod was recorded. Each mouse was tested three times, and the average of these times was calculated as the final result.
Cell counting kit-8 (CCK8) assay
Cells (1 × 10^5 per well) were exposed to different concentrations of MPP+ or XFJNPS, either individually or in combination, for varying durations. XFJNPS was tested at concentrations of 5%, 10%, and 20% for 12 to 48 h, while MPP+ was tested at concentrations ranging from 0 to 4 mM for 24 h. After treatment, 10 µL of CCK-8 solution (Solarbio Life Sciences, Beijing, China) was added to each well and incubated at 37 °C for 1 h. The optical density was measured at 450 nm using a Bio-Rad spectrophotometer (California).
Mitochondrial membrane potential (ΔΨm) assay (JC-1 staining)
Cells cultured on coverslips were incubated with the JC-1 fluorescent probe using a Mitochondrial Membrane Potential Assay Kit (Beyotime Biotechnology, Shanghai, China). After incubation, the cells were washed and mounted with DAPI. The fluorescence intensities of JC-1 monomers and aggregates were analyzed using a laser scanning confocal microscope (Carl Zeiss AG, Germany) with excitation/emission wavelengths of 490/530 nm and 525/590 nm, respectively.
ELISA kits
Following the manufacturer’s instructions, the levels of inflammatory cytokines, including Tumor Necrosis Factor-α (TNF-α), Interleukin-10 (IL-10), Interleukin-6 (IL-6), and Interleukin-4 (IL-4) in tissue and cell samples were measured. All ELISA kits were procured from Beijing Solarbio Science & Technology Co., Ltd. (Beijing, China).
OS marker level/activity measurement
Following the instructions provided with the kits, the levels of antioxidant enzymes and oxidative stress markers, including malondialdehyde (MDA), superoxide dismutase (SOD), and glutathione peroxidase (GSH-Px), were measured. All kits were procured from Wuhan Elabscience Biotechnology Co., Ltd. (Wuhan, China).
Western blotting
Brain tissue from each group was homogenized in radio-immunoprecipitation assay lysis buffer (Beyotime Biotechnology, Shanghai, China). After centrifugation at 14,000 rpm for 15 min at 4 °C, the supernatant was collected, and the protein concentration was quantified using the BCA (Bicinchoninic Acid) assay. Equal amounts of protein were separated by sodium dodecyl sulfate-polyacrylamide gel electrophoresis. Following electrophoresis, proteins were transferred to a polyvinylidene fluoride membrane. The membrane was blocked with 5% non-fat milk at room temperature for 1 h, then incubated overnight at 4 °C with primary antibodies. Subsequently, the membrane was incubated with horseradish peroxidase (HRP)-conjugated secondary antibodies at room temperature for 1 h. Protein bands were visualized using enhanced chemiluminescence (Zeta Life, California) and imaged. The antibodies used are listed in Table S1.
Immunofluorescence assay
Tissue sections or cells were first subjected to fixation, permeabilization, and blocking. The samples were then incubated with primary antibodies, followed by incubation with secondary antibodies conjugated to CoraLite® Plus 488 and/or CoraLite® Plus 594 (Proteintech Group, Wuhan, China). After incubation, the samples were mounted with an anti-fade mounting medium containing DAPI (Beyotime Biotechnology, Shanghai, China). Fluorescence imaging was conducted using a Zeiss confocal microscope (Carl Zeiss AG, Germany).
Terminal deoxynucleotidyl transferase dUTP nick end labeling (TUNEL) staining
Apoptosis in the nigral region of mouse brain tissues was assessed using a TUNEL staining kit (Beyotime Biotechnology, Shanghai, China). After TUNEL staining, nuclei were counterstained with DAPI. Fluorescence imaging was performed using a Zeiss confocal microscope (Carl Zeiss AG, Germany), where apoptotic cells appeared as green fluorescence at 520 nm, and nuclei were visualized as blue fluorescence at 460 nm.
Reverse transcription-polymerase chain reaction (RT-PCR)
Total RNA was extracted using an RNA extraction kit (Promega, Beijing, China) and reverse transcribed into cDNA following the TB Green Premix Ex Taq protocol (Takara, Shiga, Japan) using a PCR machine (Roche, Basel, Switzerland). The resulting cDNA was then mixed with primers and MasterMix (Solarbio Life Sciences, Beijing, China) and subjected to real-time PCR using a thermal cycler. The cycling conditions were as follows: initial denaturation at 95 °C for 10 min, followed by 35 cycles of denaturation at 95 °C for 15 s, and annealing/extension at 60 °C for 1 min. The primer sequences used are listed in Table S2.
Flow cytometry
Reactive oxygen species (ROS) levels were assessed using a ROS detection kit (Beyotime Biotechnology, Shanghai, China) following the manufacturer’s instructions. The analysis was performed with a flow cytometer (Beckman Coulter, Suzhou, China).
Nissl staining
Paraffin sections were first deparaffinized and rehydrated, then stained with Nissl Staining Solution (Beyotime Biotechnology, Shanghai, China) at 37 °C for 10 min. Following staining, sections were washed twice with distilled water and dehydrated in 95% ethanol for 5 s. The sections were then further dehydrated, cleared, and mounted. Staining was visualized under a microscope (Olympus BX53, Tokyo, Japan).
Data analysis
All data are presented as mean ± standard error of the mean (SEM). The mean values were compared utilizing one-way analysis of variance (ANOVA) in GraphPad Prism 9 software. Significance was set at p < 0.05.


Comments (0)