
Remember me


The pre-clinical rat model of PE, induced by L-NAME administration on gestational day, triggers a series of maternal and offspring physiological responses (Supplementary Fig.S1 and Fig.S2). Before induction, no significant differences in blood pressure or proteinuria were noted among groups. After L-NAME treatment from GD7 to GD19, the EOPE group showed significant increases in blood pressure, urine protein excretion, and embryonic mortality, along with elevated RI, PI, and sFlt-1 levels (P < 0.05), and decreases in PSV, EDV, PAPP-A, and PLGF levels (P < 0.05). The LOPE group, treated from GD14 to GD19, exhibited similar blood pressure and EDV changes with statistically significant differences from the control group (P < 0.05).
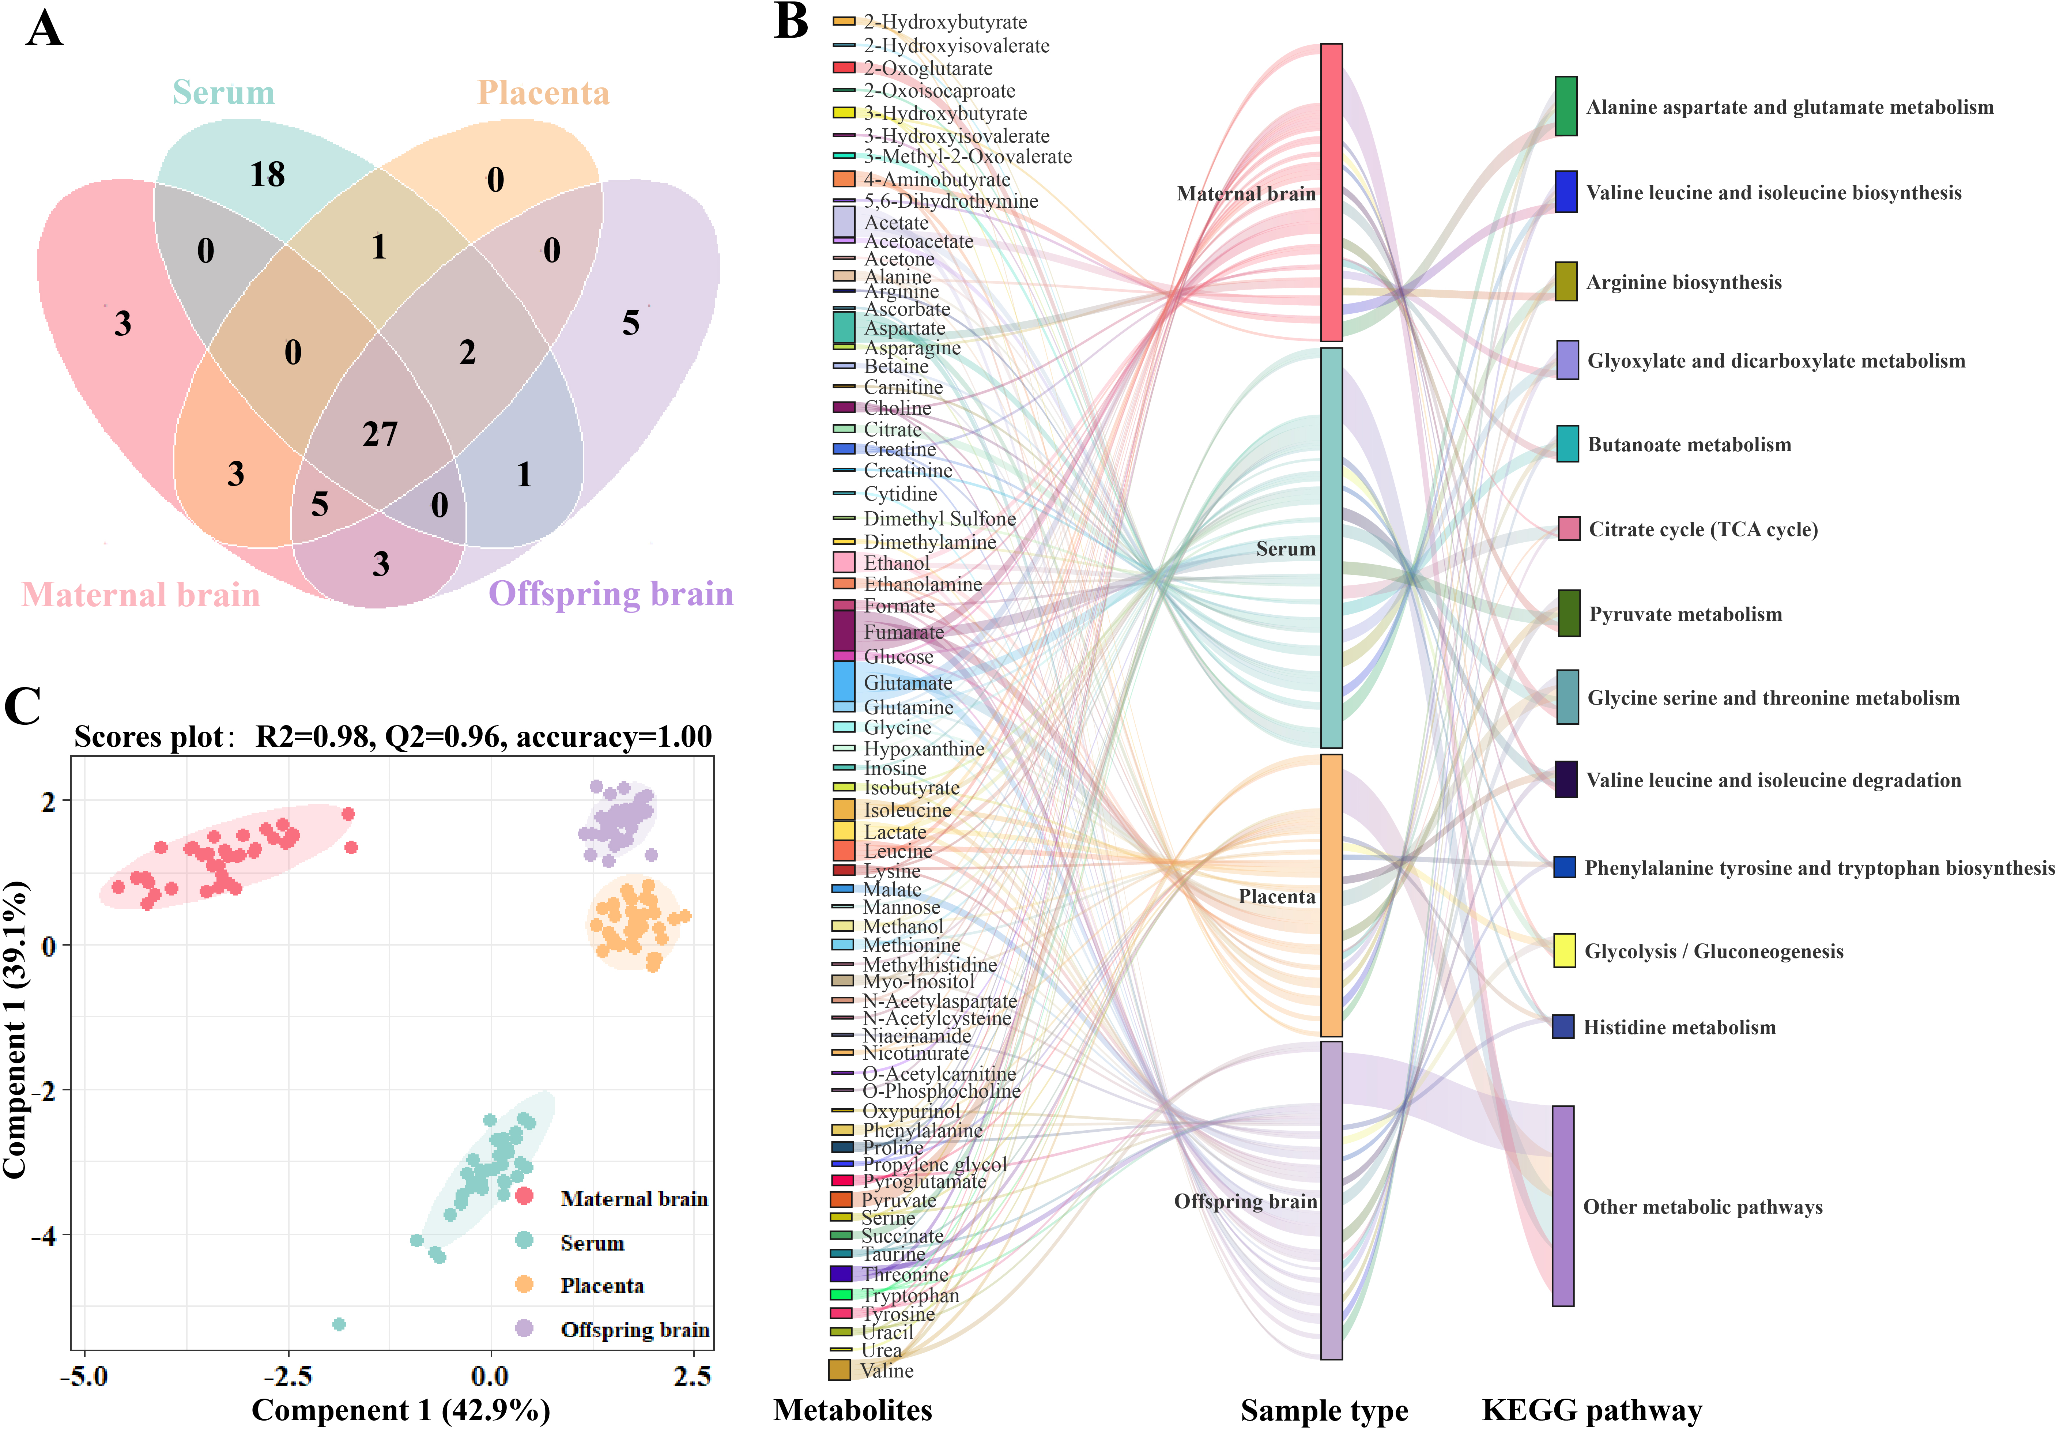
NMR spectra of multiple samplesUtilizing NMR-based metabolomics, we systematically characterized the metabolomic features of brain, serum, and placental tissues, as depicted in Fig. 1A and B, and Supplementary Tab.S1. We comprehensively identified a total of 68 metabolites in samples from various tissue types. Specifically, 41 metabolites were identified in the brain tissue of maternal rats, 49 in the serum, 38 in the placental tissue, and 43 in the brain tissue of offspring rats. Notably, 27 metabolites were detected across all tissue types. Moreover, our study revealed the predominance of amino acid, carbohydrate, and branched-chain amino acid metabolic pathways. Serum demonstrated remarkable metabolic diversity, including 18 unique metabolites pivotal to the urea cycle, creatine metabolism, ammonia metabolism, and glycolipid pathways. Both maternal and offspring brain tissues were replete with neurotransmitter-associated compounds like 4-Aminobutyrate, alongside their precursors Choline and Ethanolamine, which are integral to neurotransmitter synthesis. Notably, maternal brain tissue specifically harbored N-acetylcysteine and O-phosphocholine, implicated in neural signal transduction and repair, whereas offspring brain tissue contained Ascorbate and Niacinamide, key players in oxidative stress regulation. The placenta was distinguished by an enrichment of amino acids, Taurine, Hypoxanthine, and Nicotinurate, which were extensively involved in placental cell proliferation, differentiation, energy production, and neural conduction. The metabolic distinctiveness of these tissues was corroborated by the PLS-DA model, which also highlighted a notable similarity between placental and offspring brain tissue metabolic profiles, underpinned by robust statistical measures with an R2 value of 0.98 and a Q2 value of 0.96, as depicted in Fig. 1C.
Fig. 1
Metabolic Landscape and Discriminative Analysis in Maternal and Offspring Tissues in PE. (A) A Venn diagram illustrated the overlap and specificity of metabolic alterations across maternal brain, serum, placenta, and offspring brain, revealing distinct and shared metabolic features. (B) The Sankey diagram portrayed the distribution of metabolites among the sample types and their flux through the KEGG metabolic pathways, indicating the metabolic interconnectivity and pathway involvement. (C) PLS-DA score plots delineated the metabolic separation between maternal brain, serum, placenta, and offspring brain groups, underscoring the discriminatory power of the model. PE preeclampsia, KEGG Kyoto Encyclopedia of Genes and Genomes, PLS-DA partial least squares-discrimination analysis
Metabolic profile changes in maternal brain tissue of preeclamptic ratsWe employed the PLS-DA model to evaluate the differentiation effect of the maternal brain metabolic profile across different groups following L-NAME induction. As depicted in Fig. 2A, despite some overlap between groups, the metabolic profiles effectively distinguished between them, with a cross-validation Q2 of 0.74, an R2 of 0.90, and an accuracy of 89%; permutation testing yielded a P-value < 0.001. The differential metabolites for EOPE and LOPE, characterized by VIP values > 1.0 and adjusted P-values < 0.05, were presented in Fig. 2B C, and Supplementary Tab.S2. Among these, three metabolites—Choline, Glutamine, and Tyrosine—exhibited similar expression trends across both groups. However, EOPE and LOPE also displayed distinct expression patterns. For instance, Ethanol and Lactate were highly expressed in the EOPE group, while the essential amino acids Leucine and Phenylalanine were significantly reduced. In the LOPE group, Threonine, Glutamate, and Myo-Inositol were found to be differentially expressed. Furthermore, there were two metabolites, Ethanol and Myo-Inositol, that exhibited differential expression between the EOPE and LOPE groups. The differential metabolites in both the EOPE and LOPE groups were associated with several enriched pathways, including Phenylalanine, Tyrosine, and Tryptophan Biosynthesis, Phenylalanine Metabolism, Nitrogen Metabolism, and Valine, Leucine, and Isoleucine Biosynthesis. Additionally, the differential metabolites in the EOPE group were involved in Glycolysis/Gluconeogenesis and Pyruvate Metabolism (Fig. 2D). The metabolites unique to the LOPE group were implicated in Arginine Biosynthesis, Alanine, Aspartate, and Glutamate Metabolism, Glyoxylate and Dicotboxylate Metabolism, and Glycine, Serine, and Threonine Metabolism (Fig. 2D).
Fig. 2
Comparative maternal brain metabolic profiles induced by L-NAME in EOPE and LOPE rat models. (A) PLS-DA score plots revealed distinct metabolic profiles between the control, EOPE, and LOPE groups, with a focus on maternal brain tissue. (B) The Venn diagram vividly displays the shared and distinct significant metabolic shifts within the maternal brain across different PE groups. These significant metabolites are identified based on VIP > 1.0 and adjusted P < 0.05. (C) Fold-change differences, VIP values, and inter-group significance of metabolic products in the maternal brain tissues of three groups. (D) KEGG pathway enrichment analysis illustrated the enriched pathways in maternal brain tissue, with bubble size and color intensity representing the extent of impact and level of significance, respectively. L-NAME N-nitro-L-arginine methyl ester, EOPE early-onset preeclampsia, LOPE late-onset preeclampsia, PLS-DA partial least squares-discrimination analysis, VIP variable importance in the projection, KEGG Kyoto Encyclopedia of Genes and Genomes, FC fold-change
Serum metabolic profile variations in PE ratsSerum, the primary medium for inter-tissue communication, was analyzed to identify metabolic differences at various stages in response to L-NAME, with the aim of determining whether these changes mirrored those observed in the maternal brain. PE-induced serum metabolites exhibited significant group discrimination in the PLS-DA model, with excellent cross-validation accuracy (1.00), validated by permutation testing for statistical significance (P < 0.001), as shown in Fig. 3A. Figure 3B and C, and Supplementary Tab.S3 detailed the differential serum metabolites, where the EOPE and LOPE groups shared four common ones: Tryptophan, Isobutyrate, and Lactate, which were down-regulated, while Betaine was up-regulated. Reflecting the brain’s metabolic profile, distinct differential metabolite expression patterns were observed, including the significant down-regulation of the essential amino acid Lysine in the EOPE group and the up-regulation of Tyrosine. In the LOPE group, non-essential amino acids Methionine and Aspartate were notably down-regulated. KEGG pathway enrichment analysis revealed shared metabolic pathways between the EOPE and LOPE groups, encompassing Phenylalanine metabolism, Tyrosine and Tryptophan biosynthesis, Butanoate metabolism, Glycolysis/Gluconeogenesis, and Nitrogen metabolism. In the LOPE group, Pyruvate metabolism, Cysteine and Methionine metabolism, and Alanine, Aspartate, and Glutamate pathways were significantly down-regulated, indicating the TCA cycle was also affected (Fig. 3D). Interestingly, except for Phenylalanine, which showed consistent expression, brain and serum differential metabolites in PE rats often exhibited opposite regulation trends. For example, Glutamine, Lactate, and Tyrosine exhibited contrasting expression patterns between the brain and serum in the EOPE group. In the LOPE group, Glutamate and Choline were up-regulated in the maternal brain but were significantly down-regulated in the serum.
Fig. 3
Comparative serum metabolic profiles induced by L-NAME in EOPE and LOPE rat models. (A) PLS-DA score plots distinguished the control, EOPE, and LOPE groups based on serum metabolites. (B) The Venn diagram clearly demonstrates the common and distinct significant metabolic alterations in the serum across diverse PE groups. The significant metabolites here are identified based on VIP > 1.0 and an adjusted P < 0.05. (C) The fold-change differences, VIP values, and inter-group significance of the metabolic products in the serum of three groups are presented. (D) KEGG pathway analysis displayed affected pathways, with bubble size and color indicating impact and significance. L-NAME N-nitro-L-arginine methyl ester, EOPE early-onset preeclampsia, LOPE late-onset preeclampsia, PLS-DA partial least squares-discrimination analysis, VIP variable importance in the projection, KEGG Kyoto Encyclopedia of Genes and Genomes, FC fold-change
Changes of placental metabolic profile in PE ratsPE, a placental-origin disease, may involve placental metabolic disorders that play a significant role in its onset and in maternal-fetal neurological complications (Hu et al. 2024). Our analysis of the placental metabolic profiles in PE rats revealed distinct patterns. The PLS-DA scores plot showed significant overlap between the EOPE group and the control group, while the LOPE group was markedly separated from the others, with cross-validation for a one-component model yielding an accuracy of 0.81 and permutation testing indicating significance (P = 0.007) (Fig. 4A). Similarly, the discrepancies in differential metabolites between the EOPE and LOPE groups were more pronounced in the placenta, with Lactate being the only metabolite significantly upregulated in both groups, aligning with its expression trend in maternal brain tissue (Fig. 4B&C; Supplementary Tab.S4). The unique differential metabolites in the EOPE group—Ethanol, Creatine, and Lysine—are primarily involved in energy metabolism and essential amino acid metabolism. In contrast, the unique differential metabolites in the LOPE group—Phenylalanine, Glycine, Isoleucine, and Tyrosine—are mainly engaged in the metabolism of both essential and non-essential amino acids. Disruptions in energy metabolism, specifically Pyruvate metabolism and Glycolysis/Gluconeogenesis, are common metabolic pathway characteristics of both EOPE and LOPE placentae (Fig. 4D). Additionally, there are divergences in the metabolic pathways of amino acids and non-essential amino acids between the two groups.
Fig. 4
Placental metabolic profiles in response to L-NAME-induced PE in rats. (A) OPLS-DA score plots revealed distinctions in placental metabolites among control, EOPE, and LOPE groups. (B) The Venn diagram effectively exhibits the shared and unique significant metabolic changes within the placenta among various PE groups. Metabolites with VIP > 1.0 and adjusted P < 0.05 were considered significant. (C) Presents fold-change differences, VIP values, and inter-group significance of placental metabolic products in three rat groups. (D) KEGG pathway enrichment analysis identified affected pathways, using bubble size and color to denote pathway impact and significance. L-NAME N-nitro-L-arginine methyl ester, EOPE early-onset preeclampsia, LOPE late-onset preeclampsia, PLS-DA partial least squares-discrimination analysis, VIP variable importance in the projection, KEGG Kyoto Encyclopedia of Genes and Genomes, FC fold-change
Changes in the offspring brain metabolic profile in PEThe offspring brain metabolism is a significant focus of our study. On the PLS-DA plot, we can see a clear distinction between different groups, but the model’s performance in cross-validation (Q2 = 0.43, R2 = 0.79, accuracy = 0.59) and permutation testing with a P-value of 0.01 is not ideal, indicating a certain degree of overfitting (Fig. 5A). Although the offspring brain PLS-DA model cannot be used to screen for molecular markers related to offspring brain damage, it can still be used to assess whether metabolites remain significant in multivariate analysis. We observed that, compared to the control group, only Isoleucine was significantly downregulated in the EOPE group. The metabolic differences between the LOPE group and the EOPE group did not overlap; 3-Hydroxybutyrate, Choline, Glutamine, Glycine, and Lysine were the differential metabolites in the LOPE group. Upon comparing the LOPE and EOPE groups, we found that the metabolic differences were primarily concentrated in the changes of essential amino acids (Isoleucine, Phenylalanine, Valine) and non-essential amino acids (Glutamine, Proline), as well as the corresponding metabolic pathway alterations (Fig. 5B, C&D; Supplementary Tab.S5).
Fig. 5
Metabolic alterations induced by L-NAME in the offspring brain of EOPE and LOPE rat models. (A) OPLS-DA score plots differentiated between the control, EOPE, and LOPE groups. (B) Venn diagram showcases common and specific significant brain metabolic shifts in offspring rats across PE groups. Metabolites discerned by VIP > 1.0 and adjusted P < 0.05. (C) Compares fold-change of metabolite contents in 3 groups of offspring rat brain tissues and shows statistical values. (D) KEGG pathway enrichment analysis indicated the affected pathways, with bubble size and color reflecting the impact and significance of the pathways, respectively. L-NAME N-nitro-L-arginine methyl ester, EOPE early-onset preeclampsia, LOPE late-onset preeclampsia, PLS-DA partial least squares-discrimination analysis, VIP variable importance in the projection, KEGG Kyoto Encyclopedia of Genes and Genomes, FC fold-change
Cross-talk of metabolic correlations within and between maternal and offspring tissues in EOPE and LOPE ratsTo explore metabolite interactions within and between tissues in PE rats, we conducted Spearman correlation analysis on the control, EOPE, and LOPE groups (Fig. 6A). The three groups showed distinct intra-and inter-group metabolic correlation characteristics. In the EOPE group, there were 741 significantly correlated metabolite pairs (295 intra-tissue and 446 inter-tissue), more than in the control group, indicating extensive metabolic exchanges and reprogramming. Conversely, in the LOPE group, the numbers dropped to 169 and 176, respectively.
Fig. 6
Comprehensive analysis of metabolite correlations and metabolic pathway interactions among different tissue groups. (A) Spearman correlation distribution and correlation clustering of all metabolites among and within three groups of tissues. The correlation heatmap depicts strongly correlated metabolites among and within different tissues, with an absolute value of the correlation coefficient > 0.07 and p < 0.05. Red squares indicate positive correlations between metabolites, while blue squares represent negative correlations. Lines represent the DBSCAN clustering of metabolites. Cluster names in red denote that the metabolites in the cluster are from different tissues, and those in black indicate that the metabolites are from the same tissue. The table in the upper-right corner shows the number of strongly correlated metabolite pairs among tissues within different groups, the number of strongly correlated metabolite pairs within tissues, and the corresponding statistical values. (B) DSPC network analysis of different tissues in the EOPE and LOPE groups, which reveals the interactions of metabolites within and between tissue types. (C) Metabolic trajectory changes of the dominant metabolite clusters in the EOPE and LOPE groups. (D) The radar chart shows the tissue-specific enrichment KEGG trajectory changes of differential metabolites between the EOPE and LOPE groups. (E) Metabolic trajectory changes of three types of significantly enriched differential metabolites in the EOPE and LOPE groups. The y axis indicates the log₂ fold - change (FC) of the levels of each differential metabolite in the EOPE or LOPE group compared to the control groups. DBSCAN Density-Based Spatial Clustering of Applications with Noise, DSPC Debiased Sparse Partial Correlation, EOPE early-onset preeclampsia, LOPE late-onset preeclampsia, FC fold-change, KEGG Kyoto Encyclopedia of Genes and Genomes
Intra-tissue correlation analysisWe used the DBSCAN algorithm for intra-tissue correlation analysis. Under normal pregnancy, maternal brain metabolic correlations mainly involved energy metabolism (Cluster 2: Lactate, Creatine) and amino acid synthesis (Lysine, Glycine), while the offspring brain focused on amino acid synthesis regulation (Cluster 11: Asparagine, Serine, Threonine, Tryptophan). In EOPE, maternal brain Cluster 3’s up-regulated Glutamate was significantly correlated with 5,6-Dihydrothymine, hinting at potential DNA damage. In the offspring brain, Cluster 11’s Ethanolamine-Tryptophan correlation increased, both related to neural development. In LOPE, the maternal brain clustered into energy metabolism related clusters (Cluster 1: Lactate, Creatine; Cluster 5: Lysine, Taurine, Glycine) and an oxidative stress/DNA damage related cluster (Cluster 6: 5,6-Dihydrothymine, Nicotinurate).
Inter-tissue metabolite interactionsCompared to intra-tissue interactions, all three groups had extensive inter-tissue metabolite exchanges between the maternal brain and serum, placenta, and offspring brain. In the control group, we identified 4 inter-tissue interaction clusters. Maternal brain metabolites (Valine, Ethanol, Tyrosine, Nicotinurate) were significantly correlated with others. In dominant Cluster 1, maternal Valine and Ethanol interacted with 7 serum, 2 placental, and 14 offspring brain metabolites. In Cluster 3, Tyrosine interacted with offspring brain Glutamate and Inositol, and in Cluster 5, Nicotinurate correlated with placental Ethanolamine.
In EOPE, 7 maternal brain metabolites (Valine, Alanine, Nicotinurate) changed inter-tissue interactions, interacting with 6 serum, 13 placental, and 8 offspring brain metabolites. In dominant Cluster 2, the placental metabolite proportion (41.38%) was significantly higher than in normal-group Cluster 1 (8.00%, Chi-square: 9.978, P < 0.05). Cluster 5 suggested a close maternal brain Methanol-N-Acetylcysteine-offspring brain Choline relationship. The EOPE group’s dominant Cluster 8 (3 serum and 8 offspring brain metabolites) may imply that the offspring brain seeks external help via serum during placental dysfunction.
In the LOPE group, maternal brain metabolites Glutamine, Ethanol, Choline, and Glutamate correlated with others in three clusters. In dominant Cluster 3, Ethanol and Choline correlated with 22 offspring brain, 6 placental, and 3 serum metabolites, similar to the control-group Cluster 1’s offspring-derived components. Notably, when comparing the LOPE group with the EOPE and control groups, we observed that in the inter-tissue interaction clusters of LOPE, placental components seemed to be isolated. Specifically, 17 placental metabolites independently formed an intra-tissue Cluster 15, which further suggested the isolated state of placental metabolism in the LOPE condition.
DSPC network analysisWe used DSPC network analysis to show metabolite connection patterns and intensities across tissues (Fig. 6B). In the normal group, intra-and inter-tissue interactions had clear boundaries. In Cluster 1, offspring brain Lysine-Methionine, serum Betaine, and placental Choline were crucial for cross-tissue metabolism. The network also showed maternal brain Ethanol and Valine correlations with placental metabolites in normal-group Cluster 1. In EOPE, inter-tissue metabolite interactions were more complex. Maternal brain metabolites were affected by multiple tissues; e.g., Cluster 2’s Nicotiniurate was influenced by offspring brain 4-Aminobutyrate, N-Acetylaspartate, and placental Glutamate. Alanine was affected by serum Lactate, and Aspartate was affected by placental Glutamine. In LOPE, inter-group interaction nodes and edges decreased, and placental metabolite numbers were lower, supporting reduced placental metabolism influence.
Verification of placental involvement in cross-talkTo verify placental involvement in maternal-offspring brain cross-talk and its isolation in LOPE, we calculated Euclidean and Manhattan distances between tissues (Supplementary Fig.S3). During normal pregnancy, the maternal brain and placenta had similar metabolic patterns (Euclidean: 9.51, Manhattan: 52.73), and the offspring brain was also close (Euclidean: 10.78, Manhattan: 70.36). In EOPE, placental metabolic changes affected the maternal (Euclidean: 9.99, Manhattan: 58.68) and offspring (Euclidean: 11.97, Manhattan: 66.51) brains. In LOPE, the placenta’s role weakened; the maternal and offspring brains were more similar to serum in Euclidean distance, and most similar to each other in Manhattan distance (61.37).
Exchange and trajectory changes of differential metabolites and their KEGG pathway associations in maternal-offspring tissues of EOPE and LOPE ratsWe identified the key metabolites that can distinguish the PE state from the normal state, as well as the EOPE and LOPE states, through the trajectory analysis of dominant clusters and differential metabolites enriched in KEGG pathways. First, we focused on the differential metabolites in the dominant clusters of the three groups in inter-tissue interactions (Cluster 1 in the normal group, Cluster 2 in the EOPE group, and Cluster 3 in the LOPE group) to observe the metabolic trajectory changes between different tissues in rats under different states and the co-regulated metabolites under different states (Fig. 6C). We identified a series of differential metabolites with correlated metabolic trajectories that exhibited similar patterns in both the LOPE and EOPE groups (correlation coefficient > 0.07 and P < 0.05). For example, in Cluster 1, Glutamine-Tyrosine-Glutamate and Phenylalanine-Lysine-Proline- Isoleucine-Ethanol showed such correlations; in Cluster 2, it was Lysine-3-Hydroxybutyrate and Glutamine-Choline-Tyrosine; and in Cluster 3, Choline-Ethanolamine-Glutamine-Creatine-3- Hydroxybutyrate-Proline-Lysine-Valine. Monitoring the correlations of the metabolic trajectories of these metabolites in different tissues may provide a method for detecting the onset of PE.
Secondly, the metabolic pathways of differentially-expressed metabolites in the EOPE and LOPE groups mainly included amino acid metabolism and synthesis, carbohydrate metabolism, and Fatty acid-related metabolic pathways (Fig. 6D). In terms of amino acid metabolism and synthesis, the EOPE and LOPE groups exhibited comparable distribution profiles across different tissues in several metabolic pathways, including arginine synthesis, alanine, aspartate, and glutamate metabolism, as well as glycine, serine, and threonine metabolism. However, they had different metabolic profiles in phenylalanine, tyrosine and tryptophan biosynthesis and valine, leucine and isoleucine biosynthesis. In EOPE, the former was mainly enriched in the maternal brain and serum, while in LOPE, it was enriched in the placenta. The latter was mainly enriched in the offspring brain in EOPE and in the placenta in LOPE. At the level of carbohydrate metabolism, distinct differences were observed between the EOPE and LOPE groups. In the EOPE group, the maternal brain exhibited pronounced glycolysis/gluconeogenesis and pyruvate metabolism, accompanied by the up-regulation of differentially expressed metabolites ethanol and lactate. These phenomena suggest that EOPE is associated with more severe energy metabolism disorders and neural damage in the brain compared to LOPE. Conversely, the LOPE group showed a different metabolic profile. It had more abundant glyoxylate and dicarboxylate metabolism in various tissues. This difference in glyoxylate and dicarboxylate metabolism further distinguishes the carbohydrate metabolism patterns between the two groups. Moreover, the LOPE group also had a relatively higher presence of fatty acids and organic acid metabolites, indicating a shift towards different energy-related metabolic pathways in comparison to the EOPE group.
Further, we conducted a more in-depth trajectory analysis of the differentially-expressed metabolites in the above-mentioned metabolic pathways (Fig. 6E). In amino acid metabolism, the metabolic trajectories of Choline-Creatine-Aspartate-Tyrosine-Glutamine-Glutamate exhibited a consistent pattern across the PE groups. The main difference between the two groups was that the EOPE group showed a correlation in the metabolic trajectories of branched-chain amino acids Valine-Leucine-Isoleucine and amino acids Phenylalanine-Glycine, while the LOPE group did not. In terms of carbon metabolism, both groups had the same Ethanol-Glutamate-Lactate-Glutamine, and the correlated metabolic trajectory changes of Acetate-Ethanol and Acetate-Glycine were the key to distinguishing EOPE from LOPE.
Comments (0)