Patients and clinical data
This study was conducted in accordance with the Council for International Organizations of Medical Sciences International Ethical Guidelines for Biomedical Research Involving Human Subjects. The procedures were performed according to a protocol approved by the Ethics Committee of the First Affiliated Hospital of Nanjing Medical University (Nanjing, China; 2023-SR-031). Written informed consent was obtained from all participants.
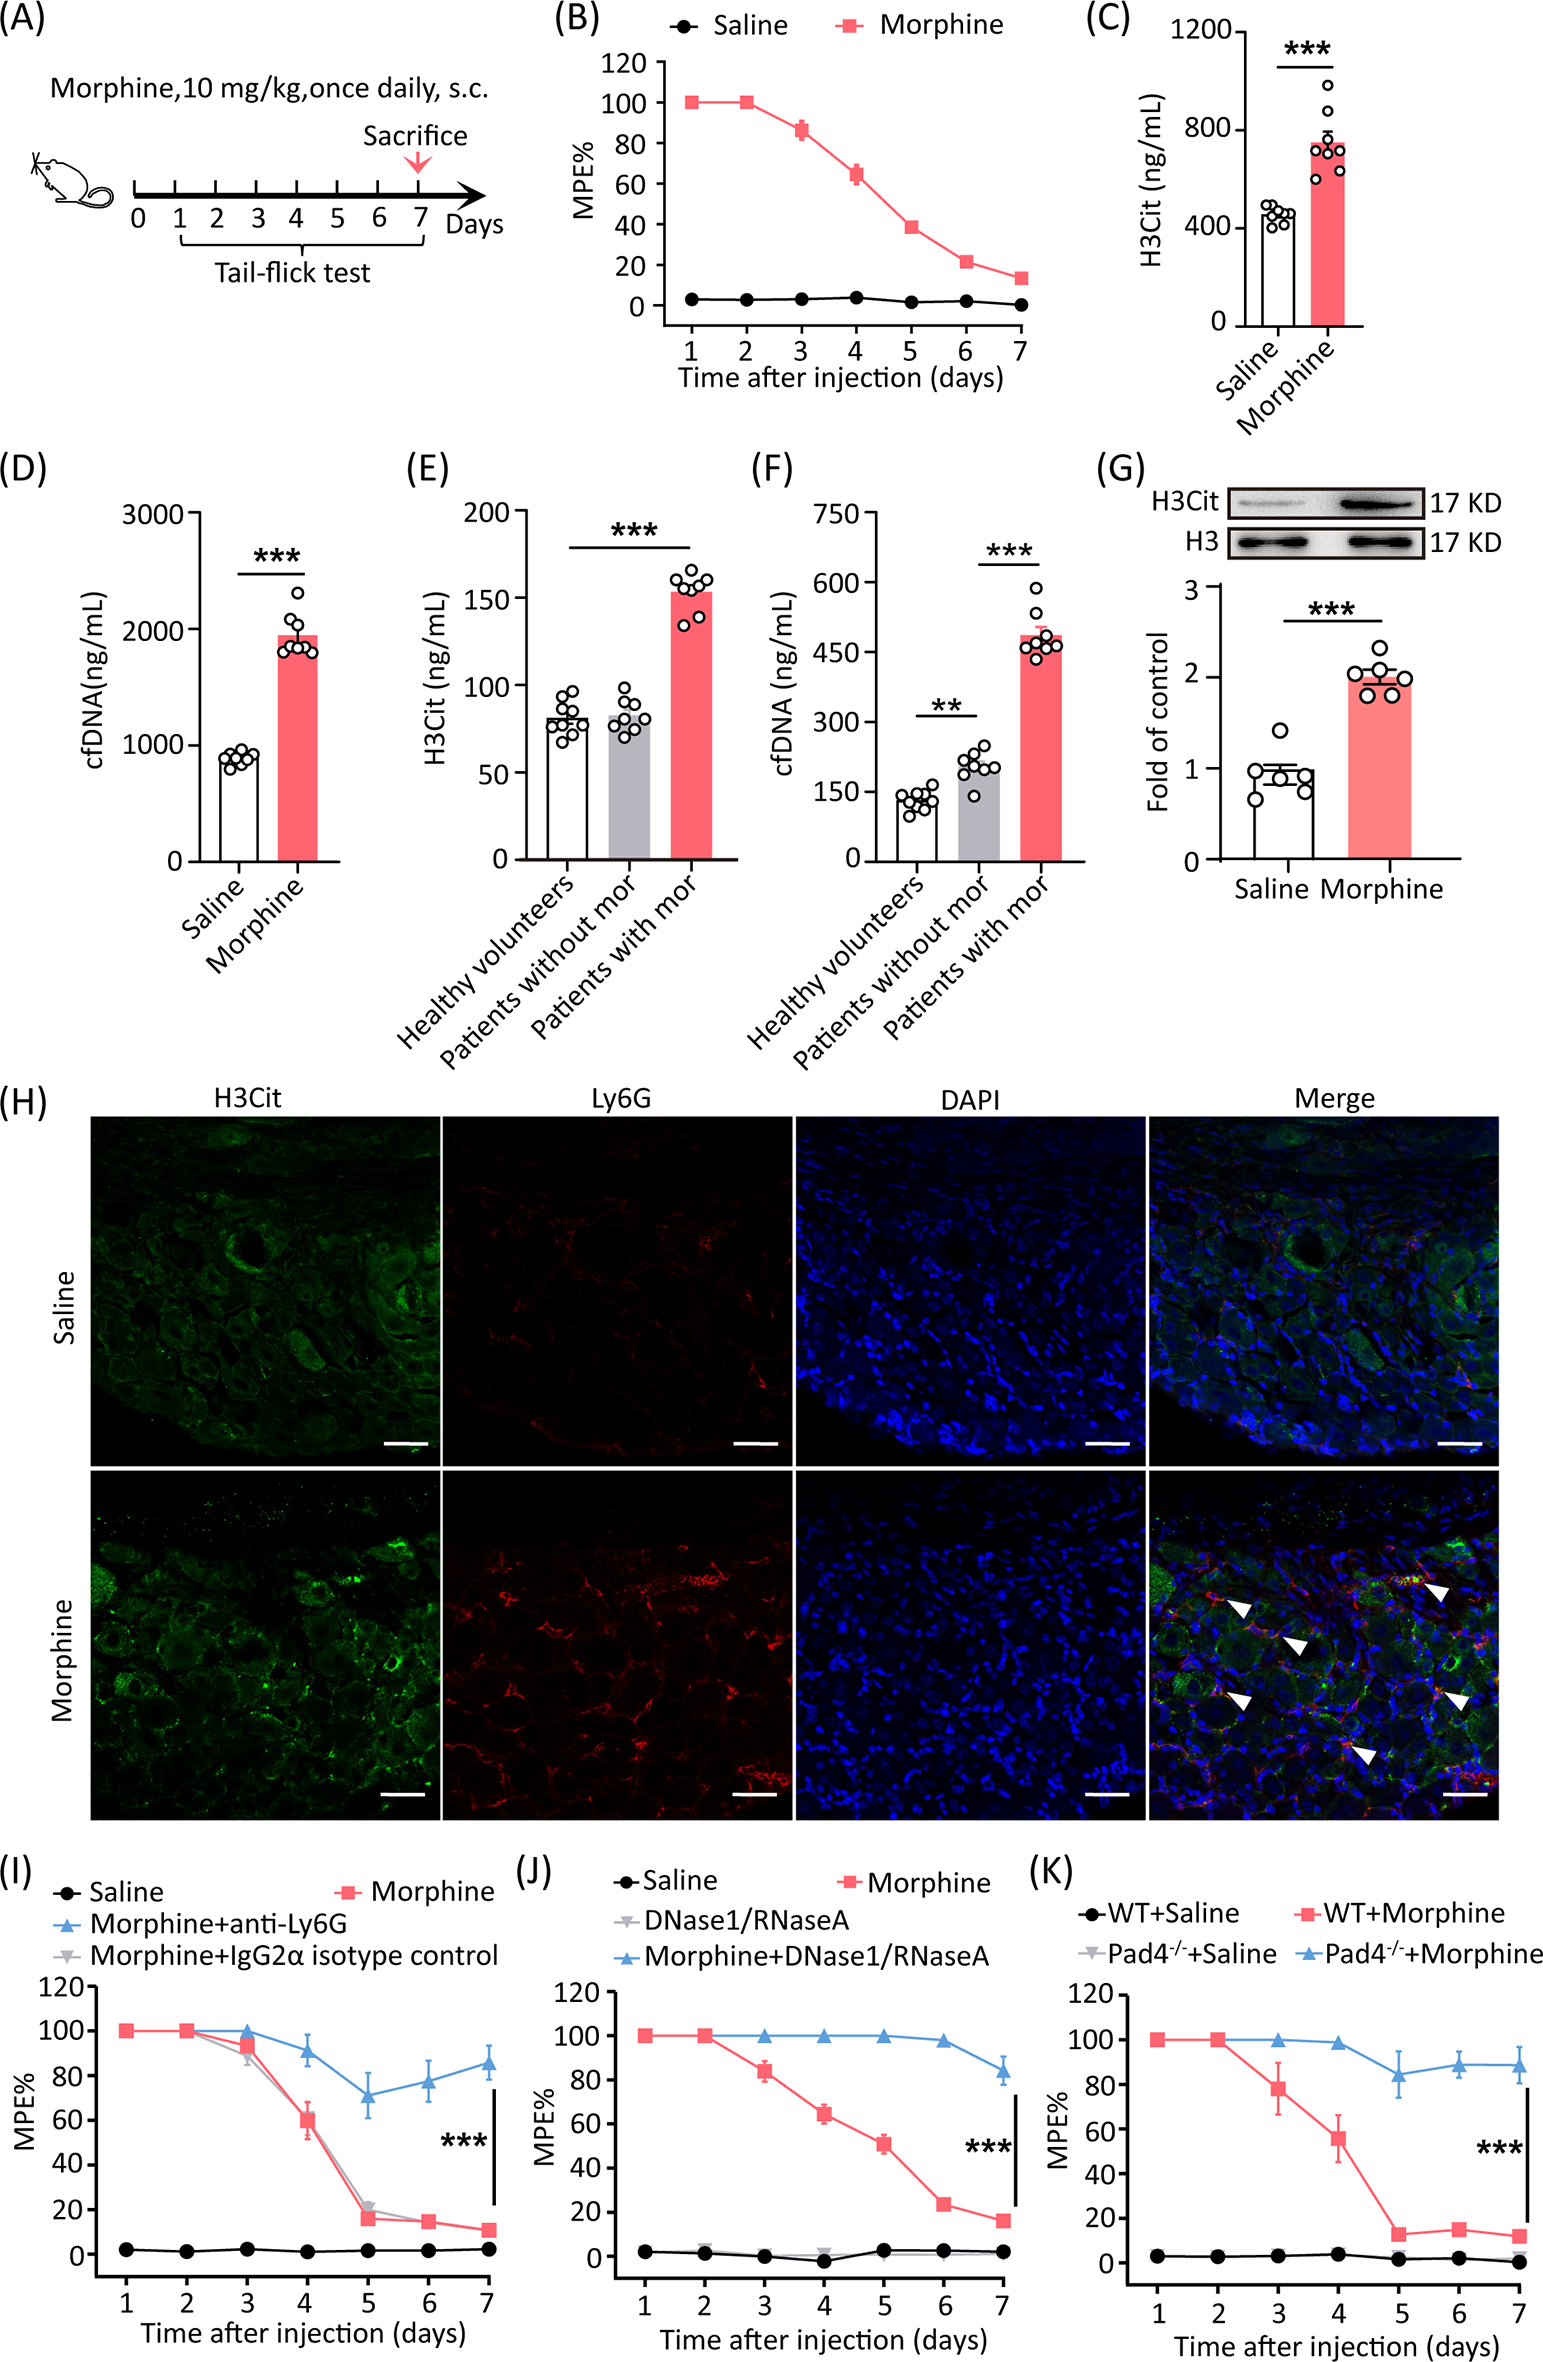
Peripheral blood samples were collected from 16 patients (8 with pain but no morphine treatment, and 8 with pain who had received morphine treatment) and 9 healthy adult volunteers. Plasma was separated by centrifugation at 3000 rpm for 5 min and then stored at -80 °C for all experiments.
Animals and the morphine tolerance model
All procedures were performed in strict accordance with the regulations of the ethics committee of the International Association for the Study of Pain (IASP) and the Guide for the Care and Use of Laboratory Animals (The Ministry of Science and Technology of China, 2006). All animal experiments were approved by the Nanjing Medical University Animal Care and Use Committee (No. IACUC-2203057-1) and were designed to minimize suffering and the number of animals used.
All animals used in experiments were male. Adult C57BL/6J mice (20–25 g wild type) were purchased from the Animal Core Facility of Nanjing Medical University, Nanjing, China. Pad4−/− mice were purchased from Jackson Laboratory (030315). Nlrp3−/− mice were obtained from Shuo Yang (Nanjing Medical University). Gas6−/− and Axl−/− mice were obtained from Cheng Qian (Nanjing Medical University). Animals were housed in groups of five to six per cage under pathogen-free conditions with soft bedding, maintained at a controlled temperature of 22 ± 2 °C, and subjected to a 12-hour light/dark cycle (lights on at 8:00 a.m.). Behavioral testing was conducted during the light cycle (between 9:00 a.m. and 5:00 p.m.). Animals were habituated to the testing environment for 2 days prior to the experiments. For each experimental group, animals were matched by age and body weight. To assess chronic tolerance, mice were injected subcutaneously with saline or morphine (10 mg/kg) daily for 7 days, and analgesia was measured 30 min after morphine administration each morning using the tail-flick assay.
Behavioral testing
Behavioral testing was carried out in a blinded manner. A hot water tail-flick test was performed to measure the analgesic effect. Behavioral testing was performed 30 min after morphine administration. Mice were gently held in a tender towel. One-third of the tail was immersed in 52 ± 0.5℃ hot water. The latency until tail withdrawal from the bath was determined. The cutoff time was 20 s to avoid tissue damage. Data were calculated as a percentage of maximal possible effect (%MPE), which was calculated by the following formula: 100% × [(Drug response time − Basal response time)/ (20 s - Basal response time)] = %MPE.
Drug treatment
Morphine was purchased from Shenyang First Pharmaceutical Factory, Northeast Pharmaceutical Group Company (China).
To assess the influence of various drugs on the antinociceptive effects of morphine, mice were administered the NLRP3 inhibitor MCC950 (S8930, Selleck; 20 mg/kg, i.p.), the TLR7 and TLR9 inhibitor IRS954 (GenePharma, 1 mg/kg, i.p.), anakinra (HY-108841, MedChemExpress; 2.5 mg/kg, i.p.), IL-18BP (Z03168, GenScript; 200 µg/kg, i.p.) or saline 1 day before morphine administration once a day until the end of 7 days.
For neutrophil depletion, mice were given an intraperitoneal injection of 300 µg anti-mouse Ly6G (1A8 clone; specific for neutrophils, BE0075-1, Bio X Cell) 1 day before the initiation of morphine treatment to the 7th day every 3 days.
To degrade NETs, mice were injected with DNase 1 (D5025, Sigma; 150 U, i.v.) and RNase A (DNase, protease-free, Thermo Fisher, EN0531; 1 mg/kg, i.v.) via the tail vein from the first day of modeling to the 7th day.
Mice were treated with EPA (HY-B0660, MedChemExpress; 1 g/kg, i.g.) for 5 days prior to morphine administration and continued until the end of the 7-day period.
Neutrophil isolation
Neutrophil isolation was performed based on a previously described method [10]. In brief, mice were euthanized and then sprayed with 75% ethanol, the femur and tibia were extracted. A 25-gauge needle and a 10-cc syringe filled with RPMI-1640 (KGM31800N-500, Keygen Biotech) supplemented with 10% FBS (04-001-1ACS, Biological Industries) and 2 mmol/L EDTA (E9884, Sigma-Aldrich) was used to flush the bone marrow cells from both ends of the bone shafts into a 50-mL centrifuge tube. The cells were centrifuged at 1,200 g for 5 min at 4℃, resuspended in 3 mL sodium chloride physiologic solution, and then layered on top of 9 mL Histopaque 1077 (10771, Sigma-Aldrich) in a 50-mL conical tube. After centrifugation for 20 min at 2,000 g without braking, the supernatant was discarded, and the cells were resuspended in 5 mL sodium chloride physiological solution. The cells were then layered on top of 10 mL of Histopaque 1119 (10991, Sigma-Aldrich) in a 50-mL conical tube and centrifuged for 20 min at 2,000 g without braking. Neutrophils were collected at the interface of the Histopaque 1119 and sodium chloride physiological solution. The collected neutrophils were washed with RPMI-1640 supplemented with 10% FBS and 1% penicillin/streptomycin (KGY0023, Keygen Biotech) for twice and centrifuged at 1,400 rpm for 7 min at 4℃.
NETs isolation
NETs isolation was performed as previously described [11]. Neutrophils, isolated as described in “Neutrophil isolation,” were stimulated with morphine (200 µM) for 24 h in RPMI-1640 supplemented with 10% FBS and 1% penicillin/streptomycin. After stimulation, the supernatant was discarded, leaving NETs and neutrophils adhered to the bottom of the petri dish. 15 mL cold PBS (without Ca2+ and Mg2+) was used to lift off all adherent NETs and neutrophils from the bottom. After centrifugation for 10 min at 450 g at 4℃, neutrophils were in the pellet at the bottom and cell-free NETs were in the supernatant. The supernatant was divided into 1.5 mL microcentrifuge tubes and centrifuged for 10 min at 18,000 g at 4℃. This step allowed NETs to precipitate to the bottom. The supernatant was discarded, and the pellets were resuspended in cold PBS. The NETs concentration in the sample was measured by NanoDrop spectrophotometer. The adequate concentration in the sample for further assays should range between 140 and 180 ng/mL.
BMDMs isolation
BMDMs were harvested from the femur and tibia of C57BL/6J mice. The culture medium used to differentiate and maintain BMDMs was DMEM supplemented with 10% (v/v) FBS, 1% penicillin/streptomycin, and 10% L929 cell supernatant. On day 7, bone marrow-derived macrophages (BMDMs) were seeded into 6-well tissue culture plates. To identify which TLRs are critical in NETs-triggered cytokine production, BMDMs were pretreated with inhibitors of TLR2 (C29, 10 µM, HY-100461, MedChemExpress), TLR4 (TAK242, 10 µM, HY-11109, MedChemExpress), TLR7 (IRS661, 1 µM, GenePharma), TLR8 (CU-CPT9a, 10 µM, HY-112667, MedChemExpress), or TLR9 (IRS869, 1 µM, GenePharma) for 1 h, followed by stimulation with NETs (500 ng/mL) for 3 h. The levels of Il1b, Il6, Il18 and Tnfa mRNA were measured by quantitative real-time PCR analysis (n = 6; see “Quantitative real-time PCR analysis”).
Quantification of NETs
Mouse plasma and human plasma were collected from whole blood by centrifugation at 3,000 rpm for 5 min. NETs in plasma were quantified according to the manufacturer’s instructions with the Citrullinated Histone H3 ELISA Kit (501620, Cayman) and Quant-iT PicoGreen dsDNA Assay kit (P11496, Invitrogen). The absorbance and fluorescence were measured by an automated imaging microplate reader (Cytation 5, BioTeK).
ELISA
Levels of IL-1β, IL-6, and TNF-α in mouse DRG were evaluated by ELISA kits (MLB00C, M6000B, and MTA00B, R&D Biosystems). Level of IL-18 in mouse DRG was measured by ELISA kits (MM-0169M1, Mmbio). All ELISAs were performed according to the manufacturer’s instructions.
Immunofluorescence microscopy of murine DRG, spinal cord, and neutrophils
DRG tissues and spinal cord tissues. After deep anesthesia by intraperitoneal injection of pentobarbital sodium (100 mg/kg), mice were perfused transcardially with normal saline followed by 4% paraformaldehyde in 0.1 M PB, pH 7.4, each for 20 min. Then, lumbar 5 DRGs and lumbar 4–5 spinal cords were dissected out and postfixed in 4% paraformaldehyde for 24 h and cryoprotected overnight in 30% sucrose. The embedded blocks were sectioned as 15 μm thick. Blocking was achieved using 1% normal donkey serum (017-000-121, Jackson ImmunoResearch) and 0.3% Triton X-100 in PBS for 1 h. DRG specimens were incubated with anti-Ly6G (127636, BioLegend), and anti-H3Cit (ab5103, Abcam) overnight at 4℃. Spinal cord specimens were incubated with anti-c-fos (2250 S, Cell Signaling Technology) and anti-CGRP (14959, Cell Signaling Technology). The secondary antibodies were as follows: Alexa Fluor 594-conjugated donkey anti-mouse (715-585-150, Jackson ImmunoResearch) and Alexa Fluor 488-conjugated donkey anti-rabbit (711-545-152, Jackson ImmunoResearch), for 2 h at room temperature. After washing 3 times with PBS, the samples were studied under a confocal laser scanning microscopy (ZEISS LSM700) for morphology. The examinations were conducted in a blinded manner.
In vitro NETs assay. For immunofluorescence staining, freshly isolated polymorphonuclear neutrophils (PMNs) from the bone marrow (isolated as described in “Neutrophil isolation”) were seeded on poly-D-lysine-coated coverslips and allowed to adhere. Cells were treated with LPS (1 µg/mL, L2880, Sigma-Aldrich), PMA (500 nM, P1585-1MG, Sigma-Aldrich), morphine (20 µM, 200 µM). Cells were fixed for 15 min with 4% PFA and blocked with 1% BSA and 0.3% Triton X-100 in PBS for 30 min. Then, rabbit anti-H3Cit and mouse anti-MPO (ab90810, Abcam) primary antibodies were used overnight at 4℃. After three washes, donkey anti-rabbit Alexa Fluor 488 (A-21206, Invitrogen) and Alexa Fluor 594-conjugated donkey anti-mouse (715-585-150, Jackson ImmunoResearch) were added for 2 h at room temperature. NETs formation was visualized by ZEISS LSM700.
Western blot
Samples (cells, DRG or spinal cord tissues) were collected and washed with ice-cold PBS before being lysed in radioimmunoprecipitation assay (RIPA) lysis buffer, and then sample lysates were separated by SDS-PAGE and electrophoretically transferred onto polyvinylidene fluoride membranes (Millipore). The membranes were blocked with 10% Non-fat milk or with 5% BSA and 5% Non-fat milk in TBST (Tris-HCl, NaCl, Tween 20) for 2 h at room temperature and then probed with primary antibodies at 4 °C overnight. Finally, horseradish peroxidase (HRP)-coupled secondary antibodies (Sigma, USA) were utilized to detect the corresponding primary antibody. The following primary antibodies were used: anti-citrullinated histone H3 (H3Cit; ab5103, Abcam), anti-histone H3 (A2348, Abclonal), anti-β-actin (AC206, ABclonal), anti-NF-κB p65 (D14E12, Cell Signaling Technology), anti-phospho-NF- κB p65 (Ser536; AP0475, Abclonal), anti-phospho-NR1 (AP0165, ABclonal), anti-NR1 (A7677, ABclonal), anti-phospho-CaMKII (12818, CST), anti-CaMKII (A0198, ABclonal), anti-phospho-CREB (AP0019, ABclonal), anti-CREB (A10826, ABclonal), anti-caspase-1 p20 (AG-20B-0042-C100, Adipogen), and anti-NLRP3 (AG-20B-0014-C100, Adipogen). The following secondary antibodies were used: HRP-conjugated affinipure goat anti-rabbit IgG (AP307P, Sigma-Aldrich), HRP-conjugated affinipure goat anti-mouse IgG (AP308P, Sigma-Aldrich), and HRP-conjugated affinipure donkey anti-goat IgG (AP180P, Sigma-Aldrich). The bands were developed by enhanced chemiluminescence reagents (New Cell & Molecular Biotech Co., Ltd, China). Data were collected with the Molecular Imager (Bio-Rad) and analyzed with ImageJ software (NIH, United States).
Quantitative real-time PCR analysis
Total RNA was extracted from BMDMs using SPARKeasy Improved Cell RNA Kit (AC0205, Sparkjade Biotech Co., Ltd., Shandong, China). Isolated RNA was reverse-transcribed into cDNA using HiScript II Q RT SuperMix (R222-01, Vazyme Biotech Co., Ltd) following a standard protocol. Quantitative real-time PCR (qPCR) was performed using ChamQ SYBR qPCR Master Mix (Q711-02, Vazyme Biotech Co., Ltd) on a QuantStudio 5 Real-Time PCR Detection System (Thermo Fisher Scientific). The relative expression levels of Il1b, Il-18, Il6, Tnfa, were determined using the 2−ΔΔCt method with normalization to reference genes. All primers used are provided in Supplementary Table S3.
Scanning electron microscopy
After isolating mouse neutrophils from bone marrow, neutrophils were stimulated with LPS (1 µg/mL), PMA (500 ng/ml), morphine (20 µM), morphine (200 µM) and incubated on a 22 × 22 mm cover glass for 4 h at 37 °C in a 5% CO2 incubator. Then, the cells were fixed with 2.5% glutaraldehyde for 30 min, dehydrated with 25%, 50%, 75%, and 100% ethanol for 10 min each time, critical-point dried and then coated with 2 nm platinum (Pt-T4007, DM Material). Because NETs are fragile, each step was done with minimal disturbance of the media to preserve the structures. After dehydration and critical-point drying, the specimens were analyzed under a scanning electron microscope (Helios G4 CX, Thermo Scientific).
Statistical analysis
Prism 8.0 (GraphPad) was used to conduct all statistical analyses. Data were statistically evaluated by the Student’s t-test or one-way or two-way ANOVA with the Tukey test. The results are presented as the mean ± standard error of three independent experiments. The results described as significant were based on a criterion of P < 0.05.
Data Availability
All data supporting the findings of this study are available within the article and its Supplementary Data files, or can be obtained from the corresponding author upon reasonable request.


Comments (0)