Patients and PET
Within this retrospective study, we analysed a total of 11 patients who had undergone both a PET scan with [68Ga]Ga-PSMA-11 and a PET scan with [18F]F-DCFPyL in short succession as part of their clinical workup between July 2014 and December 2016. All patients had a biochemical recurrence of their prostate cancer and had presented for restaging in order to plan their further treatment. The selection of patients for an additional PET scan using [18F]F-DCFPyL was based on the assumption that adding further diagnostic information would significantly improve the treatment decision in each individual case. The same group of patients has already been the subject of another publication focusing on different aspects [16].
Every patient underwent the following procedure for each tracer using a Biograph 16 TruePoint system (Siemens Medical Solutions, Erlangen, Germany) in six patients and a Biograph mCT 128 Flow-Edge system (Siemens Medical Solutions, Erlangen, Germany) in five patients. First, native non-diagnostic computed tomography (CT) was performed for attenuation correction from skull to the mid-thigh. Next, the PET scan was carried out covering that same region. To ensure comparability between different PET/CT systems, reconstruction was performed via an ordered subset expectation maximisation (OSEM) algorithm (4 iterations and 14 subsets) and a HD (high definition) algorithm (3 iterations and 21 subsets), both followed by an intrinsic 5-mm Gaussian filter in all directions for the Siemens Biograph 16 TruePoint system. Reconstruction via an OSEM algorithm (4 iterations and 12 subsets), followed by an intrinsic 5-mm Gaussian filter in all directions, and a UHD (ultra-high definition) algorithm (3 iterations and 21 subsets), followed by an intrinsic 2-mm Gaussian filter in all directions, were performed for the Siemens Biograph mCT 128 Flow-Edge system.
Quantitative analysis
The PET images were quantitatively analysed using the software syngo.via (Siemens Healthineers, Erlangen, Germany). All subsequent evaluations have been performed separately using both OSEM and HD/UHD reconstructed PET images.
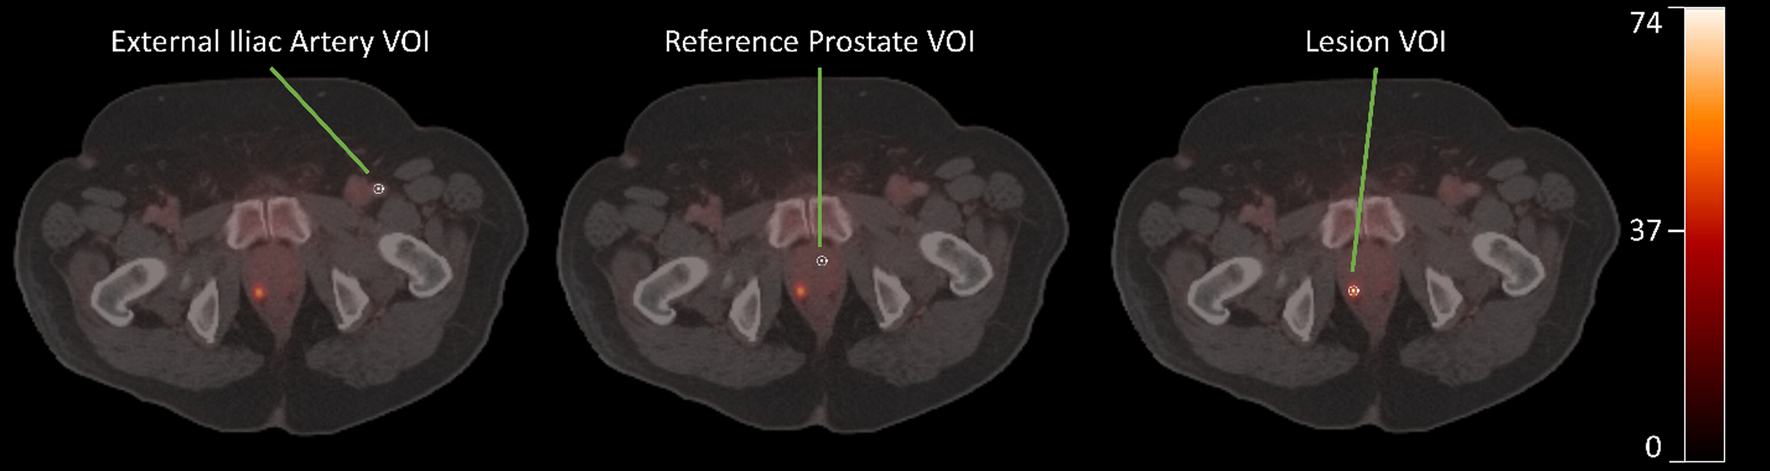
We compared PET scans with [68Ga]Ga-PSMA-11 and [18F]F-DCFPyL for each patient. First, tumour lesions that were reliably recognisable and well delineated on both scans were identified. Separate evaluations were then performed for each of these lesions, determining standardised uptake values corrected for body weight (SUV). For this, tumour lesions were segmented using 41% of their maximum SUV as a cut-off [17]. Maximum and mean SUV of the tumour lesions (SUVmaxT and SUVmeanT) were measured in the resulting volumes.
In addition, general background levels were measured for each patient in both PET scans. This included hepatic and mediastinal backgrounds. The mean SUV in the liver (SUVmeanL) was determined by placing a 3.0-cm-diameter spherical volume of interest (VOI) in the inferior right part of the normal liver [18]. The mean SUV in the mediastinum (SUVmeanM) was determined by placing a spherical VOI with a diameter of 2.0 cm in the thoracic aorta [18].
Moreover, the local background level in the tissue surrounding the tumour was measured for each tumour lesion in both PET scans. For this purpose, mean SUV and its standard deviation in the local background (SUVmeanN and SDN) were determined by placing a 3.0-cm-diameter spherical VOI in the tissue around the tumour [19].
Ratios of the maximum SUV in the tumour lesion to the mean SUVs in the liver and mediastinum, respectively, as well as ratios of the mean SUV in the tumour lesion to the mean SUVs in the liver and mediastinum were calculated for both PET scans (tumour-to-liver ratios, tumour-to-mediastinum ratios: SUVmaxT/SUVmeanL, SUVmeanT/SUVmeanL, SUVmaxT/SUVmeanM, SUVmeanT/SUVmeanM).
In addition, contrast-to-noise ratios were calculated for each lesion in both PET scans, defined as follows: contrast-to-noise ratio = [SUVmeanT—SUVmeanN]/SDN [19].
Statistical analysis
Statistical analyses were performed with the software SPSS statistics 29.0.0.0 (IBM, Armonk, NY, USA). All subsequent analyses were performed separately, using both data from OSEM and HD/UHD reconstructed PET images.
Basic descriptive statistics were performed for patient characteristics, tumour-to-liver ratios, tumour-to-mediastinum ratios and contrast-to-noise ratios.
Tumour-to-liver ratios, tumour-to-mediastinum ratios and contrast-to-noise ratios were compared between [68Ga]Ga-PSMA-11-PET and [18F]F-DCFPyL-PET using the Wilcoxon matched-pair signed-rank [2 samples] test. A p-value of p < 0.05 was considered statistically significant.
Results for tumour-to-liver ratios, tumour-to-mediastinum ratios and contrast-to-noise ratios were graphically visualised using boxplots.


留言 (0)