Subjects
Nine patients with a range of adrenal pathologies (primary aldosteronism, cortisol-producing adenoma, non-functioning adrenal adenoma) were included in this study (mean age 54, range 44–68 years; four females & five males). Patient characteristics are given in Table 1.
Table 1 Subject demographicsPET protocol
[18F]CETO was produced according to previously described methods [13]. A 90-minute list-mode PET acquisition was started over the upper abdomen simultaneously with the injection of 2.7 ± 0.4 MBq/kg body weight of [18F]CETO (mean 246 MBq, range 205–337 MBq). Thereafter, three whole-body PET/CT examinations ranging from the base of the skull to the proximal thighs were performed at approximately 2 h (2 min/bed position), 3 h (3 min/bed position) and 5 h (5 min/bed position) post injection (p.i.). All examinations were performed on a 4-ring Discovery ST PET/CT scanner (GE Healthcare, Waukesha, Wisconsin, USA) [15]. Attenuation correction was based on an ultra-low-dose CT, and the PET images were reconstructed using time-of-flight ordered subset expectation maximization including resolution recovery using 3 iterations, 16 subsets, and a 3 mm Gaussian post-filter, applying all appropriate corrections to ensure quantitatively accurate images. The dynamic scan was reconstructed into 37 frames of increasing duration (1 × 10, 8 × 5, 4 × 10, 2 × 15, 3 × 20, 4 × 30, 5 × 60, 4 × 300, 6 × 600 s). Patients were requested to void their bladder between examinations, and the total urine volume at each voiding and the radioactivity concentration in the urine were measured. Cross-calibration of the PET scanner with the absolutely calibrated dose calibrator used to measure injected activity, as well as the well-counters used to measure urine samples, were verified on a monthly basis and a new calibration was performed every three months or whenever a calibration error larger than 3% was found.
Volumes of interest
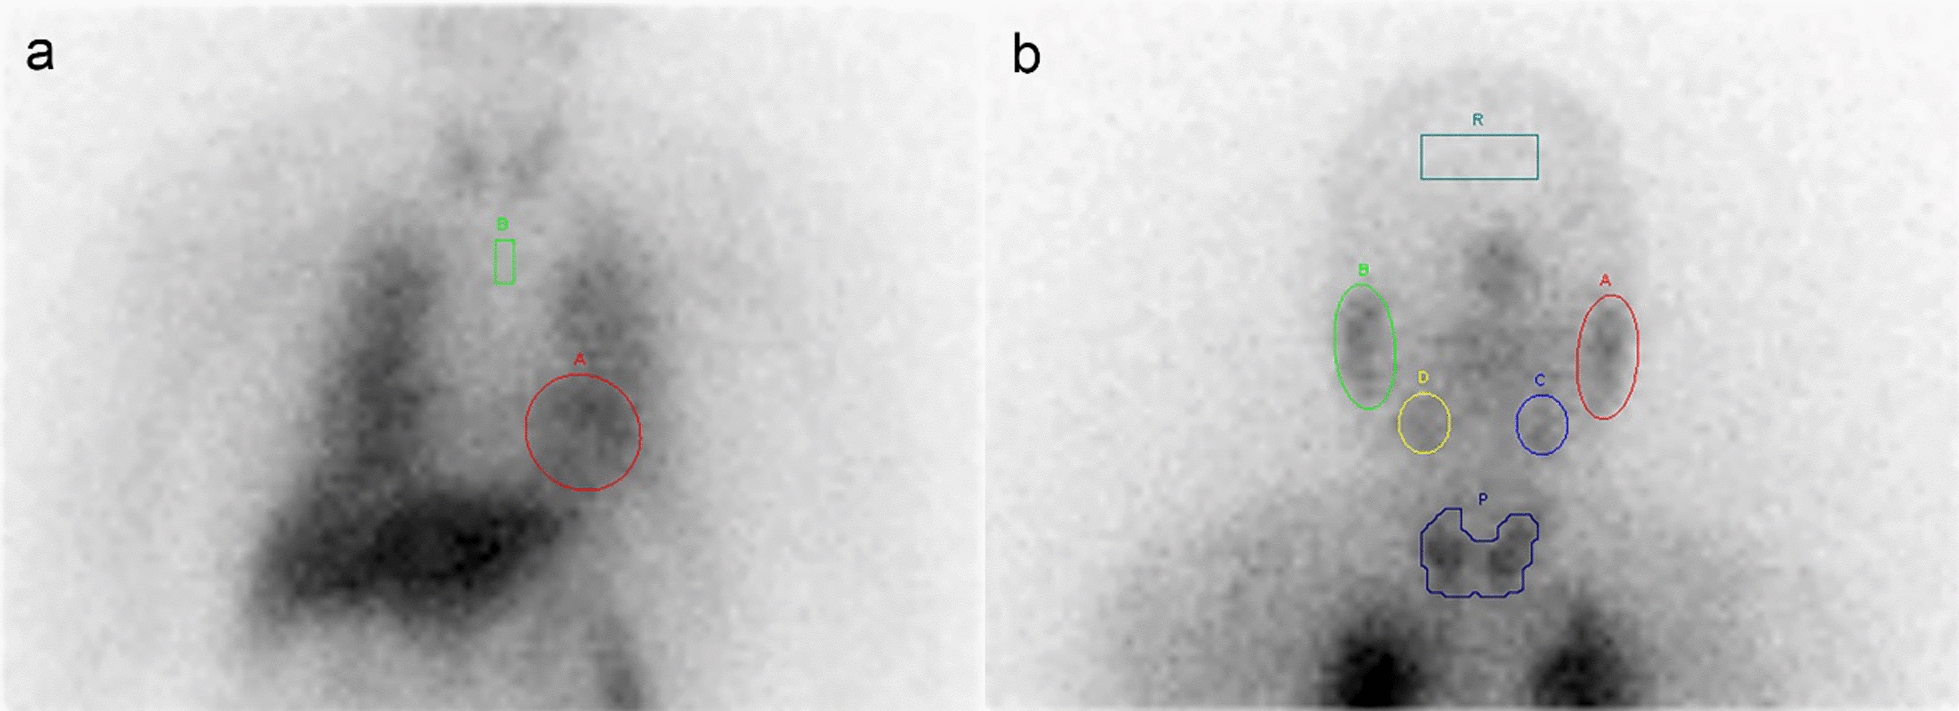
Volumes of interest (VOIs) were drawn separately over the dynamic scan and each of the whole-body images using VOIager 4.0.7 software (GE Healthcare, Uppsala, Sweden). VOIs over the whole-body scans were not identical to VOIs over the dynamic images as subjects left the scanner between scans, but they were drawn in a consistent manner across scans. In the dynamic scans, VOIs were drawn over representative parts of organs in those frames where each organ (adrenal glands, stomach, blood, kidneys, liver, pancreas, vertebral body, spleen, gallbladder and urinary bladder) was best visualized and then projected over all frames to create time-activity curves (TACs), which were then completed with the values of the three whole-body scans. Standardized uptake value (SUV) curves were calculated by normalization to injected activity per body weight.
Time-integrated activity coefficient (TIAC) calculations
All TACs were uncorrected for decay. The area under the curve (AUC) of the dynamic imaging portion of each TAC was calculated by rectangular integration, i.e. multiplication of the value in each frame of the dynamic scan with the corresponding frame duration. A single exponential fit to the last data point in the dynamic scan and the three whole-body scans was used to estimate the remainder of the AUC. The only exception to this was the gallbladder contents, for which an exponential fit to data from the three whole-body scans was combined with trapezoidal integration between the end of the dynamic scan and the first whole-body scan. The time-integrated activity was calculated as the AUC under each TAC and multiplied by its respective organ weight by proportional scaling of the adult male or female reference organ weights in OLINDA/EXM 1.1 [16] based on each patient’s body weight relative to the reference phantom body weights. Vertebrae uptake was attributed completely to red marrow. TIACs were calculated by division with the amount of injected activity. The gastrointestinal tract model of the International Commission on Radiological Protection (ICRP 30) [17] was used to obtain TIACs for stomach wall, small intestine (SI), upper (ULI) and lower large intestine (LLI) based on the fraction of injected activity entering the stomach. Urinary bladder TIAC was calculated based on the measured urine volumes and radioactivity concentrations, assuming linear bladder filling between voidings and a voiding interval of 4 h after the last measurement as previously described [18]. Remainder of the body TIAC was calculated as the theoretical maximum residence time minus all source organ residence times and the activity cleared though bladder voiding.
Dosimetry calculations
Absorbed dose calculations were made using OLINDA/EXM 1.1 [16]. Effective doses were calculated according both to the weight factors in ICRP 60, as available in OLINDA/EXM 1.1, and by applying the ICRP 103 weight factors [19] to the absorbed organ doses calculated by OLINDA/EXM 1.1.


Comments (0)