The results of this study support the use of a two-tissue, three-parameter kinetic model for characterizing the pharmacokinetics of the 68Ga-PSMA-11 radiopharmaceutical. 68Ga-PSMA-11 exhibits free binding to the extracellular domain of PSMA and slow cellular internalization [21, 22], thus providing a physiological basis for the irreversible two-tissue compartment model and Patlak analysis. Patlak analysis generates estimates of Ki and Vd through a single linear regression to a subset of late-timepoint data, whereas tracer kinetic modeling uses the full temporal image series to estimate individual kinetic model rate constants. Therefore, tracer kinetic modeling may provide a more robust approach to kinetic analysis when image data are available from the time of tracer injection.
Although the Akaike information criterion suggested that maximal information was preserved by the 1T2k model, chi-square goodness-of-fit criteria suggested that the 1T2k model did not appropriately fit 68 Ga-PSMA-11 time-activity curves. Therefore, the 2T3k model is optimal based on dual consideration of the Akaike information criterion and chi-square goodness-of-fit criteria. Previous kinetic evaluations of 68 Ga-PSMA-11 for primary prostate cancer have supported the 2T3k or the 2T4k kinetic models, but the findings of this study are consistent with the analysis in high-risk patients established by Ringheim et al. [14, 15, 23]. In comparison with other primary evaluations of 68 Ga-PSMA-11 kinetics, the median PSA of patients reported in this study is reduced (6.8 ng/mL) versus Sachpekidis et al. (24.1 ng/mL) and Ringheim et al. (8.64 ng/mL). Additionally, 11/18 patients possessed favorable intermediate grade disease, in comparison with the greater proportion of high-risk disease in other kinetics studies [15, 23].
Kinetic parameters (\(_,_,_, _\)) exhibited significant differences between lesion and reference prostate tissue, as demonstrated by patient-wise comparison (Fig. 6, Additional file 1: Fig. S2) and statistical comparisons (Table 4). The compartmental model rate constants were also consistent with the ranges reported by Ringheim et al., but reduced net tracer influx (Ki) and k3 in this study likely reflect differences in patient disease severity [15]. Parameter differences between lesion and reference prostate remained significant, regardless of whether \(_\) estimates were obtained by full compartmental models or Patlak graphical analysis. \(_\) values obtained through compartmental modeling and Patlak analysis were correlated for reference prostate tissue and lesions (Pearson r = 0.91).
Consistent with other reports, lesion \(_\) values correlated strongly with SUV for compartmental (Pearson r = 0.94) and Patlak (Pearson r = 0.85) models, indicating that 40–55 min post-injection SUV metrics provide similar information as \(_\) values for lesion detection [15, 23]. Maximal SUVs have also been found to correlate with immunohistochemical PSMA expression and histopathology in patients with prostate cancer [24, 25]. Therefore, it is unlikely that \(_\) provides additional information beyond that of either the percentage of the injected dose per kilogram or the measured SUV, simpler methods which are readily implemented in many clinical workflows. Instead, further studies are required to assess if Ki-based images have utility in imaging of cancers with lower levels of PSMA expression or in the early detection of disease, where improvements in lesion-to-normal tissue contrast, as demonstrated in Fig. 7, may be more impactful toward differentiating lesions from the image background.
Although \(_\) (Patlak and full compartmental analysis) correlated strongly with SUV, individual compartment rate constants (K1, k2, k3) demonstrated minimal to slightly negative correlation with SUV. Table 2 and Table 4 demonstrate that K1 and k3 are significantly elevated in lesions, while k2 is significantly decreased. These findings are consistent with increased PSMA expression and PSMA-11 internalization on the prostatic epithelium. The relative reduction in k2 in lesions conflicts with previous reported trends [15]. However, the high overall estimation variance across all tracer kinetic parameters likely reflects the heterogeneity of prostate cancer across subjects in this study. The analyzed lesions ranged from Gleason Grade Group 1 to 4, representing a greater focus on intermediate-risk disease than in previous studies, possibly contributing to the observed differences.
Table 3 and Fig. 8 demonstrate that relative to SUV, the %ID/kg has reduced parameter variance. Thus, in quantification of 68Ga-PSMA-11 uptake, body mass normalization in the SUV calculation introduces biological noise that reduces diagnostic utility. These observations indicate that 68Ga-PSMA-11 uptake quantification as %ID/kg is preferred when using 68Ga-PSMA-11 PET uptake thresholds for discrimination of disease. Additionally, reference prostate and lesion uptake plateaus beyond 30 min, with peak lesion-to-reference prostate z-scores occurring at 45 min post-injection. Although discordant with EANM/SNMMI 68Ga-PSMA-11 image acquisition guidelines, this finding supports reports indicating that tumor visibility is improved in the 30–45 min window [15, 26,27,28,29,30]. With stable tracer uptake during the 30–55 min window, optimal image acquisition depends largely on count statistics and operational logistics rather than time of acquisition in the first hour post-injection.
As illustrated in Additional file 1: Figs. S3, S4, there were no statistically significant differences between compartmental rate constants, compartmental model \(_\), or \(_\) between normal prostatic tissue in the central, transitional, and peripheral prostatic zone. Additionally, the chi-square goodness-of-fit criterion was consistent across all prostatic zones, indicating that the model is appropriate regardless of prostatic location. This observation is in contrast to previously reported findings by Pizzuto et al. [31] who reported that 68Ga-PSMA-11 accumulation is higher in the central zone than in the transition or peripheral zone. However, the finding was reported during staging for high-risk disease and thus could be attributable as a feature of aggressive disease. In our study, 11% (2/18) patients met or exceeded the average SUVmean reported by Pizzuto et al. in the central zone.
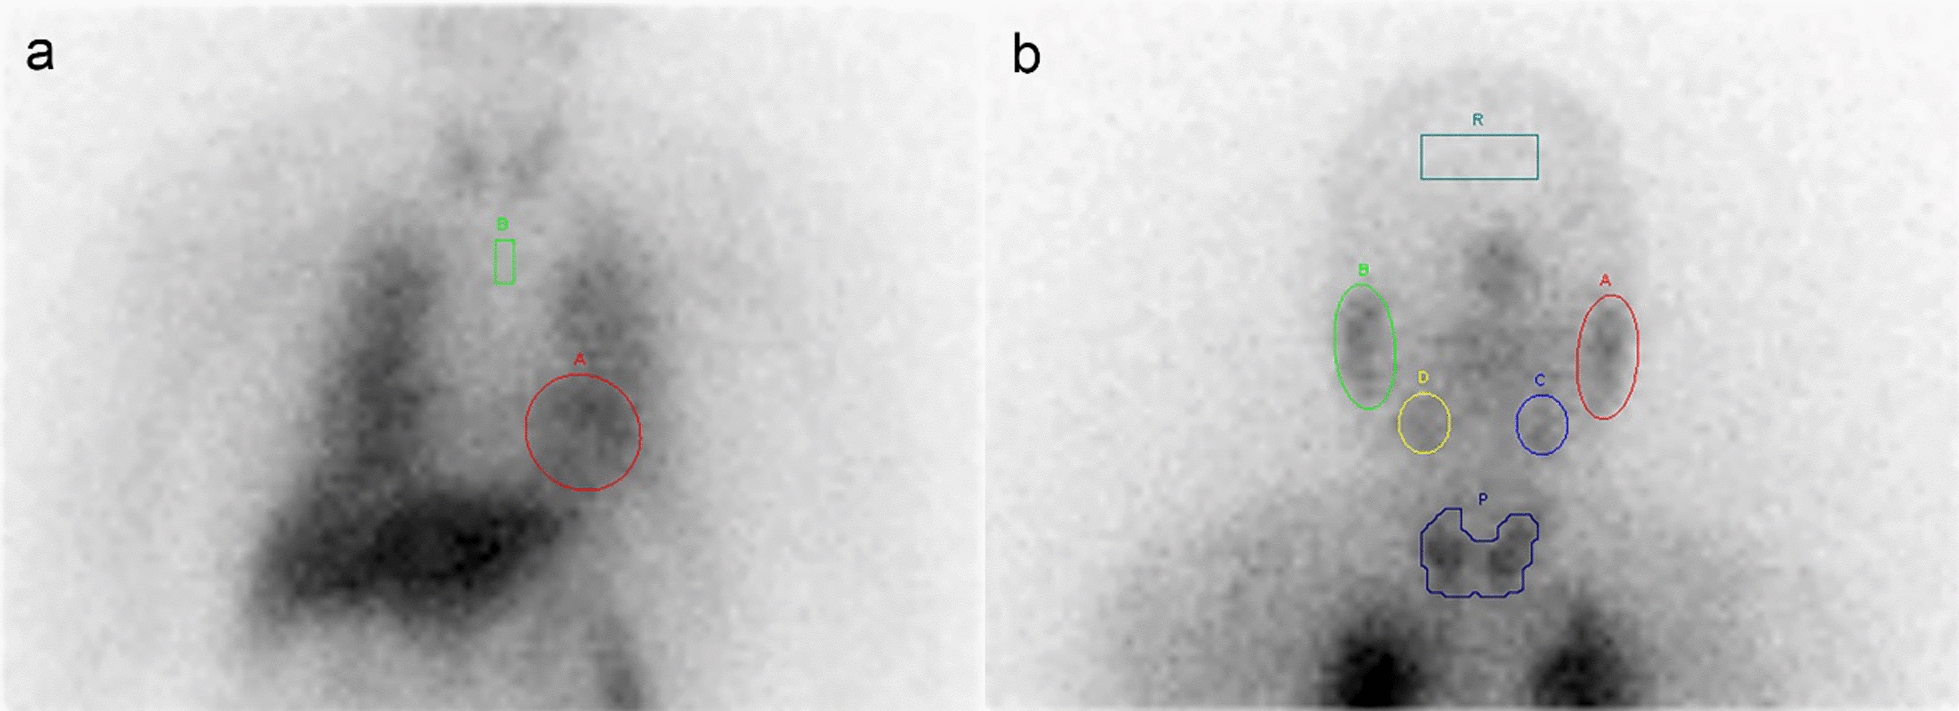
Pelvic 68Ga-PSMA-11 dynamic PET scans are challenging to analyze because the iliac arteries are small in caliber compared to larger ventricular blood pools. In this study, a resolution distortion correction method was employed to estimate the artery blood input function based upon the 3-dimensional imaging characteristics of the PET scanner and the local tissue geometry around a segment of the iliac artery. As a retrospective study, arterial blood samples were not available to use as a reference standard to validate the resolution distortion correction method in these patient studies. The resolution distortion correction algorithm was applied to each frame in the dynamic image sequence to generate an arterial blood input function. This method assumed that the background region surrounding the selected vessel segment was homogeneous. Contamination of the background region from small vessel branches or non-homogenous tissues in the proximity of the vessel would result in biased correction factors. For this study, iliac artery segments were carefully selected in each patient to minimize background region contamination from adjacent tissues. Since the vessel and background VOI model were defined on an early phase image, patient motion would potentially impact the accuracy of the estimated correction factors.
This study, although consistent with other literature reports in its findings, has several limitations which should inform its interpretation. The patients enrolled in this study all had biopsy-proven disease, and therefore, no healthy control patients were included in the study. Reference prostate was sampled contralaterally to lesions under the guidance of board-certified physicians with knowledge of post-surgical pathology, minimizing the risk of microscopic disease invasion of control tissue. Despite a limited sample size, the study still provided statistical power to suggest optimal model configuration and kinetic parameter differences between lesion and reference prostate. Additionally, the scope of patients included in this study is primarily limited to intermediate-risk disease, and only patients who were candidates for prostatectomy received 68Ga-PSMA-11 PET/CT scans. The study included no low-risk patients, and only a single high-risk patient. Additionally, the demographics of patients meeting the study risk criteria were highly racially homogeneous. The present study was performed on presurgical research scans and did not acquire list-mode data past 55 min. Thus, the kinetics and late time-frame SUV images are temporally constrained and do not fully probe the timeframes recommended by EANM and SNMMI [26].


Comments (0)