
Remember me


We analyzed clinical data and prospectively collected samples from the Samsung Medical Center Registry of Critical Illness (SMC RoCI), an ongoing prospective registry of critically ill adult patients from a tertiary referral center in Seoul, South Korea (Samsung Medical Center, 1989 beds, university affiliated). This cohort was initially recruited in April 2014 for the establishment of a human sample repository and discovery of new biological markers for critical illness [10]. Informed consent prior to enrollment including the research purpose, extraction of clinical data and blood specimens, and future reporting of collected data was obtained from all study participants or their legal representatives. This study was conducted according to the Declaration of Helsinki and approved by the Ethics Committee of Samsung Medical Center (IRB no. 2013-12-033).
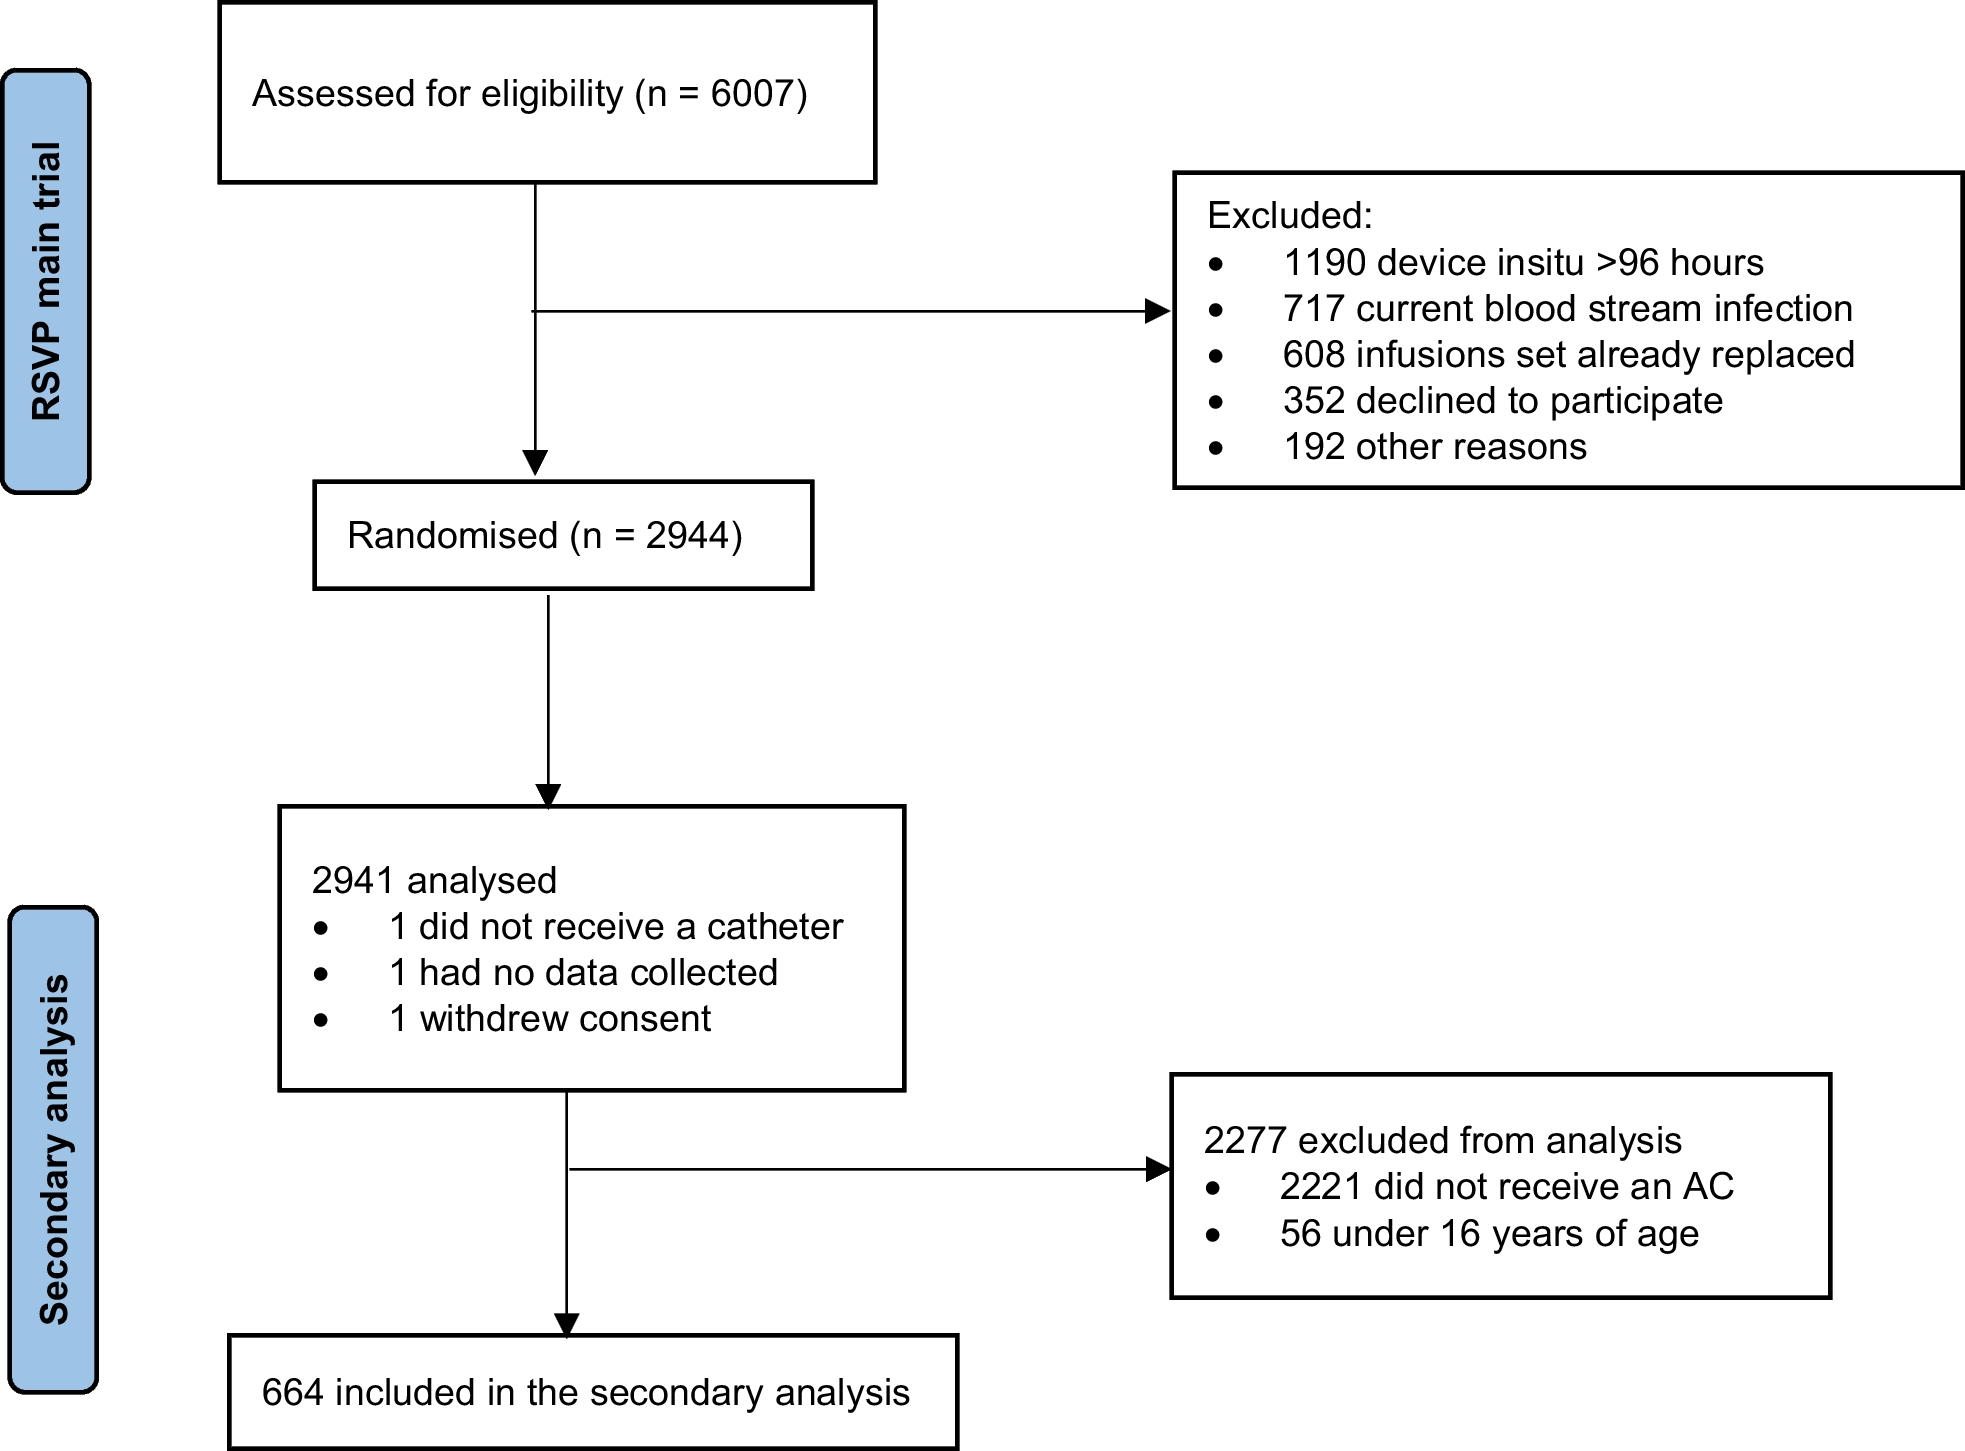
Study populationThe protocols of patient enrollment and data collection for the sample repository have been previously described [10]. Briefly, critically ill adult patients (≥ 19 years old) admitted to the medical intensive care unit (ICU) were prospectively enrolled, and baseline demographics and clinical details were collected. As this is an ongoing cohort, we included a total of 135 patients with sepsis between October 2015 and January 2020 for the discovery cohort. The diagnosis of sepsis was based on the guidelines of the third International Consensus Definitions for Sepsis and Septic Shock (Sepsis-3) [1]. Since enrollment for this study began in October 2015, patients enrolled before the new definition were reclassified. In addition, 11 healthy controls (≥ 19 years) donated blood specimens (5 mL each) for research purposes. Written informed consent was obtained from all healthy volunteers. Independent data of additional critically ill patients with sepsis (n = 35) between February 2020 and April 2021 and healthy controls (n = 10) were used as external validation cohort (Fig. 1).
Fig. 1 Data collection
A trained study coordinator used patient hospital records to prepare a standardized case report form. Clinical data consisting of patient demographics, reasons for ICU admission, severity of illness, and laboratory data (PaO2/FiO2, lactic acid, CRP, PCT, interleukin-6 (IL-6), platelet count, albumin, total bilirubin, and creatinine levels) were obtained at enrollment. Severity of illness was assessed using the Acute Physiology and Chronic Health Evaluation II (APACHE II), Simplified Acute Physiology Score 3 (SAPS 3), and Sequential Organ Failure Assessment (SOFA) scores [18,19,20]. In addition to clinical data, 19 mL of whole blood were drawn from each patient within 48 h of enrollment.
Exosomal miRNAs analysisPlasma preparationBlood samples (≥ 15 mL) were collected for plasma preparation. Plasma was prepared by drawing peripheral blood into ethylenediaminetetraacetic acid tubes, followed by centrifugation at 480 g (Eppendorf Centrifuge 5810 No. 0012529-rotor A-4-81) for 10 min at 4 °C. Several plasma aliquots from each study participant were isolated and stored at − 80 °C until further analysis. Prior to exosome isolation and RNA purification, plasma samples were pre-filtered using 0.8 µm syringe filters, followed by additional centrifugation to eliminate residual cellular debris.
Exosome isolationExosomes were isolated from plasma samples using ExoQuick Plasma prep and Exosome isolation kit (System Biosciences, CA, USA). We modified the manufacturer’s protocol for sample-optimized exosome isolation. The modified protocol was intended to avoid unnecessary sample waste and remove residual impurities. An ExoQuick reagent was used to precipitate plasma exosomes, while the ExoRNeasy mini kit (Qiagen) was used to directly purify RNA from exosomes. To isolate exosomes, 250 µL of the filtered plasma was added to 63 µL of ExoQuick (System Biosciences, CA, USA) and incubated for 30 min at 4 °C. The ExoQuick/plasma mixture was centrifuged at 1500 g for 30 min, followed by supernatant removal and centrifugation of the EV pellet at 1500 g for 5 min to remove the residual ExoQuick solution. The EV pellet was resuspended in 200 µL of phosphate-buffered saline, and the precipitated exosomes were used immediately.
Characterization of exosomesTo analyze cell-specific plasma exosomes, the isolated exosomes were suspended in Phosphate-Buffered Saline containing 1% heat-inactivated fetal bovine serum (FACS buffer) and rested at 37 °C for 15 min. The exosomes were then incubated with 10 µg/ml of the appropriate primary antibody [CD235a (granulocyte), CD3 (lymphocytes), CD11b (monocytes), CD4L (platelet)] plus the exosomal marker CD63. After incubation, the exosomes were washed twice with ice-cold FACS buffer and then stained with 0.25 µg of a FITC-linked secondary antibody for 30 min at 4 °C. After washing with FACS buffer three times, the exosome counts were analyzed by gating the live cell population based on forward and side scatter properties. Flow cytometry data were obtained by a FACS Canto flow cytometer using FACSDiva v8.0 software (BD Biosciences) and analysed using FlowJo v10.0.5 (Tree Star, Ashland, OR). The exosome counts were proportional to the number of fluorescently labelled exosomes, CD63 (total exosomes), [CD235a, CD63]-granulocyte-specific exosomes, [CD3, CD63]-lymphocyte-specific exosomes, [CD11b, CD63]-monocyte-specific exosomes, and [CD4L, CD63]-platelet-specific exosomes.
The concentration and size distribution of the isolated exosomes were assessed by nanoparticle tracking analysis (NTA) using a Nanosight NS300 (NanoSight Ltd., Amesbury, UK). Protein quantification of plasma-derived exosome preparations were performed using Pierce BCA Protein Assay kit (Thermo Fisher Scientific, MA, USA).
Total RNA isolation and quality analysisTotal RNA was extracted from plasma-isolated exosomes using the exoRNeasy Midi Kit following manufacturer’s instructions (Qiagen, Valencia, CA, USA). Briefly, the filtered samples were washed and centrifuged using Buffer XBP and XWP. The isolated exosomes were eluted in 700 µL of QIAzol reagent (QIAGEN Cat. 79,306) and spiked with RNA Spike-In Control (QIAGEN Cat. 339,390) before proceeding with the extraction. Then, 90 µL of chloroform was added to the lysate for subsequent phase separation. The upper aqueous phase containing RNA was transferred to a new collection tube, and 400 µL of the aqueous phase mixed with 800 µL of 100% ethanol; the mixture was transferred into an RNeasy MinElute spin column in a 2 mL collection tube. After centrifugation, the RNA was adhered to the column membrane, and washed with Buffer RWT and RPE; then, DNase/RNase-Free water was added and centrifuged 1 ~ 2 min at 10,000 × g, the collected flow-through corresponded to the exosome total RNA. RNA quantity was measured by NanoDrop 2000 (Thermo Fisher Scientific, MA, USA). RNA purity was assayed by the assessing the 260/280 nm and 260/230 nm absorbance ratios. RNA integrity was assessed using an Agilent 2100 Bioanalyzer with an RNA 6000 Pico kit (Agilent Technologies, CA, USA) (see Additional file 1: Fig. S1). RNA libraries were constructed from 3 ng of total RNA using the SMARTer smRNA-Seq Kit for Illumina (Takara Bio, Shiga, Japan).
Reverse transcription and microRNA expression profilingThe miRCURY LNA™ miRNA Focus PCR panel was used for miRNA profiling of exosomal miRNAs from patients with sepsis and healthy controls (QIAGEN, Cat no. 339325, YAHS-106Y, Qiagen, Hilgen, Germany) (see Additional file 1: Fig. S2). The total extracted RNA including miRNAs (10 ng/µL concentration) was first reverse transcribed into first-strand cDNA using a single miRCURY LNA miRNA PCR assay following manufacturer’s instructions (QIAGEN, Cat no. 339306). Then, 1 µL cDNA per well was mixed with SYBR Green qPCR Master Mix and placed into two 96-well PCR-array plates containing a panel of 179 miRNAs sequences. One µL cDNA was brought to a 10 µL final volume reaction for real-time PCR analysis using an Applied Biosystems Step-One Plus Real-Time PCR system. Relative amounts were calculated using the ΔΔCT method. Samples without good RNA quality were excluded from statistical analysis.
Sequencing data analysis was performed using the GeneGlobe Data Analysis Center (Qiagen). GeneGlobe provides the fold-change (FC = miRNA expression of the nephrotoxicity group / miRNA expression of the non-nephrotoxicity group), FR (FR = FC, if FC ≥ 1 or FR = FC ≥ 1, if FC < 1) and p-value based on the Wald test for each miRNA. miRNA analysis was performed using the geNorm method to identify the best reference controls. The median miR-486-5p, miR-151a-5p, and hsa-miR-532-3p expression was used for data normalization [21]. The relative gene expression was calculated using the comparative cycle threshold (2−ΔΔCT) method [22].
Validation of differentially-expressed miRNAs by quantitative RT-PCRCustom 96-wells Pick-&-Mix microRNA PCR plates (Qiagen) were used to validate teach miRNA candidate. qRT-PCR was performed to quantify the expression levels of candidate exosomal miRNAs using an miRCURY LNA miRNA PCR Starter Kit (Qiagen, No. 339320) and a miRCURY LNA SYBR Green PCR Kit (Qiagen, No. 339347). In addition, we used the Applied Biosystems QuantStudio 7 Flex Real-Time PCR System in a total volume of 10 μL. qRT-PCR conditions were 95 °C for 2 min, followed by 40 cycles of 95 °C for 10 s and 56 °C for 1 min, followed by melting curve analysis. Synthetic UniSp3 was analyzed as interplate calibrator and qRT-PCR control. Amplification curves were evaluated using QuantStudio Software v1.3 (Thermo Fisher Scientific, Massachusetts, USA). Quantification cycles (Cq) > 35 cycles were censored at the minimum level observed for each miRNA. cel-miR-39-3p levels were stable across samples. Relative quantification was performed using the 2−ΔCq method (ΔCq = CqmiRNA-Cqcel-miR-39-3p). Expression levels were log-transformed for statistical purposes [23].
Bioinformatics analysisDifferentially-expressed miRNAs with FR > 2.5 or FR < − 2.5 were selected for analysis. All selected miRNAs presented no comments or comment “A” and a p-value < 0.05. The miRWalk platform, which provides a list of predicted miRNA target genes according to 12 different algorithms, including TargetScan, were assessed to predict the target genes of differently expressed miRNAs (see Additional file 1: Fig. S3). Then, a protein–protein interaction (PPI) network of target genes was constructed using the STRING database (http://string-db.org). The PPI network was further visualized by Cytoscape v3.9.1. In addition, we used the Gene Ontology (GO) database (http://www.geneontology.org/) for function enrichment. The most statistically significant term within a cluster was chosen to represent the cluster. Only terms with p-value < 0.05 and gene numbers ≥ 1.5 were considered meaningful (≥ 1 gene) [24]. The Database for Annotation, Visualization and Integrated Discovery (DAVID) Bioinformatics resource was used to conduct functional enrichment analysis and delineate the underlying biological processes and pathways of aberrantly expressed intersecting genes based on the Kyoto Encyclopedia of Genes and Genomes (KEGG) database [25].
Based on the enriched pathways of target genes, the biological functions of the grouped miRNAs were predicted by miRsystem database, which interprets seven algorithms predicting miRNA targets (DIANA, miRanda, miRBridge, PicTar, PITA, rna22, and TargetScan) and two experimentally validated databases (TarBase and miRecords). The PPI network was established using the STRING database to annotate the functional interaction between target genes and other genes. Active interaction sources, including text mining, experiments, databases, and co-expression as well as species limited to Homo sapiens and an interaction score > 0.7 were applied to construct the PPI network, which showed the physical and functional interactions between genes [26]. We selected gene pairs with a total score > 0.9 for PPI network construction [27]. Then, the Cytoscape software was applied to merge the indirect PPI with driver genes’ PPI to discover interconnected and intersected functional modules and target the core genes. Eventually, we analyzed the interactions between differential expression of exosomal miRNAs and well-known sepsis mechanisms.
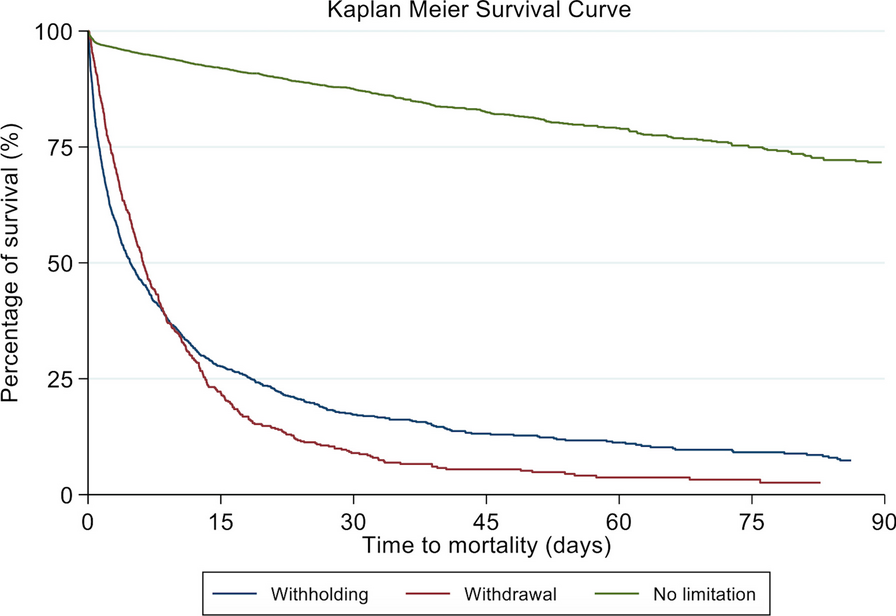
Statistical analysisClinical data is presented as numbers (percentages) for categorical variables, and as the median and interquartile range (IQR, 25th–75th percentiles) for continuous variables. Relative miRNA levels were obtained using 2DCT (2CT of reference miRNAs–CT of miRNA of interest) for each miRNA. The p-value of differential miRNA expression was calculated based on Poisson’s distribution [28] and the p-value threshold was determined by the false discovery rate [29]. Receiver operating characteristic (ROC) analysis was performed, and the area under the curve (AUC) reported to evaluate the performance of miRNAs in predicting in-hospital mortality of sepsis patients. In addition, patients were reclassified into two groups; high and low miRNA levels according to each optimal cutoff level calculated by Youden’s index [30]. Kaplan–Meier equation was used to determine the 90-day mortality curves according to each miRNA levels, which were then compared by the log-rank test. All tests were two-sided, and a p-value < 0.05 was considered statistically significant.
Comments (0)