Patient Characteristics
We describe a father and son, both diagnosed with refractory chronic cough (RCC) and CANVAS. RCC was defined as chronic cough that persists despite guideline-directed investigation and management of contributing causes [7]. CANVAS was established based on compatible clinical features and biallelic intronic AAGGG repeat RFC1 expansions on gene sequencing. As CANVAS has autosomal recessive inheritance, the mother of the son was tested and confirmed to be an RFC1 carrier (monoallelic RFC1 repeat expansions), consistent with the pseudodominant inheritance pattern observed in this family. Both the father and son had never smoked, and no other causes of cough were identified (Table 1). The patients provided written informed consent for procedures and case-series publication. A healthy lung was obtained from a 29-year-old Caucasian male post-mortem donor through the Pacific Northwest Transplant Bank (Cascade Alliance).
Table 1 Demographics and cough characteristics in CANVAS-associated chronic coughNeurological AssessmentsAssessment of Pain
Pain was assessed during clinical assessment and by the validated neuropathic pain symptom inventory (NPSI) [8]. The NPSI quantifies different neuropathic pain types; higher scores indicate greater symptom burden across pain subtypes.
Nerve Conduction Studies
Nerve conduction studies (NCS) were used to assess large-myelinated nerve fibre function. Amplitude and nerve conduction velocity of sensory nerve action potential (SNAP) and compound motor action potential (CMAP) were obtained from upper and lower extremities.
Microneurography
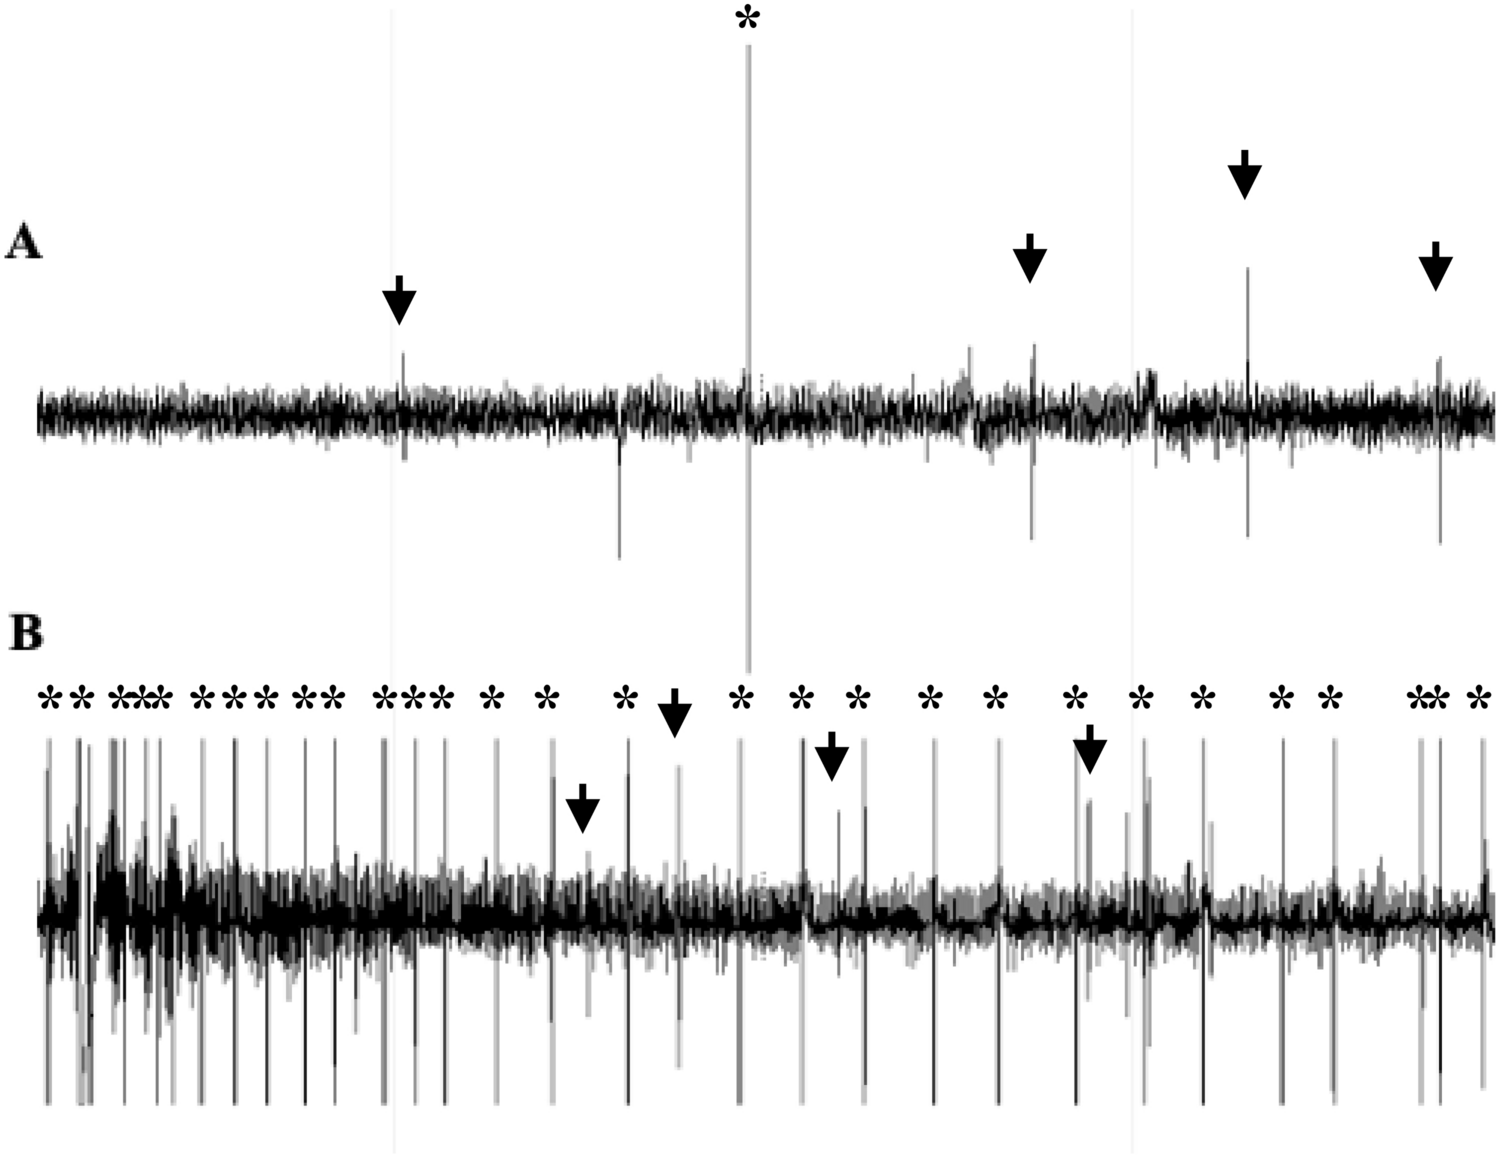
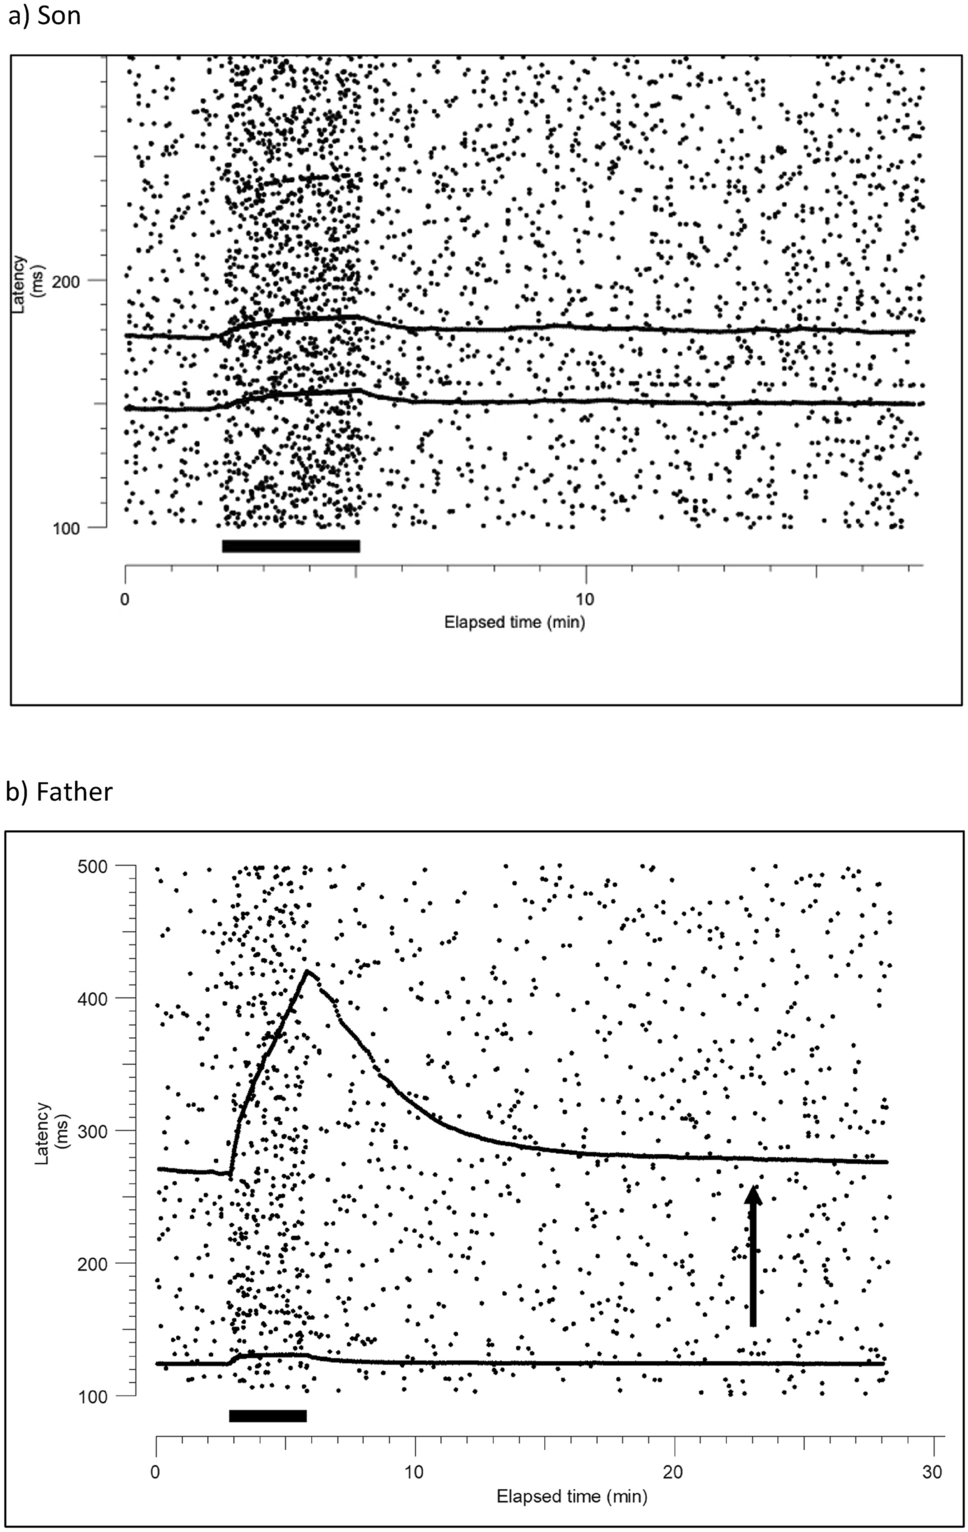
Unmyelinated nerve fibre function was assessed using microneurography to record C-fibre action potentials from the superficial peroneal nerve in the foot, using tungsten microelectrodes (200 μm diameter, lacquer-insulated, nominal impedance 1 MΩ). The neural signals were amplified with an isolated, high input impedance amplifier (Neuro Amp Ex, ADInstruments, Australia), bandpass filtered (maximum range 50–5000 Hz), and fed to a noise eliminator (Hum Bug, Quest Scientific, North Vancouver, Canada). Responses to electrical stimulation were digitised with a data acquisition board (National Instruments, PCI-6221, USA) and recorded in a PC using QTRAC software (©Institute of Neurology, London, UK) and displayed as a raster plot of latencies. Latencies of selected units with adequate signal-to-noise were measured from the raw data, so that each dot represented an identified single unit. Specific functional types of unmyelinated peripheral nerve fibres were identified using activity-dependent slowing of conduction velocity using previously described protocols [9].
RFC1 PCR
Flanking and repeat-primed PCRs were used to identify pathogenic AAGGG and non-pathogenic AAAGG or AAAAG repeat expansions in RFC1, as described by Cortese et al. [10]. Positive cases were defined as negative flanking PCR, negative repeat-primed PCR for (AAAGG)exp and (AAAAG)exp configurations, and the presence of a decremental saw-tooth pattern in repeat-primed PCR for the pathogenic AAGGG repeat expansion [10].
Cough AssessmentsPatient Reported Outcome Measures
Cough severity was assessed using a 100 mm visual analogue scale (VAS), cough-specific impact with the Leicester Cough Questionnaire (LCQ, range 3–21, lower scores indicating worse impairment), and cough triggers with the Cough Hypersensitivity Questionnaire (CHQ, 0–22, higher scores indicate more triggers) [11,12,13].
Objective Cough Frequency
Cough frequency was assessed over a 24-h period using the validated Leicester Cough Monitor [14], which consists of a wearable digital audio recorder (LFH0662, Philips, Amsterdam, Netherlands), a lapel microphone (LFH9173, Philips, Amsterdam, the Netherlands), and specialised cough detection software [14]. Cough events were recorded as single occurrences, regardless of whether they occurred singly or as part of a bout [14]. The objective cough frequency (coughs.hr−1) over 24 h was documented.
Inhaled Capsaicin Challenge Test
Cough reflex sensitivity was evaluated with inhaled capsaicin cough challenge test following the recommendations of the European Respiratory Society [15]. Patients had not experienced an upper respiratory tract infection within the previous 6 weeks. Diluted capsaicin was administered via single-breath inhalations of increasing doubling doses (0.49–1000 μmol.L−1) using an air-powered digital dosimeter (KoKo Digidoser; nSpire Health Inc., Longmont, CO, USA) at 1-min intervals. Potential anticipation effects were mitigated by interspersing randomly administered inhalations of 0.9% saline solution [15]. A consistent nebuliser (Model 646; DeVilbiss Healthcare, Port Washington, NY, USA) with an output of 1.205 mL·min−1 was utilised for all patients. Inspiratory flow was maintained at 0.5L·s−1 using a valve [15]. A minimum of three respiratory cycles occurred before the nebulised solution was administered, with concurrent monitoring of flow-volume signals to ensure consistent and maximal inspiratory effort (0.5 L s−1) throughout the administration. The test was repeated if sub-maximal inhalation was observed. Following administration, coughs were counted for a 15-s period with the assistance of an MP3 recorder (LFH0662, Philips, Amsterdam, Netherlands) [15]. The capsaicin challenge test was concluded once ≥ 5 coughs were elicited by a single dose administration. The capsaicin concentrations required to elicit two (C2) and five (C5) coughs were determined through interpolation, with lower levels indicating greater cough reflex sensitivity [16]. Normal ranges for C2 and C5, utilising the same methodology and equipment as in this study, have been previously reported for men and women [17]: C2 range: 4.44–18.2 μmol L−1 and 7.63–35.9 μmol L−1, and C5 range: > 37.8 μmol L−1 and > 158 μmol L−1, respectively. More than 48 h after testing of cough reflex sensitivity, the test was repeated with the patient instructed to “not cough during the investigation”. The suppressed C2 (CS2) and C5 (CS5) were again calculated by interpolation [18].
Spirometry
Spirometry (Jaeger MS-PFT Analyser Unit with Sentry Suite software version 2.19.96) was measured according to guidelines by the European Respiratory Society guidelines and the American Thoracic Society [19]. FeNO was measured with the NIOX VERO analyser (Aerocrine AB, Solna, Sweden).
Bronchoscopy, Bronchoalveolar Lavage, and Bronchial Biopsies
Fibreoptic bronchoscopy was performed under conscious sedation (fentanyl and midazolam) with topical lidocaine as per local guidelines. Fluid from bronchoalveolar lavage was sent for differential cell count. 4–6 endobronchial forceps biopsies were obtained from the bronchus intermedius.
Histologic Assessments
Airway biopsies (~ 1–2 mm3) were obtained from the bronchus intermedius using fibreoptic bronchoscopy or excised from deceased donor airways and were formalin fixed and immunostained as previously described [6]. Briefly, samples were washed with tris-buffered saline (TBS) and blocked overnight at 4 °C with a solution of 1% Triton X-100, 4% normal goat serum, and 5% powdered milk in TBS. Samples were labelled with antibodies against protein gene product 9.5 (PGP9.5, a pan-axonal marker; Millipore) and neurofilament heavy chain (mechanosensitive Aδ sensory axons; Abcam), followed by secondary anti-rabbit 488 and anti-chicken 647 antibodies (Life Technologies), and then counterstained for nuclei with DAPI. Tissues were mounted on well slides (1-mm thick), covered with a glass coverslip, and sealed with Permount (Thermo Fisher Scientific).
Two to three non-overlapping three-dimensional image Z stacks were obtained from each whole-mount sample using an LSM980 confocal microscope (63X, 1.2 NA). Two samples were analysed per study subject. From these image Z stacks, total axonal length and Aδ-positive nerve length were quantified by applying a computer-generated nerve model over PGP9.5-positive voxels and neurofilament-positive voxels, respectively (Imaris) [6].
For dermal biopsies, intraepidermal nerve fibre density (IENFD) was assessed by immunostaining for PGP9.5 in 50 µm tissue Sects. (3 mm punch skin biopsies; distal leg) following standard methods [20].
Statistical Analysis
All data are expressed as median (interquartile range, IQR), except capsaicin threshold concentrations and cough frequency which were presented as geometric mean (geometric standard deviation, SD).


Comments (0)