Study design
For this study, we selected children aged 9–11 years at baseline from the Adolescent Brain Cognitive Development® (ABCD) study. The ABCD study is an ongoing longitudinal, multimodal MRI with questionnaire study designed to recruit more than 10,000 children and track them over a 10-year period at 21 multisites [16]. Institutional review board approval was secured from all participating sites, and informed consent was obtained from parents and participants. The study data are accessible to researchers upon registration with the National Institute of Health’s Data Archive (https://nda.nih.gov/abcd).
Participants
The demographic characteristics of children enrolled in this study are presented in Table 1. While some data quality indices were developed by the ABCD Data Analysis, Informatics & Resource Center (DAIRC), all standardized inclusions and exclusions were performed for this study, starting from the total participants enrolled at baseline in the ABCD study.
Table 1 Demographic characteristics of children with multisite pain and matched controlsIn this study, the presence of pain was assessed using the Child Behavior Checklist (CBCL), which was completed by the parent(s) regarding their child at baseline. The CBCL pain-related items have been previously used for the classification of chronic pain using ABCD data [17]. Parents were asked to report if their child had experienced the following physical problems without a known medical cause, either currently or within the past six months: (1) aches or pains (not stomach or headaches), (2) headaches, and (3) stomach aches. Response options to each question included “not true (as far as you know)”, “somewhat or sometimes true” and “very true or often true”. Based on previous research [4, 9], we operationalized multisite pain as a parental endorsement of at least two of the three pain items at baseline, resulting in a cohort of 444 children with this condition, and details of pain items (locations) was provided in Table S1. Besides, an additional 444 matched controls were selected, defined as children who did not experience pain at any time point. Furthermore, matched controls were strictly matched to children with multisite pain based on sex, ethnicity, body mass index (BMI), waist circumference, pubertal status, handedness, combined annual family income, and highest parental education. The matching procedure was conducted using the “MatchIt” package for the R programming language in RStudio. Finally, the study cohort comprised 444 children with multisite pain and 444 matched controls at baseline (Table 1, Figure S1). All procedures were conducted in accordance with the Helsinki Declaration and approved by the local institutional review board.
Measures of biopsychosocial characteristicsSex and ethnicity
The child’s sex assigned at birth and race/ethnicity were collected at baseline. Given the relatively small number of children with multisite pain who were non-Hispanic Black, Asian, or another race/ethnicity, we categorized race into three categories: (1) Hispanic, Latino, Latina, or Latinx; (2) Non-Hispanic; (3) Not reported/missing.
BMI and waist circumference
In-person measurements of height and weight were used to determine body mass index (BMI). Specifically, BMI was calculated as weight in pounds divided by height in inches squared and multiplied by 703. Waist circumference was measured in inches in person.
Pubertal status
Pubertal status was assessed using the youth-reported Puberty Development Scale. Previous research has assessed a relationship between pubertal development and multiple pain characteristics in ABCD. Puberty category scores ranging between “prepuberty”, “early puberty”, “mid puberty”, “late puberty”, and “post puberty” for males and females were categorized as previously published.
Handedness
Handedness was assessed using nine items from the Edinburgh Handedness Inventory based on individuals’ self-reported preferences for their dominant hand. Thus, handedness was categorized into three categories: right-handed, left-handed, mixed mixed-handed.
Combined annual family income and highest parental education
Socioeconomic status was assessed by both combined annual family income and parental education level in this study. For combined annual family income, parents selected a category that best represented their income for the past 12 months, ranging from (1) “less than $5000” to (10) “$200,000 and greater”. Parents reported on their or their partner’s highest level of education by selecting an education category that ranged from (0) “Never Attended” to (21) “Doctoral Degree”.
Cognitive ability
The NIH Toolbox cognition battery was adopted to measure cognitive ability among children in the ABCD study. In this study, we extracted data from tests assessing language/verbal intellect, cognitive control/attention, working memory, flexible thinking, processing speed, visuospatial sequencing/episodic memory, reading ability, and fluid reasoning. Besides, two composite scores, crystallized intelligence and a total cognition score, were extracted.
Sleep quality
Sleep quality was assessed using the parent-reported Sleep Disturbance Scale, which contains 26 items across 6 subscales: (1) disorders of initiating and maintaining sleep, (2) sleep breathing disorders, (3) disorders of arousal, (4) sleep-wake transition disorders, (5) disorders of excessive somnolence, and (6) sleep hyperhidrosis. The total score is calculated as the sum of the scores from all 6 subscales, which range from 26 to 130, with higher scores denoting more sleep disturbances and worse sleep quality [18].
Clinical symptoms
In the ABCD study, various clinical symptoms were assessed using the parent-reported CBCL, a tool with established high internal consistency and validity [17]. Raw scores from specific DSM-5-oriented subscales of the CBCL were used to quantify the following symptoms: depression, anxiety, Attention hyperactivity disorder (ADHD), oppositional defiance, conduct disorder, and general somatic symptoms. In addition, raw summary scores from the CBCL were used to assess inattention, as well as broader externalizing and internalizing syndromes.
Personality
In the ABCD study, the UPPS-P for Children Short Form was a 20-item self-report measure used to assess impulsivity in children, which measured five dimensions of impulsivity: negative urgency, lack of planning, sensation seeking, positive urgency, and lack of perseverance [19]. Besides, a modified version of the Behavioral Inhibition System (BIS)/Behavioral Activation System (BAS) scale was adopted to assess individual differences in behavioral motivation systems related to sensitivity to punishment (BIS) and reward (BAS) in the ABCD study. The scale consists of 20 items, comprising one BIS scale and three BAS subscales: drive, reward responsiveness, and fun-seeking [20].
MRI data acquisition
The acquisition and preprocessing of structural MRI data were conducted as described in previous research [16]. The imaging protocol was standardized and harmonized for three 3 T scanner platforms (Siemens Prisma, General Electric 750 and Philips) across all 21 ABCD sites (Table S2). Besides, the imaging parameters for the three 3 T scanner platforms are summarized in Table S3. Furthermore, the ABCD Imaging Acquisition Workgroup (https://abcdstudy.org/scientists-workgroups.html) selected, optimized and harmonized measures and procedures across all 21 multisites [21]. All MRI data were collected from 3 T scanners. Participants underwent T1- and T2-weighted MRI scans, diffusion tensor imaging scans, and resting-state functional MRI scans. In this study, only structural MRI data were used to investigate altered structural gray matter in children with multisite pain; therefore, details about quality control and preprocessing for structural MRI are documented below.
Structural MRI data quality control
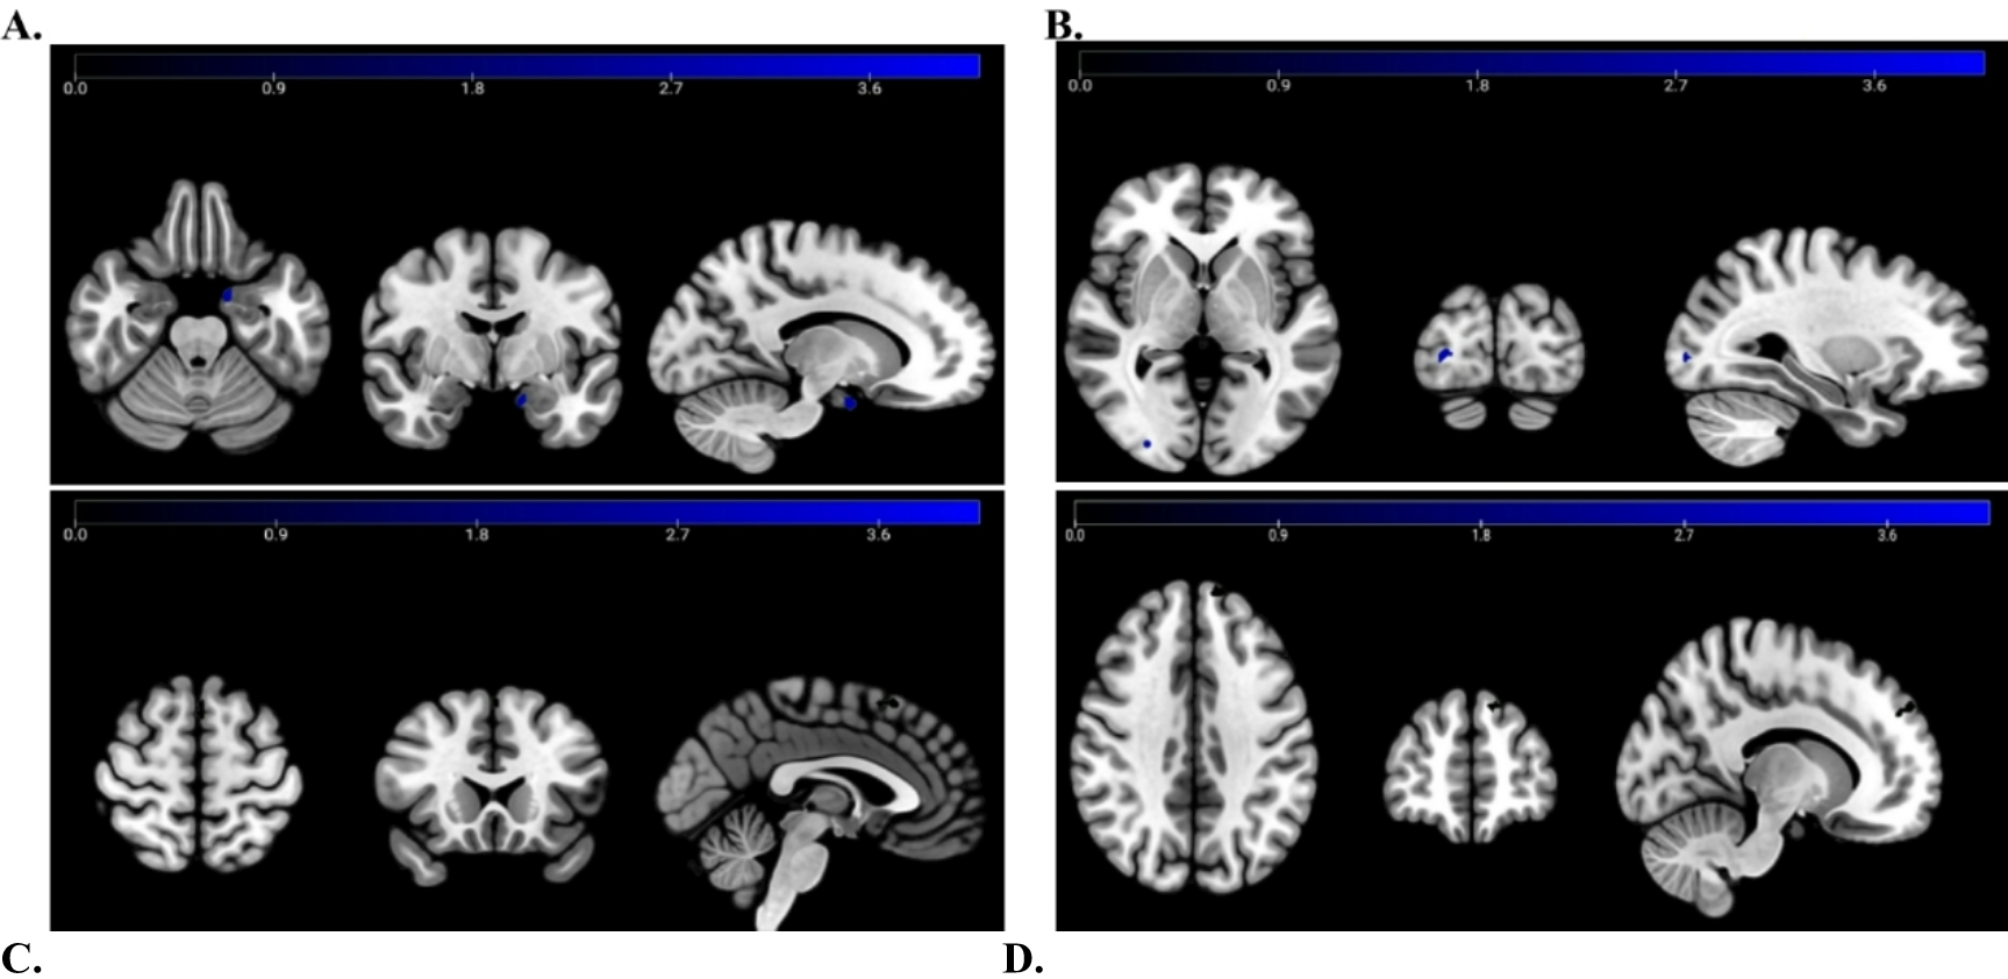
The quality control criteria for structural MRI data were based on two key assessments. For the clinical referral assessment, participants who scored a 3 (consider clinical referral) or 4 (consider immediate clinical referral) in the MRI clinical report/findings were excluded. For the imaging inclusion assessment, the score for participants’ structural MRI data recommended for inclusion was 1, and therefore, the structural MRI data were included in the subsequent structural MRI data analysis. Finally, 415 children with multisite pain and 404 matched controls participated in the following structural MRI analysis (Figure S1).
Structural MRI data preprocessing
In this study, structural MRI data was preprocessed by FreeSurfer, and the pipeline encompassed the following steps: removal of non-brain tissue, automated Talairach transformation of each participant’s native brain, intensity normalization, tessellation of the gray/white matter boundary, automated topology correction, surface deformation following intensity gradients, registration of the participant’s native brain to a standard spherical atlas, and reconstruction of the cortical surface. To obtain CT and CSA measurements, the cortical morphologies were smoothed. This smoothing process was repeated using the same kernel size to ensure accurate CSA and CT measurements. During preprocessing, all outputs were subject to meticulous accuracy inspection, with manual corrections applied where necessary. Subsequently, the average CSA and CT values within the total of 148 bilateral brain cortical regions of interest were defined using the Destrieux atlas [22].
Construction of SCNs
The statistical similarity between brain regions defined by the Destrieux atlas was measured by computing Pearson’s correlation coefficient across subjects, and an interregional correlation matrix (148 × 148) was constructed from each group. Therefore, group-level SCNs for the CT and CSA were constructed separately for each group. To improve the normality of the correlation, the correlation coefficient r was converted to z-values using the Fisher transformation. By binarizing the correlation matrix using a series of sparsity thresholds, which resulted in specific percentages of connections, a series of unweighted and undirected graphs was obtained for subsequent network analysis. Given that the selection of different threshold values could cause changes in small-world network parameters, we limited the correlation matrices over a wide range of sparsity (6%–40%) to avoid the uncertainty resulting from the threshold choice [23]. The chosen range of sparsity enables the proper estimation of small-world network architectures, and the number of spurious edges in each network is minimized, as indicated in previous studies [23, 24].
Graph-based network analysis
Global and nodal network measures of SCNs were computed using the Brain Connectivity Toolbox [25]. We computed the normalized characteristic path length (which is defined as the shortest path length between all pairs of nodes) and global efficiency (which measures how efficiently information is communicated between nodes) as measures of network integration and the normalized clustering coefficient (which evaluates the influence of different paths based on the connection weights of the node’s neighbors) and local efficiency (defined as the number of connections in the neighborhood of a certain node divided by the maximum number of possible connections between the neighbors of this node) as measures of network segregation. Small-worldness, which reflects the optimal balance between network integration and segregation, was also computed. The nodal degree, nodal efficiency, and nodal betweenness centrality were examined to identify group differences in nodal network measures.
Statistical analysis
Statistical analysis was conducted using various packages in the R programming language within RStudio. In terms of demographic characteristics, the chi-square test was used to assess group differences in sex, pubertal status, ethnicity, and handedness. Group differences in other demographic characteristics were evaluated using two independent samples t-tests. For the cognitive and clinical characteristics, two independent samples t-tests were conducted to investigate the group difference, and a threshold of P < 0.05 was considered statistically significant after false discovery rate (FDR) corrections.
During SCN analysis, any biopsychosocial characteristics that showed significant group differences and pain locations were included as covariates. A nonparametric permutation test was employed to investigate statistical differences in network metrics between the groups. First, a network measure (clustering, path length, efficiency, nodal efficiency, betweenness, and degree) was computed separately for children with multisite pain and matched controls. Following that, the CT or CSA values of each subject were allocated into two groups, resulting in an identical sample size for each of the original groups. New values were obtained for network metrics after recalculating the SCNs for both groups. Each permutation test was repeated 1000 times, and a P-value < 0.05 was statistically significant with FDR corrections after multiple comparisons. Considering various densities, we compared the area under the curve (AUC) (density range: 0.06-0.01.06.01-0.4) between the two groups. Next, to examine whether altered structural gray matter and SCNs were associated with biopsychosocial characteristics in children with multisite pain, Pearson correlation analysis was conducted.


Comments (0)