
Remember me


PSM effectively balanced covariates, as shown in Tables 1, 2, 3 and 4. No significant differences remained in female age or BMI after PSM1, or in female age, BMI, AMH, AFC, FSH, or E2 after PSM2 (all P > 0.05), confirming adequate cohort matching (P > 0.05).
Table 1 Baseline characteristics and oocyte aspiration characteristics in the control group and endometriosis group after propensity score matchingTable 2 Baseline characteristics and oocyte aspiration characteristics in the non-operated endometrioma and operated endometrioma groups after propensity score matchingTable 3 Baseline characteristics and oocyte aspiration characteristics in the non-operated endometrioma and operated endometrioma groups at stage I/II stage after propensity score matchingTable 4 Baseline characteristics and oocyte aspiration characteristics in the non-operated endometrioma and operated endometrioma groups at EMS III/IV stage after propensity score matchingEMS decreases the quantity and quality of oocytes, and ovarian responseTable 1 compares baseline characteristics, ovarian response, and embryo quality between the EMS and CON groups following PSM1 and PSM2. After both PSM1 and PSM2, the EMS group demonstrated significantly shorter durations of female infertility and menstrual cycles versus the CON group (all P < 0.001). Gonadotrophin doses were significantly higher (P < 0.001 both), while the OSI was significantly lower (PSM1: P < 0.001; PSM2: P = 0.01) in the EMS group compared to controls. Oocyte maturation rates and total fertilization rates were significantly higher in the EMS group after both matchings (all P < 0.01). Conversely, The D3 rate was significantly lower in the EMS group after both PSM1 and PSM2 (P < 0.001). The rate of high-quality D3 embryos did not differ significantly between groups after either matching (P > 0.05). Following PSM1, the EMS group exhibited significantly fewer retrieved oocytes, metaphase II (MII) oocytes, fertilized oocytes, normally fertilized oocytes, D3 embryos, high-quality D3 embryos, and viable blastocysts (all P < 0.001). However, these significant differences in embryo/oocyte counts were absent after PSM2.The normal fertilization rate was comparable between groups after PSM1 but significantly lower in the EMS group after PSM2 (P < 0.001).
Ovarian surgery reduces oocyte yield without compromising quality or ovarian responseTable 2 compares baseline characteristics, ovarian response, and embryo quality between pre-EMS and post-EMS groups after PSM1 and PSM2. Following both PSM methods, the post-EMS group had significantly fewer high-quality D3 embryos and lower basal LH levels than the pre-EMS group (all P < 0.05). After PSM1, the post-EMS group showed significant reductions in retrieved oocytes, MII oocytes, total fertilized oocytes, normally fertilized oocytes, D3 embryos, and viable blastocysts (all P < 0.001). Trigger day OSI and E2 levels were also significantly lower, while FSH and LH levels were significantly higher in the post-EMS group (all P < 0.001). However, these differences disappeared after PSM2 (P > 0.05). Gonadotropin dosage and duration were similar between groups after PSM1 (P > 0.05), but were significantly lower in the post-EMS group after PSM2 (all P < 0.05).
Ovarian surgery diminishes oocyte quantity without compromising quality in post-EMS I/II patientsTable 3 compares baseline characteristics, ovarian response, and embryo quality between pre-EMS and post-EMS I/II groups following PSM1 and PSM2. The dosage and duration of Gn were significantly reduced in the post-EMS I/II group compared to those in the pre-EMS group after both PSM1 and PSM2 (P < 0.05). Oocyte maturation rates, total/normal fertilization rates, D3 embryo rates, and high-quality D3 embryo rates did not differ significantly between groups after both PSM analyses (P > 0.05). Post-EMS I/II patients exhibited significantly lower basal LH and E2 levels on trigger day after both PSM analyses (P < 0.05). Following PSM1, the post-EMS I/II group had significantly fewer retrieved oocytes, MII oocytes, fertilized oocytes (total/normal), D3 embryos, and high-quality D3 embryos (P < 0.05). However, these differences were not observed after PSM2 (P > 0.05).
Ovarian surgery decreoases the quantity f oocytes and ovarian response independent of AMH/AFC in post-EMS III/IV patientsTable 4 compares baseline characteristics, ovarian response, and embryo quality between pre-EMS and post-EMS III/IV groups after PSM1 and PSM2. After both PSM1 and PSM2, the post-EMS III/IV group showed significantly higher trigger day luteinizing hormone (LH) levels, but significantly lower basal LH and trigger day estradiol (E2) levels (P < 0.05). Compared to the pre-EMS group, the post-EMS III/IV group demonstrated significant reductions in retrieved oocytes, MII oocytes, total fertilized oocytes, normally fertilized oocytes, D3 embryos, and high-quality D3 embryos after both PSM1 and PSM2 (all P < 0.001). OSI values were also significantly lower in the post-EMS III/IV group after both analyses (P < 0.001), while gonadotropin dosage and duration showed no significant differences. After PSM1, the post-EMS III/IV group had significantly fewer abnormally fertilized oocytes and viable blastocysts, as well as a lower high-quality D3 embryo rate (all P < 0.05). These differences were not observed after PSM2.
Neither endometriosis nor prior ovarian surgery significantly influences pregnancy outcomes in fresh IVF/ICSI cyclesBefore PSM (Table 5), clinical pregnancy rates and LBRs were significantly lower in the EMS group compared to the control group, irrespective of prior surgery (P < 0.05). This disparity likely reflects confounding by higher female age in the endometriosis cohort (P < 0.05). After PSM3 balancing female age, BMI, and embryo developmental stage (Table 6), no significant differences in clinical pregnancy rates or LBRs persisted (P > 0.05).
Table 5 Pregnancy outcomes in the endometriosis and control groups before propensity score matchingTable 6 Pregnancy outcomes in the endometriosis and control groups after propensity score matchingFemale ages and endometriosis diagnosis are independent factors associated with LBRsSupplementary Table S1 presents univariate and multivariate analyses of factors affecting LBRs per fresh embryo transfer. Univariate analysis showed significantly higher LBRs in controls compared to the pre-EMS group (OR 2.185, 95% CI 1.194–3.998; P = 0.011), but no difference between pre- and post-EMS groups. Female age (OR 0.924), AFC (OR 1.038), and D3 embryo count (OR 1.082) also showed univariate associations with LBRs. After multivariate adjustment, only female age (OR 0.937) and untreated endometrioma diagnosis remained independent predictors of LBRs. AFC and D3 embryo count lost statistical significance in the multivariate model.
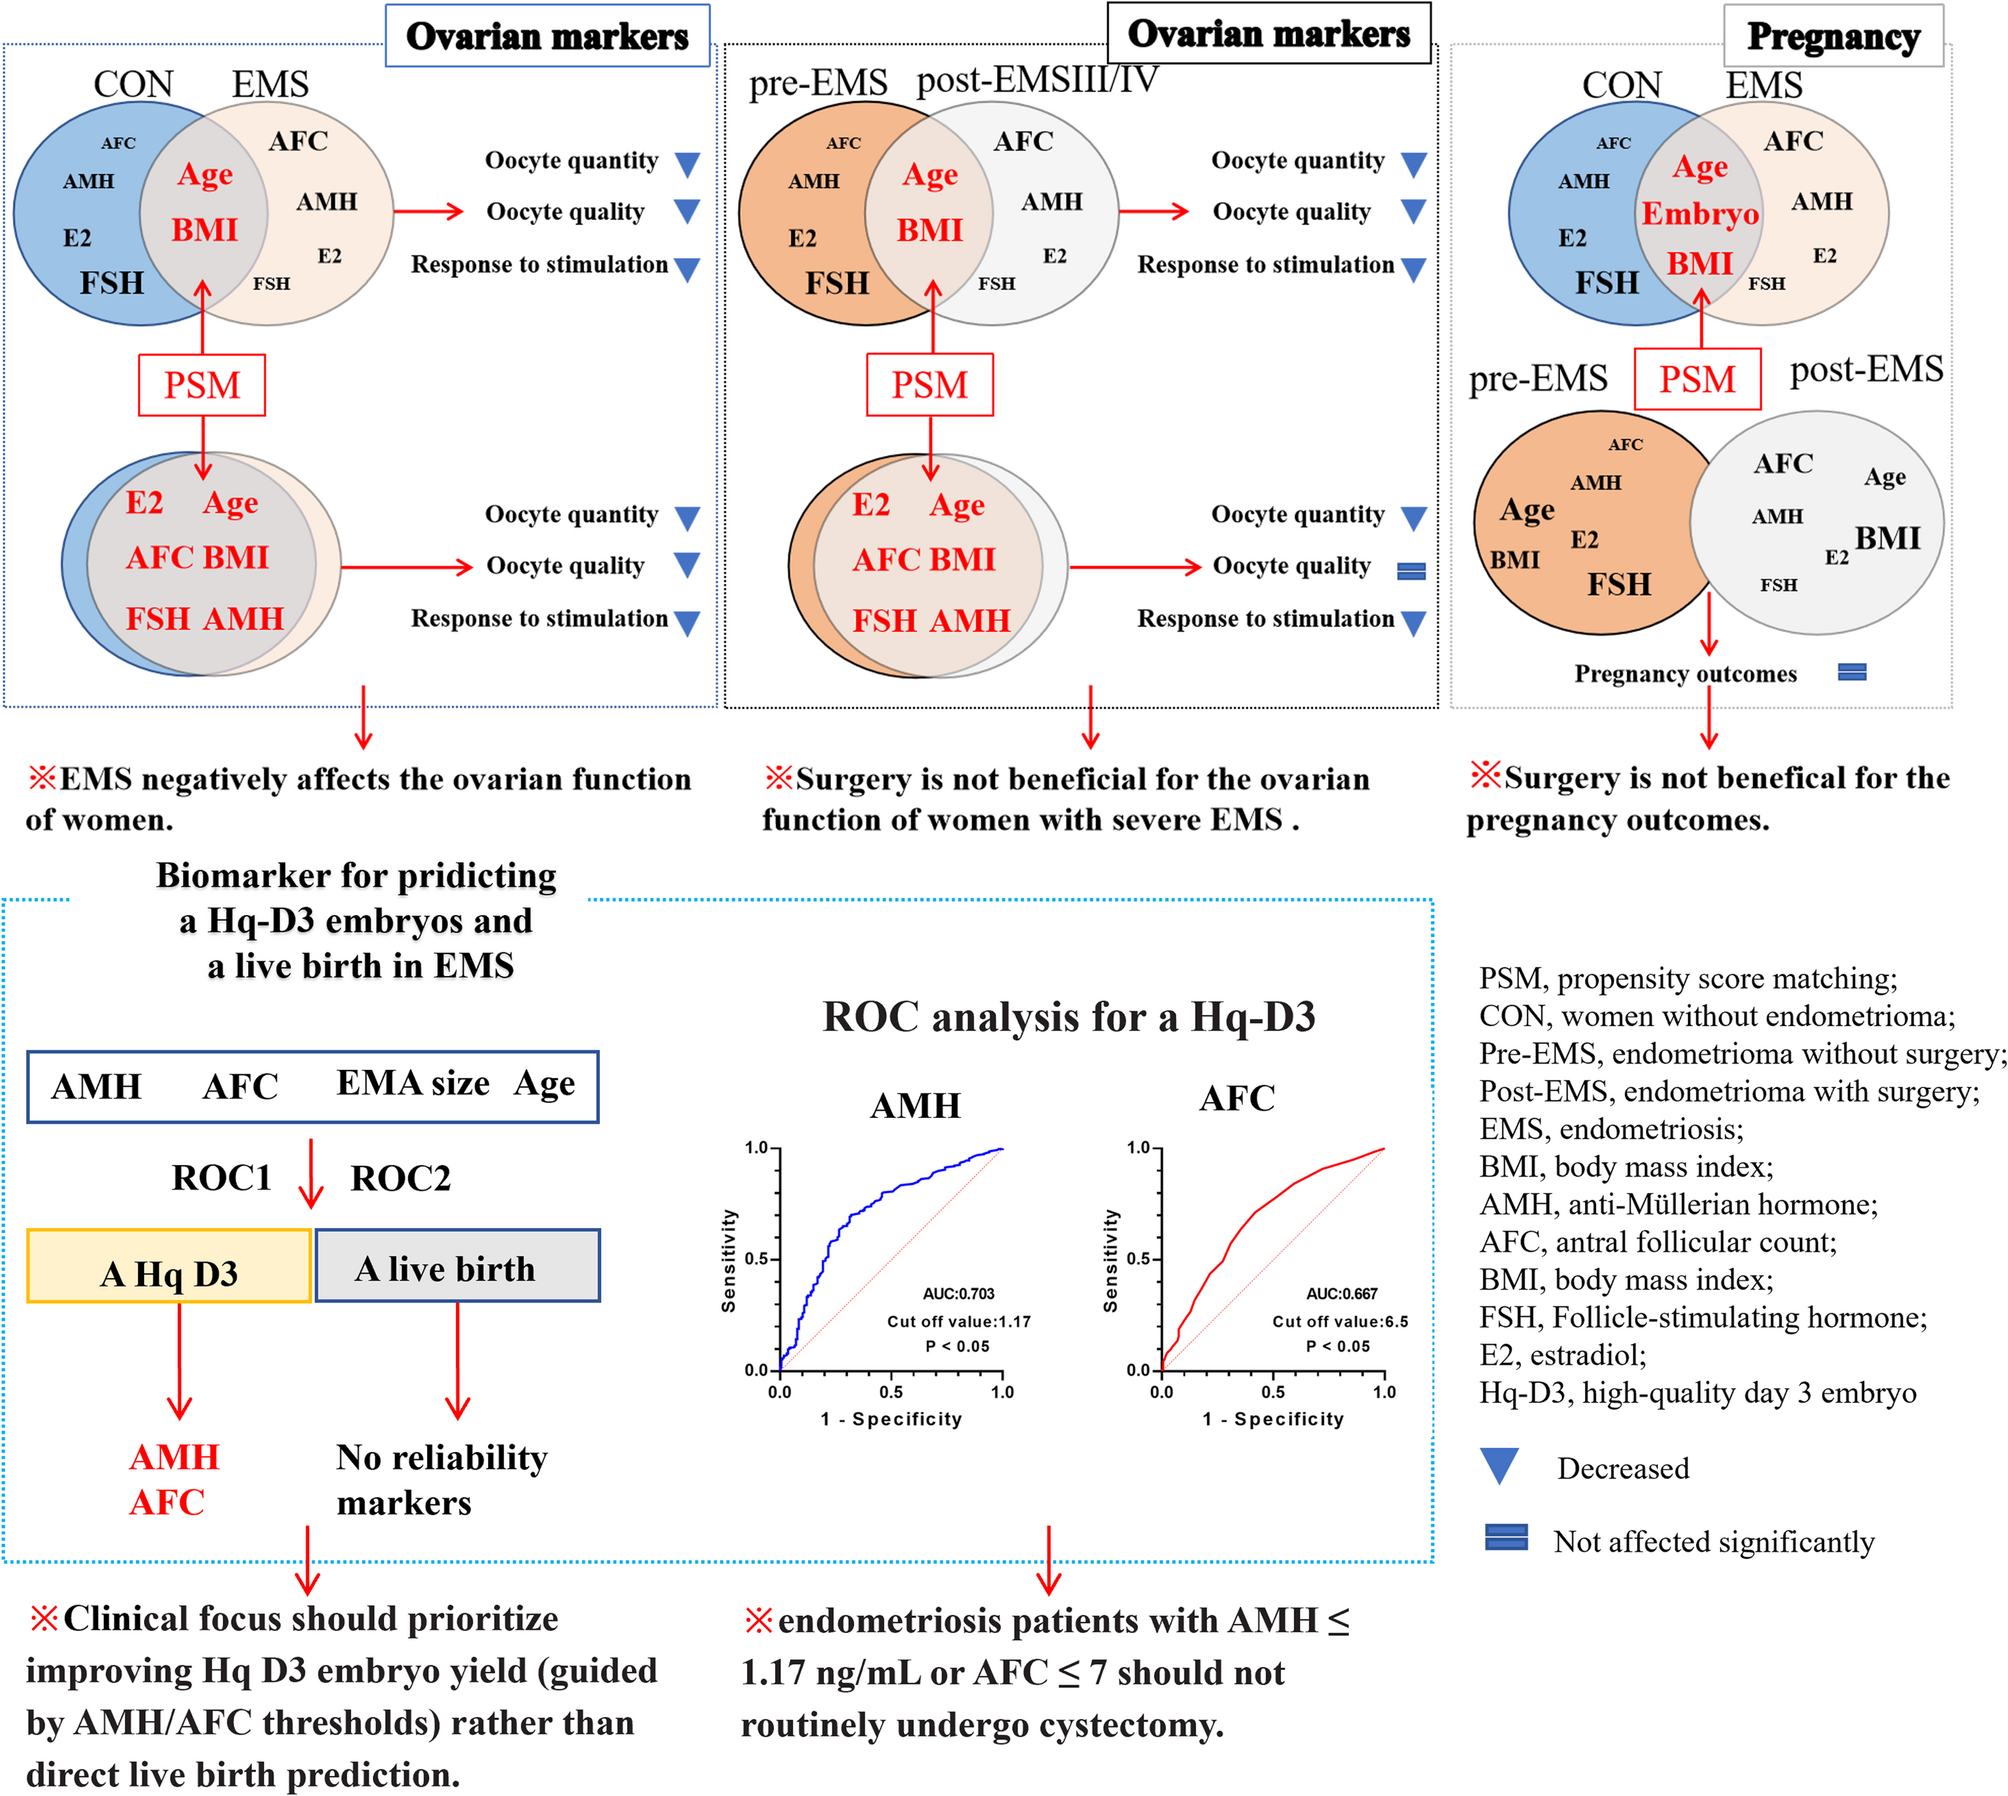
AMH and AFC are potential markers for predicting one high-quality D3 embryoFigure 2 (A-D) presents the ROC curves evaluating female age, AMH, AFC, and endometrioma size as predictors of one High-quality D3 embryo yield in the EMS group. The optimal thresholds were as follows: female age ≤ 24.5 years[area under the ROC curve (AUC) = 0.594, standard error (SE) = 0.025, 95% CI:0.545–0.643; P < 0.001; sensitivity = 99.3%, specificity = 2.5%, Youden’s index = 0.018], AMH ≥ 1.17 ng/mL (AUC = 0.703, SE = 0.025, 95% CI:0.654–0.752; P < 0.001; sensitivity = 71.3%, specificity = 66.5%, Youden’s index = 0.378), AFC > 7.5 (AUC = 0.670, SE = 0.025, 95% CI:0.621–0.720; P < 0.001; sensitivity = 70.1%, specificity = 57.8%, Youden’s index = 0.279), and endometrioma size ≤ 10.67 mm (AUC = 0.574, SE = 0.026, 95% CI:0.523–0.625; P < 0.001; sensitivity = 90.2%, specificity = 9.9%, Youden’s index = 0.001).
Fig. 2
Receiver operating characteristic (ROC) analyses for predicting a high-quality D3 (Hq-D3) embryo and live birth in the endometriosis (EMS) population. A ROC analysis of anti-Müllerian hormone (AMH) for predicting one Hq-D3 embryo obtained in the EMS group, cut off value=1.17 ng/mL, area under the ROC curve (AUC) = 0.703, standard error (SE) = 0.025, 95% CI:0.654–0.752; P<0.001; sensitivity=71.3%, specificity=66.5%, Youden’s index=0.378. B ROC analysis of antral follicular count (AFC) for predicting one Hq-D3 embryo obtained in the EMS group, cut off value = 7.5, AUC=0.670, SE=0.025, 95% CI:0.621–0.720; P<0.001; sensitivity=70.1%, specificity=57.8%, Youden’s index=0.279. C ROC analysis of endometrioma (EMA) size for predicting one Hq-D3 embryo obtained in the EMS group, cut off value = 10.67 mm, AUC=0.574, SE=0.026, 95% CI:0.523–0.625; P<0.001; sensitivity=90.2%, specificity=9.9%, Youden’s index=0.001. D ROC analysis of female age for predicting one Hq-D3 embryo obtained in the EMS group, cut off value = 24.5 years, AUC = 0.594, SE=0.025, 95% CI:0.545–0.643; P<0.001; sensitivity=99.3%, specificity=2.5%, Youden’s index=0.018. E ROC analysis of AMH for predicting a live birth in the EMS group, cut off value = 1.18 ng/mL, AUC=0.549, SE=0.044, 95% CI:0.463–0.635; P>0.05; sensitivity=91%, specificity=26.9%, Youden’s index=0.179. F ROC analysis of AFC for predicting a live birth in the EMS group, cut off value = 13.5, AUC=0.535, SE=0.047, 95% CI:0.444–0.626; P>0.05; sensitivity=46.3%, specificity=69.4%, Youden’s index=0.157. G ROC analysis of EMA size for predicting a live birth in the EMS group, cut off value =34.17 mm, AUC=0.508, SE=0.045, 95% CI:0.419–0.597; P>0.05; sensitivity=43.3%, specificity=60.2%, Youden’s index=0.035. H ROC analysis of female age for predicting a live birth in the EMS group, cut off value = 24 years (AUC=0.630, SE=0.044, 95% CI:0.544–0.715; P<0.01; sensitivity=100%, specificity=1.9%, Youden’s index=0.019
Figure 2 (E-H) illustrates the ROC analyses for predicting a live birth in the EMS group. Thresholds were: female age ≤ 24 years (AUC = 0.630, SE = 0.044, 95% CI:0.544–0.715; P < 0.01; sensitivity = 100%, specificity = 1.9%, Youden’s index = 0.019), AMH ≥ 1.18 ng/mL (AUC = 0.549, SE = 0.044, 95% CI:0.463–0.635; P > 0.05; sensitivity = 91%, specificity = 26.9%, Youden’s index = 0.179), AFC > 13.5 (AUC = 0.535, SE = 0.047, 95% CI:0.444–0.626; P > 0.05; sensitivity = 46.3%, specificity = 69.4%, Youden’s index = 0.157), and endometrioma size ≤ 34.17 mm (AUC = 0.508, SE = 0.045, 95% CI:0.419–0.597; P > 0.05; sensitivity = 43.3%, specificity = 60.2%, Youden’s index = 0.035).
Figure 3 further shows the ROC analyses for predicting one High-quality D3 embryo yield in the pre- and post-EMS groups. In the pre-EMS group (Fig. 3A to D), thresholds were: AMH > 1.535 ng/mL (AUC = 0.658, SE = 0.052, 95% CI:0.555–0.760; P = 0.001; sensitivity = 74.9%, specificity = 59.5%, Youden’s index = 0.344), AFC > 8.5(AUC = 0.656, SE = 0.049, 95% CI:0.559–0.752; P = 0.001; sensitivity = 67.1%, specificity = 61.9%, Youden’s index = 0.290), female age ≤ 21 years (AUC = 0.566, SE = 0.048, 95% CI:0.473–0.660; P > 0.05; sensitivity = 100%, specificity = 0%, Youden’s index = 0), and endometrioma size ≤ 17.15 mm (AUC = 0.543, SE = 0.051, 95% CI:0.442–0.643; P > 0.05; sensitivity = 85.8%, specificity = 19.0%, Youden’s index = 0.048). In the post-EMS group (Fig. 3E to H), thresholds were: AFC > 6.5(AUC = 0.667, SE = 0.03, 95% CI:0.608–0.725; P < 0.001; sensitivity = 75.0%, specificity = 54.6%, Youden’s index = 0.296), AMH ≥ 1.175 (AUC = 0.703, SE = 0.029, 95% CI:0.647–0.759; P < 0.001; sensitivity = 64.8%, specificity = 73.1%, Youden’s index = 0.379), female age ≤ 25.5 years (AUC = 0.604, SE = 0.03, 95% CI:0.546–0.662; P = 0.001; sensitivity = 98.3%, specificity = 5.0%, Youden’s index = 0.033), and endometrioma size ≤ 58.5 mm (AUC = 0.552, SE = 0.03, 95% CI:0.494–0.611; P > 0.05; sensitivity = 90.2%, specificity = 9.9%, Youden’s index = 0.001).
Fig. 3
Receiver operating characteristic (ROC) analyses for predicting a high-quality D3 embryo in the pre-EMS and post-EMS groups. A ROC analysis of anti-Müllerian hormone (AMH) for predicting a high-quality D3 embryo obtained in the pre-EMS group, cut off value = 1.535, area under the ROC curve (AUC) =0.658, standard error (SE)=0.052, 95% CI:0.555–0.760; P=0.001; sensitivity=74.9%, specificity=59.5%, Youden’s index=0.344. B ROC analysis of antral follicular count (AFC) for predicting a high-quality D3 embryo obtained in the pre-EMS group, cut off value = 8.5, AUC=0.656, SE=0.049, 95% CI:0.559-0.752; P=0.001; sensitivity=67.1%, specificity=61.9%, Youden’s index=0.290. C ROC analysis of female age for predicting a high-quality D3 embryo obtained in the pre-EMS group, cut off value = 21 years, AUC=0.566, SE=0.048, 95% CI:0.473–0.660; P>0.05; sensitivity=100%, specificity=0%, Youden’s index=0. D ROC analysis of endometrioma (EMA) size for predicting a high-quality D3 embryo obtained in the pre-EMS group, cut off value = 17.15mm, AUC=0.543, SE=0.051, 95% CI:0.442–0.643;P>0.05; sensitivity=85.8%, specificity=19.0%, Youden’s index=0.048. E ROC analysis of AMH for predicting a high-quality D3 embryo obtained in the post-EMS group, cut off value = 1.175, AUC=0.703, SE=0.029, 95% CI:0.647-0.759; P<0.001; sensitivity=64.8%, specificity=73.1%, Youden’s index=0.379. F ROC analysis of AFC for predicting a high-quality D3 embryo obtained in the post-EMS group, cut off value = 6.5, AUC=0.667, SE=0.03, 95% CI:0.608-0.725; P<0.001; sensitivity=75.0%, specificity=54.6%, Youden’s index=0.296. G ROC analysis of female age for predicting a high-quality D3 embryo obtained in the post-EMS group, cut off value = 25.5, AUC=0.604, SE=0.03, 95% CI:0.546-0.662; P=0.001; sensitivity=98.3%, specificity=5.0%, Youden’s index=0.033. H ROC analysis of EMA size for predicting a high-quality D3 embryo obtained in the post-EMS group, cut off value = 58.5mm, AUC=0.552, SE=0.03, 95% CI:0.494-0.611; P>0.05; sensitivity=90.2%, specificity=9.9%, Youden’s index=0.001
Comments (0)