
Remember me
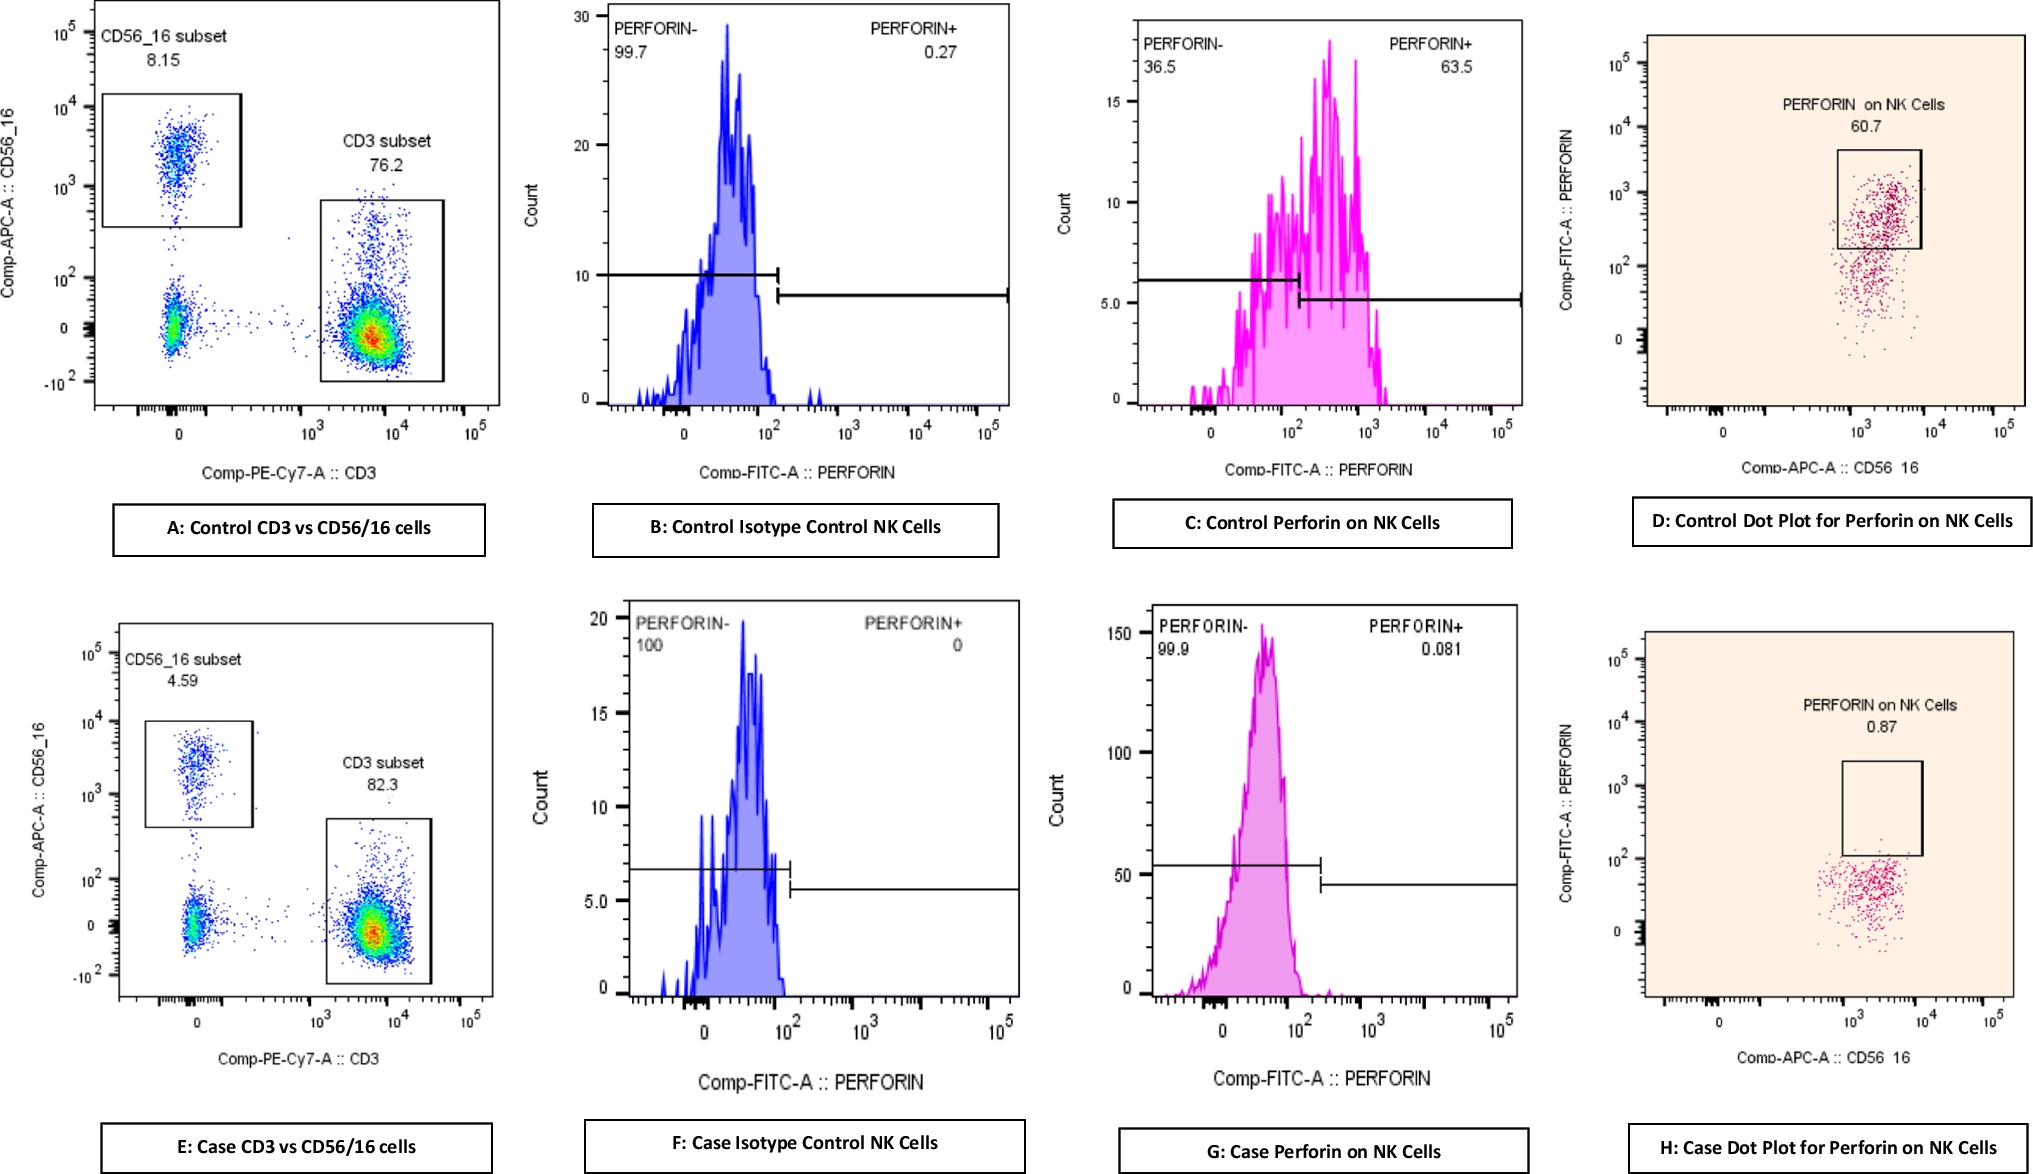


One hundred and twenty healthy adult Danish blood donors were recruited for the study (Fig. 1). The cohort included 64 females and 56 males. Participants’ ages had a median of 43 years, ranging from 20 to 65 years. Each participant provided a pre-vaccination blood sample, received the PPV vaccine, and then provided a post-vaccination blood sample. The pre-vaccination samples were collected on the day of vaccination. The median time from vaccination to post-vaccination sample collection was 42 days, with a range of 30 to 56 days. Pre- and post-vaccination samples were analyzed for IgG antibodies to twelve CPSs present in PPV (CPS 1, −3, −4, −5, −6B, −7 F, −9 V, −14, −18 C, −19 A, −19 F, and − 23 F), using a multianalyte bead immunoassay (Supplementary Table 1).
Fig. 1
Overview of the Experimental Workflow: Blood samples were collected from participants, and the PPV vaccine was administered on the same day. A second blood sample was taken after a median of 42 days. All blood samples were analyzed in a single batch for IgG antibodies against 12 specific capsular polysaccharides (CPS) included in PPV using a multiplex, fluorescent bead-based assay
Adverse EffectsNo immediate hypersensitivity reactions to vaccination were observed. One potential adverse event was reported: symptoms of adhesive capsulitis of the shoulder, which gradually resolved with physiotherapy.
Assessment of Polysaccharide Responsiveness in Danish Blood Donors using the AAAAI GuidelinesWe applied the measured anti-CPS antibody concentrations to determine the participants’ polysaccharide responsiveness using the interpretation rules in the AAAAI guidelines [4]. The participants were Danish blood donors, who are generally healthier than the general population [19, 20] because individuals with recent illness, high-risk behaviors, chronic diseases, on medication etc. are excluded from donation. Strikingly, only three participants (2.5%) were classified as having a normal polysaccharide response (Fig. 2). Thirty-six participants (30%) had mild deficiency, 77 participants (64%) had moderate deficiency, and four participants (3.3%) had severe deficiency.
Fig. 2
Assessment of Polysaccharide Responsiveness in Danish Blood Donors using the AAAAI Guidelines: Polysaccharide responsiveness was assessed following AAAAI guidelines. Antibody concentrations were measured in samples collected before and after vaccination. Interpretation criteria are as follows: Severe deficiency: Two or fewer antibodies with concentrations of 1.3 mg/L or higher after vaccination. Moderate deficiency: Fewer than 70% of antibodies with concentrations of 1.3 mg/L or higher after vaccination (corresponding maximum 8 out of 12 serotypes with concentrations of 1.3 mg/L or higher after vaccination in this specific assay). Mild deficiency: More than two antibodies with concentrations below 1.3 mg/L after vaccination or fewer than 70% of antibodies showing a two-fold or higher increase in concentration after vaccination compared to pre-vaccination levels. Normal response: Any response not meeting the criteria for severe, moderate, or mild deficiency. Participants were classified into a single category, representing the most severe deficiency level applicable
Under the assumption that none of the participants are truly polysaccharide responsiveness deficient, the false-positive rate for use of the AAAAI guidelines in this population is 97.5% (117/120). For moderate or severe deficiency, the false-positive rate is 67.5% (81/120).
Thus, even super-healthy individuals may have only minimal probabilities of classifying as having normal polysaccharide responsiveness according to the AAAAI guidelines. Consequently, we conclude that the guidelines are not useful for testing patients in our setting, and an alternative approach is therefore imperative.
Antibody Concentrations Pre- and Post-VaccinationAs an alternative approach, we advocate expressing each patient’s response relative to a historical reference population. The participants in this study may serve as such a reference population. Previously, we proposed using Z-scores for this purpose, which required transforming measured antibody concentrations to approximate Gaussian distributions [6, 16].
We examined the distribution of antibody measurements in the cohort and found that pre-vaccination measurements generally approximated log-Gaussian distributions for each of the 12 antibodies (Fig. 3 and Supplementary Fig. 1). However, post-vaccination measurements only approximated such distributions for some antibodies, while others showed signs of dichotomous distributions (e.g., anti-CPS1 and anti-CPS5 antibodies). Additionally, for some antibodies, significant proportions of measurements exceeded the quantitative range of the assay used (e.g., for anti-CPS14 antibodies, 19% of measurements were above 50 mg/L).
Fig. 3
Antibody Concentrations Pre- and Post-Vaccination: Histogram representation of concentrations for each of the 12 antibodies measured in study participants. Concentrations measured in pre-vaccination samples are depicted in blue, while concentrations measured in post-vaccination samples are shown in red. Each bin represents a range of antibody concentrations with a width of 0.2 units on a logarithmic scale. The centers of neighboring bins are connected by straight lines. Antilog numbers are presented on the X-axis
Thus, an alternative approach to the Z-scores is needed to effectively utilize data from this cohort.
The Polysaccharide Responsiveness Percentile (PRP)To assess an individual patient’s polysaccharide responsiveness relative to a PPV-vaccinated reference population, we devised a simple, non-parametric approach, as illustrated in Fig. 4.
Fig. 4
The Polysaccharide Responsiveness Percentile (PRP): Overview of the principles for calculating the Polysaccharide Responsiveness Percentile (PRP) for individual patients
The proposed protocol consists of the following steps:
I.The patient receives a PPV vaccination.
II.Multiple anti-CPS antibodies are measured post-vaccination.
III.Each of the patient’s anti-CPS antibody measurements is transformed into the percentile of measurements for that specific antibody in the reference population.
IV.The patient’s percentiles for the different antibodies are summed.
V.The sum of the patient’s antibody percentiles is then transformed into the percentile of similar summed antibody percentiles in the reference population.
This final parameter is referred to as the Polysaccharide Responsiveness Percentile (PRP).
To ensure reliable comparison, the time elapsed after vaccination and the specific antibodies measured should be consistent between the patient and the reference population.
Impact of Increasing Antibody Number on PRP RobustnessInclusion of more antibodies for calculating the PRP likely increases the robustness of results by reducing the impact of outliers. We examined the practical impact using the participants’ post-vaccination data by analyzing the correlations between PRPs determined from sets of antibodies, with each set containing data from between one and six antibodies. For antibody selection in each set, we applied a conservative approach, compiling data from antibodies that showed the weakest correlations based on their mutual Pearson’s correlation coefficients (Supplementary Fig. 2). Even with this conservative approach, we found that increasing the number of antibodies gradually increased the correlation between PRPs determined from different antibodies (Fig. 5).
Fig. 5
Impact of Increasing Antibody Number on PRP Robustness: Scatter plots illustrating the correlation between PRP of antibody sets, incorporating data from one to six different antibodies for individual participants. The antibody selection process aimed to generate sets with the weakest possible mutual correlation, as detailed in the supplementary data file. Linear regression curves with their 95% confidence intervals are depicted in purple, while the red lines represent the line of identity (y = x). Notably, as more antibodies are included in each set, the regression curve approximates the line of identity, and the R² value increases
We conclude that as many antibodies as possible should ideally be included in the PRP calculation. However, since the reduction of standard error is approximately inversely proportional to the square root of the antibody number (acknowledging that measurements from different antibodies in the same individual are not strictly independent), the marginal benefit of including more than 10–12 antibodies is subtle. Thus, including 10–12 antibodies may provide a pragmatic balance between robustness, practicality, and costs.
PRP Variability Across Participant CharacteristicsSeveral factors might impact PRP, including age, sex, vaccine batch, and the time elapsed from vaccination to post-vaccination anti-CPS antibody measurement. Given the potential variability of these factors among patients, we conducted a comprehensive analysis to assess their effects within our cohort, incorporating data for all twelve antibodies.
Our analysis found no statistically significant association between age and either pre-vaccination or post-vaccination PRP in a linear regression model (Fig. 6A and B). However, there was a slight trend towards decreasing post-vaccination PRPs with increasing age, with a point estimate of −0.28 percentiles per year (95%CI: −0.68, 0.11), i.e., not statistically different from 0.
Fig. 6
PRP Variability Across Participant Characteristics: A: Scatter plot showing the relationship between age and PRP incorporating all 12 measured antibodies pre-vaccination. Linear regression line with 95% confidence intervals is shown in purple. The red line represents y = 50, which falls within the confidence intervals of the regression line, indicating that the analysis does not support a significant relationship between age and the antibody measurements before vaccination. B: Scatter plot as described in panel A, but for PRP post-vaccination. The red line (y = 50) similarly falls within the confidence intervals of the regression line, indicating that the analysis does not support a significant relationship between age and antibody measurements after vaccination. C: Scatter plot depicting PRP pre-vaccination (left) and post-vaccination (right) vaccination, stratified by sex. Unpaired mean differences in PRP between sexes, with 95%CI, were calculated from 5000 bootstrap samples and are shown in grey. No significant differences were identified between the sexes at either time point. D: Scatter plot presenting post-vaccination PRP, stratified by vaccine batch (I: U019976, II: U023456, and III: U035558). Unpaired mean differences in PRP between batches, with 95%CI, were estimated similarly to panel C. No significant differences were found between vaccine batches. E: Scatter plot illustrating the relationship between post-vaccination PRP, and time elapsed from vaccination. Data analysis was performed as described for panel A. No significant relationship was observed between time from vaccination until determination of post-vaccination PRP
Similarly, we observed no significant association between sex and PRP, both pre-vaccination and post-vaccination, although point estimates were slightly higher for females: 9.4 (95%CI: −0.63, 20) pre-vaccination and 5.0 (95%CI: −4.6, 16) post-vaccination (Fig. 6C).
Additionally, there was no significant association between vaccine batch and PRP (see Fig. 6D). Furthermore, the time elapsed from vaccination to post-vaccination anti-CPS antibody measurement showed no association with PRP (Fig. 6E). As a sensitivity analysis, participants with post-vaccination samples collected 42 days after vaccination (n = 62) were excluded, and PRPs were compared between participants with earlier and later collected post-vaccination samples. The unpaired mean difference in PRP was 1.53 (95%CI: −12.9, 16.0), i.e., not statistically significantly different from 0.
In summary, our analysis did not reveal any significant influence of these factors on PRP within our cohort. Although subtle effects cannot be entirely ruled out, they are likely negligible and can be disregarded when assessing individual adult patients using an adult reference population.
Relationship Between Pre- and Post-Vaccination PRPWe examined the correlation between pre-vaccination and post-vaccination PRP in our cohort, incorporating data for all twelve antibodies. Using a linear regression model, we observed a moderate to strong correlation, with an R-squared value of 0.43 and a slope estimate of 0.66 (95%CI: 0.52, 0.79) (Fig. 7). These findings demonstrate a significant relationship between pre-vaccination and post-vaccination PRP within the cohort. Thus, the level of naturally occurring anti-pneumococcal antibodies partially predicts the capacity assessed by diagnostic vaccination.
Fig. 7
Relationship Between Pre- and Post-Vaccination PRP: Scatter plot showing the relationship between pre-vaccination PRP and post-vaccination PRP in the participants. The linear regression line with 95%CI is shown in purple. The red line represents y = 50, which does not fall within the confidence intervals of the regression line. This analysis supports a significant relationship between PRP measured before and after vaccination. Regression line slope estimate: 0.66 (95%CI: 0.52, 0.79)
Comments (0)