
Remember me


The patient accepted a whole exon sequencing (WES) at the age of 8, according to which a mutation in his MSN gene was identified. The results of a Sanger sequencing analysis of patient sample also illustrated a point mutation on the patient’s MSN gene (Fig. 1A). The codon “CGG” coding for the amino acid arginine (R) in HC was replaced by “TGG” coding for tryptophan (W) in the patient’s sample. Specifically, the MSN gene was presented with a hemizygous missense variant of c.511 C > T, p.Arg171Trp (p.R171W), which is in the FERM domain near the N-terminal region of MSN protein (Fig. 1B). WES analysis for the patient’s biological parents verified that the mutated gene was inherited from one mutant X chromosome from his mother, who is a heterozygous female (Fig. 1C).
Fig. 1
Patient with a mutation in the MSN gene and clinical examination. (A) Identical MSN gene variants of c.511C>T, p.Arg171Trp (p.R171W) in patient. (B) Composition diagram of the MSN protein. The p.R171W mutation is in the FERM domain near the N-terminal region. (C) Family tree: The father (Unaffected male) carries wild-type alleles. The mother (Heterozygous female) is heterozygote. The patient (Proband) carries a hemizygous missense from the mother. (D-F) Three chest CT scans of the patient: Bronchopneumonia in May 2023 (D). Pneumonia in March 2024 (E). Multiple microbial pulmonary infections in April 2024 (F).
This particular mutation had previously been documented in 2016 by some French researchers, however, patients described in their reports exhibited a series of more severe and typical immunodeficiency symptoms, including recurrent infections of bacterial and varicella-zoster virus, inadequate immune response to vaccines, and bigger decline in almost all kinds of peripheral blood immune cells [21]. In comparison, the patient in our case showed relatively mild clinical abnormalities.
Clinical Features of the PatientThe patient was presented to Tongji Hospital in February 2022, at the age of 10, with a chief complaint of fever and cough lasting for 6 days. Chest CT images revealed uneven bilateral lung opacity with multiple faint fuzzy shadows and a slightly thickened and adherent pleura (Supplementary Fig. 1A), indicating bronchopneumonia and pneumonia. The peripheral blood cell examination showed a significant reduction of white blood cells (WBC), neutrophils, and lymphocyte. Additionally, a serum antibody examination demonstrated decreased levels of the patient’s serum IgG and IgM (Table 1). Collectively, the patient was diagnosed with bronchopneumonia, neutropenia, rhinovirus infection, gallstones, and immunoglobulin deficiency. After four days of anti-infection treatment, the patient was discharged on February 26th but was readmitted on March 8th due to a recurrent fever. The absolute number of WBC reached an urgent value of 0.85*10^6 cells/L. Neutrophils and lymphocytes showed a more significant reduction than before, and the proportion of neutrophils was below the normal range (Table 2). The above results led to the diagnosis of agranulocytosis and immunodeficiency.
Table 1 The patient’s immunophenotyping results of lymphocyte subsetsTable 2 The patient’s complete blood count parametersFrom March to June 2023, the patient was readmitted to the hospital, suffering from intermittent fevers. Clinical image examinations revealed a mild pulmonary infection during this period (Supplementary Fig. 1B, C, Fig. 1D). Based on the characteristics of this gene defect, clinical symptoms, and the normal range of C-reactive protein (CRP) and procalcitonin, the patient was clinically considered to have a fungal infection. However, the etiological examination showed all negative results. Despite fluctuations, WBC, neutrophils, and lymphocytes remained below the normal range, and reassessment of the serum IgG and IgM levels showed significantly lower than normal (Table 1). Additionally, there was a slight decrease in monocyte population, with a minimum count of 0.09*10^9 cells/L (Table 2). Besides the anti-infection and anti-inflammation treatments, this time the granulocyte colony-stimulating factor (G-CSF) treatment was employed from May 24th to June 7th. During that period, the count of neutrophils reached the normal level 3 times and once peaked at 5.76*10^6 cells/L on June 2nd (not shown in the table).
Peripheral blood flow cytometry analysis was performed at two time points to further identify the immunophenotypes of the patient’s blood lymphocytes during his stay in the hospital (Table 1). Consistent with the diagnosis of immunodeficiency, the results demonstrated markedly reduced total cell counts of total T cells, B cells, and NK cells. The count of CD3+CD4+ T lymphocytes was considerably reduced, which may result in a relative rise of CD3+CD8+ T lymphocyte proportion as well as a decrease in Th/Ts value. Among all the dysregulations observed, the reduction of CD3−CD19+ B lymphocytes and CD3−/CD16+CD56+ NK cells were particularly noteworthy at the two time points. Specifically, the total B lymphocyte count plummeted to 86 cells/µL on February 23rd, 2022, and continued to decrease to 51 cells/µL on March 24th, 2023. The count of NK cells at the two time points was 16 cells/µL and 48 cells/µL respectively, significantly lower than normal. However, it is worth noting that the immunologic profiling of the cells could be partly affected by some medication such as methylprednisolone and G-CSF.
From March to April 2024, the patient was admitted to the hospital with a fever. Different from the previous diagnosis last year, the patient was highly considered to have multiple microbial pulmonary infections, including fungal, bacterial and viral infections, based on clinical symptoms and the targeted next - generation sequencing (tNGS) of sputum from Wuhan Kingmed Center for Clinical Laboratory Co. Ltd. (Microbial estimated concentrations (copies/mL): Both Streptococcus pneumoniae, Hemophilus influenzae, Rhinovirus A and Epstein-Barr virus were greater than 1.0 × 10^6). Chest CT images were shown the patient had more severe pneumonia than in 2023 during this period (Fig. 1E, F). Other fine immunophenotypes in the patient’s multiple microbial infections status differed from that of the infection status in last year, which will be discussed further in this article. The patient was discharged after condition improved, based on the anti-infection and G-CSF treatments.
In July 2024, the patient successfully accepted bone hematopoietic stem cell transplantation (HSCT) from a donor in Tongji Hospital. The pre-transplantation examination showed that the numbers of WBC, neutrophils, lymphocytes, and monocytes were all below the normal ranges (Table 2).
The results of the patient’s bone marrow cytology in 2018 at the age of 6 may provide valuable insights into the underlying pathology of his disease. According to the marrow smear, there was hyperplasia in the granulocyte system with an elevated proportion of 69.5%, while the lymphocyte system showed a proportional decrease to 10.25%. However, within the granulocyte system, there was a significant decrease observed in neutrophilic segmented granulocytes (0.50%, reference: 9.44 ± 2.92%), despite increased levels of myeloblasts, neutrophilic myelocytes, and neutrophilic stab granulocytes. Within the lymphocyte system, there was an increase in prolymphocytes but a marked decrease in mature lymphocytes (9.50%, reference: 22.78 ± 7.04%). Additionally, there was a significant reduction in plasmacyte proportions (0.25%, reference: 0.710 ± 0.42%). We can infer from the results above that MSN p.R171W mutation significantly impairs the differentiation and the development processes of immune cells in the bone marrow.
Overall, the patient’s clinical manifestation supported the diagnosis of immunodeficiency, agranulocytosis and repeated infection. In this study, we investigated the proportional and functional changes of the patient’s immune cells from peripheral blood collected in May 2023 and April 2024.
Decreased Colocalization of MSN and BCR in Activated B CellsAccording to the clinical reports from 2022 to 2023, the patient’s peripheral B cells and serum antibodies were significantly lower than normal values. Levels of serum antibodies are highly related to the immune response of B cells, specifically the class-switched memory B cells. Interestingly, the flow cytometry results showed that MSN expression levels in CD19+ B cells were lower than HC, especially in class-switched memory B cells (Fig. 2A).
Fig. 2
Decreased colocalization of MSN and BCR in B cells. (A) MSN expression of B cells (CD19+) and switched memory B cells (CD19+CD27+IgD−) in PBMCs from 3 age-matched HC and the patient were detected by flow cytometry. (B) Confocal microscopy images of B cells in PBMCs from HC and the patient labeled BCR and stimulated with AF594 F(ab’)2 goat anti-human IgG+IgM for the indicated times, then fixed, permeabilized, and stained with antibodies of MSN and F-actin. Scale bar=2um. (C) Confocal microscopy analysis quantified for median fluorescent intensity (MFI) of MSN and F-actin. (D) Confocal microscopy analysis measured for correlation coefficient between MSN, F-actin and BCR. MFI and Pearson’s correlation coefficient were quantified for at least 30 cells by using NIS-Elements AR 5.20 software and data were presented as mean ± SEM (C, D). Samples were collected in April 2024.
The confocal laser scanning microscopy (CLSM) was then applied to visualize BCR, MSN, and F-actin changes in B cells after the free antigen F(ab’)2 stimulation. The MFI of MSN and F-actin was consistent with the trend after 5 min and 10 min of F(ab’)2 stimulation, but at each point, the MFI in patient B cells was lower than the HC group (Fig. 2B, C). More importantly, the correlation coefficient between BCR and MSN, F-actin and BCR, F-actin and MSN all decreased at 5 min and 10 min compared to HC (Fig. 2B, D). The cytoskeleton protein F-actin in B cells assists BCR translocation on the cell membrane and BCR cluster formation and stabilization upon antigen stimulation, thus the colocalization of F-actin and BCR is important for B cell activation and BCR signaling [28]. We also observed Ezrin, another intracellular molecule belonging to the ERM family to help the F-actin work. However, no significant difference can be spotted between the patient and HC at both 5 min and 10 min (Supplementary Fig. 2A), indicating that the changes in F-actin and BCR were affected by MSN mutant. Based on the above results, it is reasonable to deduce that MSN p.R171W mutation affects its ability to link F-actin to the cell membrane, thus affecting the interaction between F-actin and BCR, eventually interrupting B cell activation.
Dysregulated Peripheral B Cell Subsets and FunctionsTo further examine the differentiation and development of B cells in the patient’s peripheral blood, PBMCs were extracted from the patient and analyzed by flow cytometry in May 2023. The results revealed that consistent with the clinical results, the proportion of CD19+ B cells were significantly reduced compared with HC of the same age and sex (Fig. 3A). The further flow cytometry analysis revealed a significant reduction in the proportions of transitional B cells, switched memory B cells (SWM), and plasmablasts of the patient compared to HC, while a slight increase of naïve B cells can be observed (Fig. 3B, C). Meanwhile, the reduced plasmablasts and switched memory B cells and the relatively increased naïve B cells indicated impaired cell maturation and antibody class switching in the peripheral blood. A reduced proportion of immature IgDlow B cells and impaired exit of immature B cells from bone marrow were observed in MSN-deficient mice previously [27], consistent with the results of the patient in this case.
Fig. 3
Dysregulated peripheral B cell subsets and functions. (A-L) Flow cytometry data on CD19+ B cells (A, F), transitional B cells (CD19+CD24+CD38+), plasmablasts (CD19+CD24−CD38+) (B, G), switched memory B cells (CD19+CD27+IgD−), unswitched memory B cells (CD19+CD27+IgD+), naïve B cells (CD19+CD27−IgD+) (C, H), double-negative B cells (DNs, CD19+CD27−IgD−) (I), DN1 (IgD−CD27−CXCR5+CD11c−), DN2 (IgD−CD27−CXCR5−CD11c+), DN3 (IgD−CD27−CXCR5−CD11c−), and DN4 (IgD−CD27−CXCR5+CD11c+) (J) in PBMCs from 3 age-matched HC and patient. (D) Flow cytometry analysis of CD19 MFI on CD19+ B cells and switched memory B cells (CD19+CD27+IgD−). (E) Flow cytometry analysis of CD80 and CD62L expression on CD19+ B cells and switched memory B cells (CD19+CD27+IgD−). (K) Flow cytometry analysis of percentage of Annexin V+ on CD19+ B cells. (L) Flow cytometry analysis of percentage of Ki67+ on CD19+ B cells. The percentage of each B cell subset is represented graphically for the HC (blue bars) and the patient (orange bars). (A-E) Samples were collected in May 2023. (F-L) Samples were collected in April 2024.
We further examined some functional molecules of the patient’s peripheral B cells with a focus on class-switched memory B cells due to the remarkably reduced antibodies. Results of flow cytometry showed that the percentage of CD80+ cells and CD62L+ cells both demonstrated a significant elevation in the patient’s class-switched memory B cells compared to HC (Fig. 3E), and the MFI of CD62L and CD80 in the two cell groups were both higher than HC (Supplementary Fig. 2B), consistent with the findings in MSN-deficient mice [27]. L-selectin (CD62L), also known as leukocyte-endothelial cell adhesion molecule (LECAM-1), mediates the initial lagging and rolling of leukocytes with the endothelium. CD62L plays an important role in the lymphocyte homing and recycling processes [29]. These changes may be because the patient is in an infectious state. CD80, also known as B-lymphocyte activation antigen B7-1, is expressed on the surface of antigen-presenting cells, and together with the T-cell surface receptors CD28 and CTLA4, constitute one of the major co-stimulatory pathways regulating T cell and B cell responses, giving signals for initial T cell activation and prompting T cell activation, proliferation and differentiation [30]. Therefore, the present results emphasize the importance of MSN in regulating the co-stimulatory effects within B cells and T cells, which may to some degree explain the notable increase of Tem among the patient’s peripheral CD4+ and CD8+ T cells in our later findings. However, a previous article reported that in mice, CD80+ PD-L2+ MBCs produce a much higher level of IgG1 than CD80− PD-L2− or CD80− PD-L2+ MBCs [31], while in our case the serum IgG was very low. Therefore, we believe that the increase of CD80+ MBC in the patient is closely related to the occurrence of recurrent infection. We also examined the expression levels of CD19 in total CD19+ B cells and class-switched memory B cells, and reduced expression levels of CD19 were observed in both two cell groups (Fig. 3D). As a signal transduction molecule expressed throughout all stages of B-cell development, CD19 helps B-cell signal transduction and associates with the development and maturation processes [32]. Hence, the negative effect of MSN p.R171W mutation on B-cell activities cannot be neglected.
In April 2024, when the patient underwent more severe multiple microbial pulmonary infections than in May 2023, his peripheral blood was collected and detected again. Consistent with the previous study, significant decrease in total CD19+ B cells can be observed (Fig. 3F); however, there was a notable increase in transitional B cells and a decrease in unswitched memory B cells at this time, while the remaining B-cell subpopulation proportions did not show any significant differences compared to the previous findings in 2023 (Fig. 3G, H). The disparity in transitional B results may be attributed to variations in the source of infection. Based on CD11c and CXCR5 expressions, we further analyzed four subsets in double negative B cells (DNs, CD27−IgD−) in both HC and the patient [33, 34]. Compared to HC, although the overall percentage of CD27−IgD− B cells showed no significant variance, the patient displayed notable decrease in DN1 (CD11c−CXCR5+) subset (Fig. 3I, J), which is largely recognized as the precursor of memory B cells [35]. Thereby, this result is consistent with our data demonstrating a decrease in patient memory B cells. The alterations in patient DN B cells may reflect the immunological context of the patient and contribute to the disease pathology, as we discovered that in non-acute infection period, the proportion of T-bet+CD11c+CD21low cells in total CD19+ B cells was significantly higher in the patient than in HC (Supplementary Fig. 5L). According to previous reports, this cell population has some overlaps with CD19⁺CD27⁻IgD⁻ (DN) B cells and age-associated B cells (ABC), the increase of which are associated with aging, inflammation, autoimmune disorder, and infection [36, 37]. In addition, an elevation of the percentage of Annexin V+ cells in CD19+ B cells was detected by flow cytometry (Fig. 3K), and the MFI of Annexin V in CD19+ B cells was also elevated shown by the flow histogram (Supplementary Fig. 2C). Hence, the patient’s B cell exhibited a higher level of apoptosis than HC, which probably contributed to the reduction of peripheral B cells [38].
B cell proliferation ability was also tested by measuring Ki-67 expression. We observed increased percentages of Ki-67⁺ cells in total CD19⁺ B cells compared to HC (Fig. 3L). These results suggest that B cells exhibit active proliferation, particularly under infectious conditions. Although the enhanced proliferation status, the patient B cells exhibited impaired class-switching and antibody secretion. Additionally flow analysis revealed that, compared to HC, the proportion of IgG + cells in the switched memory B cells of patients was significantly decreased (Supplementary Fig. 5F), which corresponds to the decreased IgG in the peripheral blood during clinical examination (Table 1), while there is no significant difference in the proportion of IgA+ Switched memory B cells in patients (Supplementary Fig. 5G). Moreover, the gMFI of IgM showed no significant difference on the surface of patient total CD19+ B cells and Naïve B cells but decreased markedly on unswitched memory B cells (USWM). Meanwhile, the gMFI of IgD showed no significant difference on the surface of total CD19+ B cells and USWM B cells but was markedly elevated on Naïve B cells (Supplementary Fig. 5H). Additional ELISA analysis using plasma samples collected before transplantation during a non-acute infectious state revealed that the levels of IgM and IgG were markedly lower than those in HC (Supplementary Fig. 5I), indicating an intrinsic impairment in antibody production even in the absence of acute infection.
Overall, MSN p.R171W mutation resulted in dysregulated differentiation and development of peripheral blood CD19+ B cells, leading to significant subpopulation changes. Cellular activities like apoptosis, migration, and adherence were affected in different degrees. Although some changes (especially for the transitional B cell) were different among various pathogen infections, impaired peripheral B cell maturation and antibody secretion were common features.
Reduced Levels of B Cell Spreading and BCR SignalTo investigate the effect of the MSN p.R171W mutation on BCR signal transduction, we extracted B cells from the patient’s blood samples in both May 2023 and April 2024 and stimulated B cells with either membrane-tethered antigen (mAg) or soluble free antigen (sAg).
As it has been shown that BCR activation triggers actin rearrangement, affecting the formation of BCR clusters and thus BCR signaling, we then constructed a lipid bilayer structure and tethered antigens to mimic the process of membrane antigen stimulation of B cells and observed the dynamics of B cells by total internal reflection fluorescence microscopy (TIRFm) and interference microscopy (IRM) in May 2023. In the contact zone, after 3min and 5min of stimulation, the MFI of phosphotyrosine (pY) and BCR in patient cells were significantly lower than HC, suggesting that the overall level of BCR signaling in patients was reduced (Fig. 4A, B). Moreover, the microscopy images and quantified analysis showed a much smaller contact area at 5min in patient cells compared to HC (Fig. 4A, B), indicating an impaired expansion ability in MSN mutant B cells. The MFI of F-actin in patient B cells was also significantly lower than HC at 5min (Fig. 4C, D). Additional flow cytometry analysis showed intracellular F-actin levels in B cell populations from HC and the patient at 0min and 10min after stimulation, and the F-actin level was consistently lower in the patient B cells at both time points compared to HC (Fig. 4E). We counted the foci number of BCR, F-actin and pY in the contact zone of each B cell after stimulation with F(ab’)2 for 5 min and found both foci quantity of BCR, F-actin and pY in the patient B cells were less than in HC (Fig. 4F, G). After stimulating B cells with soluble antigen for 15 min, phosphorylation flow results showed that mutant patient cells had reduced levels of phosphorylation and activation of S6, a distal signaling molecule downstream of the BCR, compared to HC (Supplementary Fig. 2D). S6 is one of the key effector molecules of mTORC1, which phosphorylates S6, and in turn, pS6 promotes protein synthesis through a series of downstream signaling molecules [39]. This result supported the observation of undermined BCR signaling and B cell activation status. However, the MFI of phosphorylated AKT (pAKT) was at the same level as HC, possibly indicating some complementary mechanism for downstream molecules such as AKT activation (Supplementary Fig. 2E). In addition to observing the metabolic changes, PBMCs were stained with dihydroethidium (DHE) and PK Mito to reflect the production of ROS and the mitochondria level in cells respectively. Interestingly, the MFI levels of pk Mito and ethidium in the patient’s B cells were similar to HC, reflecting relatively normal B-cell metabolism (Supplementary Fig. 2F). These results suggested a defect in the patient’s cytoskeletal regulation, indicating disordered cellular spreading and signal transduction upon immune response.
Fig. 4
B cell spreading and BCR signal were reduced in the patient B cells. (A-D) TIRFM and interference reflection microscopy (IRM) analysis of B cells labeled with AF647-Fab–anti-Ig for BCR in PBMCs from age-matched HC and the patient were incubated with lipid bilayers (membrane)-tethered Ag for 3 or 5 minutes and stained with antibodies of F-actin and pY. Scale bar=2um (A, C). TIRFM and IRM analysis quantified for the B cell contact area and for the MFI of BCR, pY and F-actin in the B cell in contact zone. MFI and contact area were quantified for at least 20 cells and data were presented as mean ± SEM (B, D). (E) Flow cytometry analysis of intracellular F-actin expression in B cells (CD19+) in PBMCs from 3 age-matched HC and the patient stimulated with biotin-conjugated F(ab’)2 anti-human IgG + IgM for 0 and 10 min. (F, G) Representative TIRFM images of B cells in PBMCs from age-matched HC and the patient indicating the intracellular amount of BCR, F-actin and pY. Quantification shows BCR, F-actin and pY foci per cell (mean ± SEM). (H) Flow cytometry analysis of intracellular pY expression in B cells (CD19+) in PBMCs from 3 age-matched HC. Fold changes of the MFI of phosphoproteins following 5 min stimulation with biotin-conjugated F(ab’)2 anti-human IgG + IgM compared with unstimulated. (I, J) Confocal microscopy images of B cells in PBMCs from HC and the patient labeled BCR and stimulated with AF594 F(ab’)2 goat anti-human IgG + IgM for the indicated time, then fixed, permeabilized, and stained antibodies of pY. Scale bar=2um. (I). Confocal microscopy analysis quantified for MFI of pY and Pearson’s correlation coefficient between pY and BCR (J). MFI and correlation coefficient were quantified for at least 30 cells by using NIS-Elements AR 5.20 software and data were presented as mean ± SEM. ). (A-D, F-G) Samples were collected in May 2023. (E, H-J) Samples were collected in April 2024.
Consistent with this result, in April 2024, we performed phosflow analysis of the ratio of 5min intracellular pY to 0min in B cells, showed a decrease in the patient compared to HC (Fig. 4H), and the accumulation of intracellular pY from 0min to 5min was impaired in the patient’s B cells as indicated in the histogram (Supplementary Fig. 2G). We used CLSM to observe B cells after sAg stimulation. After 5 minutes of F(ab’)2 stimulation, the confocal results revealed a lower level of pY as well as its co-localization with BCR in the patient’s B cells compared to HC (Fig. 4I, J). The decreased levels of pY suggested a reduced overall BCR signaling in this patient. Additionally, the reduced co-localization between BCR and pY implied impaired interaction and communication between the signalosomes. However, the endocytosis of the membrane BCR into the cytoplasm was not affected as the ratio of membrane BCR quantity at 2 min and 10 min to the initial membrane BCR quantity showed no significant change in the patient’s B cells compared to HC (Supplementary Fig. 2H).
The overall results were consistent with a previous report demonstrating that MSN/Ezrin-knockdown genes caused impaired BCR microcluster formation and aggregation [13]. In addition, the results showed a great dysfunction of MSN mutant B cells in response to in vitro antigen stimulation, with impaired ability of cell spreading and reduced levels of BCR, F-actin, and pY signalosomes. We presume that patients bearing MSN p.R171W mutation may have disorder of B cell membrane liquidity, which hindered the formation of BCR clusters on the cell surface thus impairing BCR signaling. In other words, BCR molecules and F-actin may highly diffuse among the cells, failing to reach the activated concentration towards the external stimuli.
Dysregulated Peripheral T Cell Subsets and FunctionsApart from B-cell population alterations, the patient’s T-cell population also exhibited proportional and functional changes. In May 2023, the detection of peripheral CD3+ T cells by flow cytometry revealed no marked difference in the proportion of CD4+ T cells and CD8+ T cells between the patient and HC (Supplementary Fig. 3A). However, in both CD4+ and CD8+ T cell populations, the patient exhibited a notable decrease in the percentage of naïve T cells compared to HC. Conversely, the patient showed a marked increase in central memory T cells (Tcm) and effector memory T cells (Tem). The percentage of terminally differentiated effector memory T cells re-expressing CD45RA cells (Temra) was relatively similar between the patient and HC in CD4+ T cells, and higher in patient CD8+ T cells (Fig. 5A-C). These results suggested that the patient had a skewed T cell population, with reduced naïve T cells and an expansion of memory T cells, possibly indicating immune activation or chronic infection which is consistent with his medical history.
Fig. 5
Dysregulated peripheral T cell subsets and functions. (A-L) Flow cytometry data on CD3+CD4+ T cells, CD3+CD8+ T cells, CD4+ or CD8+ naïve (TN, CCR7+CD45RA+), central memory (Tcm, CCR7+CD45RA−), effector memory (Tem, CCR7−CD45RA−), terminally differentiated memory (Temra, CCR7−CD45RA+) (A, H) and Vδ2+T cells (F) in PBMCs from 3 age-matched HC and patient. The percentage of each CD4+ T cell (B, I) and CD8+ T cell (C, J) subsets are represented graphically for the HC (blue bars) and the patient (orange bars). Flow cytometry analysis of CD62L MFI and percentage of CD62L+ on CD8+ T cells, CD8+ TN and CD8+ Tcm (D). Flow cytometry analysis of ICAM-2 or SELPLG MFI on CD4+ or CD8+ T cells (E, L). Flow cytometry analysis of CD4+ T, CD8+ T, Vδ2+ T cells stained with Dihydroethidium(DHE) and PK Mito Deep Red. MFI of ethidium and pk mito were shown (G). Flow cytometry analysis of percentage of perforin+ on CD8+ T cells (K). (A-G) Samples were collected in May 2023. (H-L) Samples were collected in April 2024.
We further detected some molecular changes to observe the functions of T cells. Flow cytometry plots and histograms showed the CD62L+ population within CD8+ T cells, T naïve cells, and Tcm, where CD62L is a marker indicative of lymphocyte homing and memory formation. The patient exhibited reduced CD62L+ cells particularly in CD8+ T cells and T naïve cells (Fig. 5D). We also detected the expression of intercellular adhesion molecule-2 (ICAM-2) on CD4+ and CD8+ T cells, as well as within T naïve and Tcm subsets. Across both CD4+ and CD8+ populations, histograms showed that the patient had larger ICAM-2+ cell populations compared to HC. This pattern is consistent across the T naïve and Tcm subsets (Fig. 5E). ICAM2, also known as CD102, is a member of the immunoglobulin superfamily that binds LFA-1 and Mac-1 and is involved in cell adhesion [40]. This upregulation of ICAM-2 in the patient possibly reflected heightened cell-cell adhesion ability in response to an inflammatory or disease-driven condition. In addition to T-cell proliferation capacity, based on expression levels of Ki67, a marker for cell proliferation, the overall proliferation rates were enhanced in both CD4+ and CD8+ T cell populations compared to HC, particularly within the T naïve subset. However, proliferation rates were weakened within the Tem and Temra populations (Supplementary Fig. 3B, D). Therefore, the depletion of the patient’s naïve T cells and the elevation of effector T cells cannot be explained by alterations in their proliferative capacity but could possibly be attributed to impaired cell migration from bone marrow to the periphery and his infection status.
Apart from classic αβT cells, γδ2T cells were also investigated. γδ2T is the most important γδT cell, which is concentrated in peripheral blood and accounts for about 50-90% of γδT cells. Both γδT cells and αβT cells can exert ADCC functions and produce pro-inflammatory cytokines, but γδT cells are not MHC-restricted [41, 42]. Although the percentage of γδT cells showed no significant variance compared to HC (Fig. 5F), the metabolic status of the patient’s γδT cells as well as CD4+ and CD8+ T cells were altered. In the top panel, DHE showed lower fluorescence intensity in patient compared to HC across all T cell subsets (Fig. 5G), suggesting a higher ROS level in patient cells. In the bottom panel, the pk Mito signal is increased in patient cells, with significant differences across CD4+ T and CD8+ T cells (Fig. 5G). These indicated altered mitochondrial function and metabolic stress in the patient’s T cells, which could be related to his disease progression and immune dysfunction.
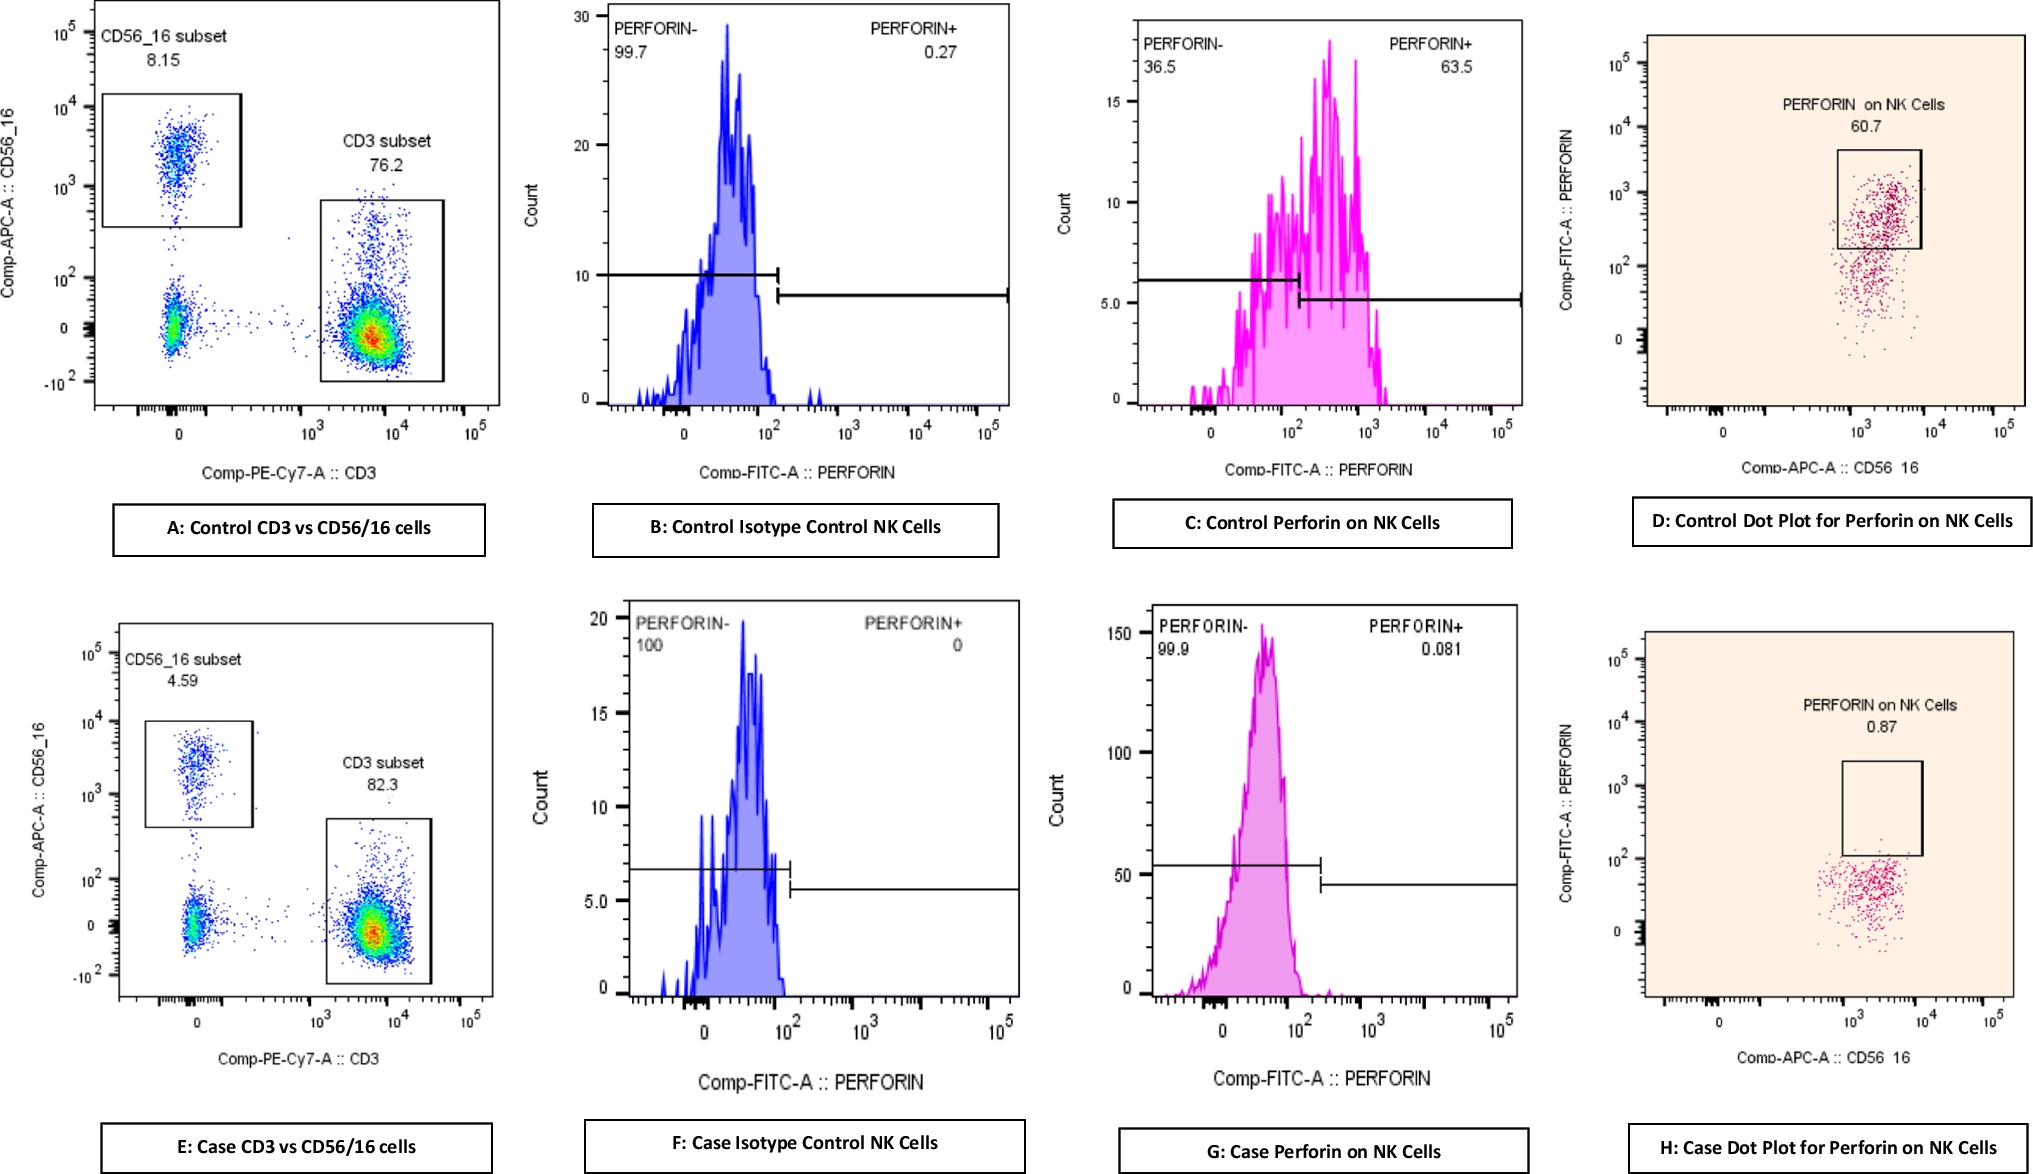
The proportional changes of the patient’s peripheral T cells in April 2024 can be observed inversion ratio of CD4+ T to CD8+ T cells similar to previous case reports (Supplementary Fig. 3C), meanwhile, other subsets were like that in 2023, except that the proportion of Tcm was decreased this time (Fig. 5H-J), which may be attributed to different pathogen infections. Furthermore, we assessed the killing effect on pathogens within the patient’s CD8+ T cells by detecting perforin expression. Perforin is a cytotoxic molecule stored within cytoplasmic granules and can be released by CTL and NK cells through exocytosis to lyse target cells directly [43]. Flow cytometric analysis showed an increased perforin expression level within CD8+ T cells in the patient compared to HC (Fig. 5K), exhibiting an enhanced killing capacity in effector CD8+ T cells. The migration capacity of cells was observed by detecting the expression of P-selectin glycoprotein ligand-1 (SELPLG), which plays a critical role in T-cell migration and homing to sites of inflammation by interacting with selectins on endothelial cells [44]. In both CD4+ and CD8+ T cell subsets, the patient showed a marked increase in SELPLG expression compared to controls. This trend was also observed in T naïve and Tcm subsets, with patients consistently exhibiting elevated SELPLG levels (Fig. 5L). Those results suggested an enhanced ability of these T cells to migrate and adhere to inflamed endothelium, which may be linked to ongoing pathological inflammation.
Significant Changes in NK, iNKT Cells, and Monocytes SubpopulationsInnate immunity also plays a crucial role in the anti-pathogen immune response. To have a deeper insight into the patient’s immune system disorder, we next focused on natural killer (NK) cells, invariant natural killer T (iNKT) cells, and monocytes derived from the patient’s peripheral blood sample in May 2023. Flow cytometry analysis revealed a significant shift in the iNKT cells between the HC and the patient. The patient’s iNKT cell population was drastically reduced compared to HC (Fig. 6A). This reduction in iNKT cell population, an important subset of NKT cells and a key player in lipid antigen recognition and immune modulation, may indicate a compromised ability to regulate immune responses, potentially impacting the patient’s capacity to respond to recurrent infections.
Fig. 6
Significant changes in NK, iNKT cells and monocytes subpopulations. (A-E) iNKT cells (A, CD3+CD1d-PBS57+), NK cells (B, CD56lowCD16+, CD56highCD16−), monocytes among classical (CD14++CD16−), intermediate (CD14++CD16+) and non-classical (CD14+CD16++) monocytes (D) in PBMCs from 3 age-matched HC and patient. The percentage of each subset are represented graphically for the HC (blue bars) and the patient (orange bars). Flow cytometry analysis of ICAM-2 on NK cells (C). Flow cytometry analysis of ICAM-2 or CD80 MFI on total monocytes, classical, intermediate and non-classical monocytes (E). Samples were collected in May 2023.
According to previous clinical tests suggesting peripheral NK cell depletion, we additionally divided NK cells into two groups, CD56highCD16− NK cells and CD56lowCD16+ NK cells. Flow cytometry analysis revealed significant alterations in those two subsets in the patient compared to HC, that the patient exhibited a marked reduction in the percentage of both CD56highCD16− NK cells and CD56lowCD16+ NK cells (Fig. 6B), which are typically associated with cytokine production and cytotoxicity, respectively [45]. The peripheral depletion of NK cells could possibly be attributed to complementary immune responses for undermining adaptive immunity. Moreover, the patient showed elevated expression of ICAM2 in CD56highCD16− subset and decreased expression in CD56lowCD16+ subset, indicating potential alterations in NK cell adhesion and migration capacities (Fig. 6C). Additional experiments on CD56lowCD16+ NK cells showed that the cells had decreased apoptosis levels as indicated by Annexin V and increased late-stage activation status as indicated by HLA-DR (Supplementary Fig. 4A, B). Although the elevated HLA-DR level indicated the enhanced activation state and cytotoxic function within each CD56lowCD16+ NK cell, due to significant total peripheral NK cell depletion, the patient still exhibited severe immunodeficiency. In addition, when defined NK cells as CD56⁺CD3⁻ lymphocytes [46], the proportions of both CD3−CD56low and CD3−CD56high NK cells were decreased compared to HC, especially for CD3−CD56low NK cells (Supplementary Fig. 4E).
Analysis of the monocyte subsets between HC and the patient revealed significant differences in monocyte composition and expression of some surface markers. The percentage of the total monocytes showed a significant depletion in the patient’s peripheral blood compared to HC (Supplementary Fig. 4C). Additionally, the CD14++CD16− classical monocyte population was dominant in HC but was dramatically reduced in the patient. Conversely, the CD14++CD16+ intermediate monocytes are substantially increased in the patient compared to HC. The least populated CD14+CD16++ non-classical monocytes showed a slight decrease in the patient (Fig. 6D). The setting gate of the three monocyte subsets was shown (Supplementary Fig. 4D). Normally, in healthy individuals, classical monocytes constitute most of the total monocyte population and exhibit heightened phagocytic and antimicrobial activities along with increased peroxidase activity compared with non-classical and intermediate ones [47]. Additionally, they possess higher levels of chemokine receptors enabling migration towards sites of injury and inflammation [48]. Therefore, the diminished percentage of CD14++ classical monocytes observed in the patient’s peripheral blood suggested impaired phagocytosis and pathogen clearance capabilities within the monocyte populations. Further analysis of ICAM-2 and CD80 expressions on monocytes and their subsets showed a reduced ICAM-2 expression in all patient’s monocyte subsets compared to HC, increased CD80 expression in the patient’s classical and intermediate populations, and a decreased CD80 expression in non-classical populations (Fig. 6E). These changes in monocyte subset distribution, adhesion markers, and co-stimulation markers suggested dysregulated function
Comments (0)